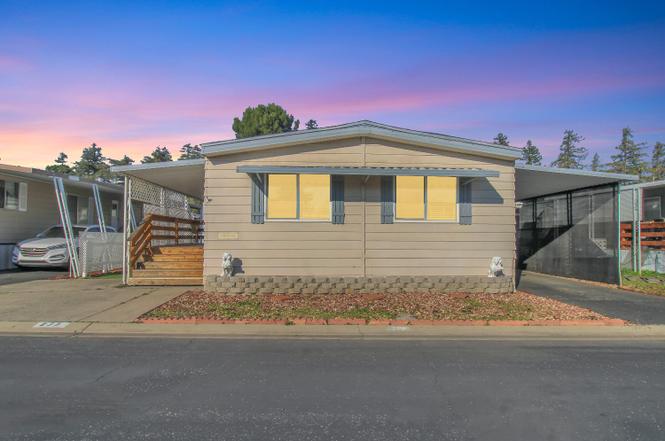
2621 Prescott #277 · Modesto, CA
Flood risk 1/10 · Minimal
- FEMA flood zone
- X (unshaded)
- Chance of flooding over 30 yrs
- 0.0%
- Est. flood insurance / yr
- $507 – $1,088
Fire risk 5/10 · Moderate
- Est. fire insurance / yr
- $659 – $1,223
Heat risk 6/10 · Moderate
- Hot days now (above 102°F)
- 7 days/yr
- Hot days in 30 yrs
- 15 days/yr
Wind risk 1/10 · Minimal
- Chance of severe wind over 30 yrs
- —
Air-quality risk 10/10 · Severe
- Unhealthy air days now
- 28 days/yr
- Unhealthy air days in 30 yrs
- 32 days/yr
Risk factors via First Street. Map © Google.
Why this score? — see what drove the B+ grade
The composite is a weighted blend of 9 inputs, each scored 0–100. Each bar is that input's sub-score; the figure is the points it added to the 100-point composite (weight × sub-score).
- Cash flow +30.0/30.0
- ARV discount +13.7/15.0
- 1% rule +10.0/10.0
- DSCR +10.0/10.0
- Livability +3.2/5.0
- Rent growth +3.1/5.0
- Schools +2.6/10.0
- Condition / age +2.5/5.0
- Appreciation +0.0/10.0
$90,000
🖨 Deal sheet (PDF) 📄 Offer letter ✓ Due diligence
Listing remarks MLS
This home is in a gated senior community (+55 and over) and is available for immediate occupancy. The home offers 3 bedrooms 2 baths with an open floor plan. Covered parking along with a Tuff shed for storage. Stop by and look, make this your home.
Key facts
- Open floor plan
- Covered parking
- New hvac system
Tags
Property features AI
Finance
- Financial info: $810 listed as a land lease amount
- HOA & community: No homeowners association; Located in a senior community; Land lease: No (note: a land lease amount is listed separately)
Exterior
- Parking: Attached covered parking; Guest parking available
- Utilities: Public water; Public sewer; Cable available; Internet available; Individual gas meter; 220 volts in kitchen
- Home design: Manufactured in park (double wide); Manufactured mobile home; Updated/remodeled; Built in 1976
- Construction: Shingle/composition roof; Metal skirting
- Exterior features: Backyard with landscaped front and back; Storage shed(s); Covered deck; Porch
Interior
- Kitchen: Hood over range; Dishwasher; Synthetic countertops
- Bedrooms: 3 bedrooms
- Flooring: Carpet; Tile
- Bathrooms: 2 full bathrooms; Shower stall(s)
- Heating & cooling: Central cooling; Central heating (natural gas)
- Interior features: Updated/remodeled interior; Hood over range; Dishwasher; Covered deck and porch; Dual pane full windows; Deck attached to the living area; Great room; Synthetic kitchen counters; Dining bar and dining/family combo
- Laundry & utility: Washer and dryer included; Washer/dryer hookups; Laundry located inside (inside room/area); 220 volts in laundry
Neighborhood map
What this means for you Summary
Snapshot
- This is a 3-bed/2.0-bath manufactured listed at $90k.
Deal economics
- At list price, monthly cash flow is $1k ($13k/yr) — positive.
- The deal already cash-flows at list — no discount required.
- Meets the 1% rule at list price ($2k rent vs $90k).
- Recommended offer: $79k (12.0% below list) — sets the bar for market timing.
- Cap rate 21.1% vs local median 3.2% in Modesto — top-decile yield for the area; either an underpriced asset or a hidden risk that comps aren't pricing in. Stress-test before assuming the spread holds.
Location & tenants
- Location reads 63/100 on livability (#451 in CA) — a middle-class / working-renter tenant base. Strengths: housing A+; Watch: amenities C-, schools D+, health & safety D+.
- Stanislaus Union Elementary (urban): math 24% / reading 35% proficiency, ranked #344 of 517 in CA (top 66%) — low school quality limits family demand, transient renter base, plan for 1-2y turnover.
- Market conditions: Rents rising (+2.2%/yr); 164 active listings in the ZIP; 29 comparable units currently listed for rent nearby; rentals at typical pace (median 15d on market — plan ~3-4 weeks tenant-placement turnaround); solid renter incomes; 923 units permitted in Stanislaus County in 2024 (63 in 5+ unit buildings).
- This rent runs 35% of the median local income ($76k/yr) — at the standard rent-burdened threshold; future hikes will face affordability resistance.
Forward outlook
- Local home prices are declining (-3.0%/yr); year-one equity from $622 of loan paydown is wiped out by about $3k of value loss. Plan a longer hold.
- Stanislaus County population projected at +14% by 2050 — modest demand growth; plan on rents tracking national, not racing it.
- At projected returns (-3.0% appreciation + 2.2% rent growth), your $25k cash investment doubles in ~3 years — after that, you're playing with house money.
Negotiation context
- It's been on market 157 days — a 12% lower offer ($79k) is reasonable based on typical stale-listing flexibility.
Risks & watch-outs
- Climate carrying-cost: moderate wildfire risk; extreme-heat days projected 7→15/yr by 2055 (HVAC capex compounding) — expect insurance premiums to compound above CPI over the hold.
Questions for the listing agent
- It's been on market 157 days. Have you received any prior offers? Is the seller open to a 12% concession, seller financing, or rate buy-down credit?
- Built in 1976 — when were the roof, HVAC, electrical panel, plumbing, and water heater last replaced?
- Why hasn't it sold? Are there any deal-killer items the seller is aware of (foundation, flood, title, zoning, code violations)?
- Is there a deadline driving the sale (1031 exchange, divorce, estate, relocation)? That informs how much negotiation room exists.
- Schools are D-rated, which usually means shorter tenancies and higher turnover. Who's the typical renter profile here, and what's been the actual vacancy rate?
- Crime grade is F in this area — have there been break-ins, vandalism, or insurance claims at this property in the last 3 years? What carrier currently insures it and at what premium?
- What's the average days-on-market for RENTAL listings here right now (not sales)? A rising rental-DOM trend means longer vacancies and softer asking-rent achievability than the comps imply.
- What's the recent tenant-quality profile in this submarket — average credit score on applications, eviction rate, late-payment / NSF rate, and stable-employment percentage? A property-management company in the area should have these aggregated.
- How much new for-sale + rental construction is in the pipeline within 1–3 miles? Heavy new supply typically softens prices + rents 12–24 months out; constrained supply supports both.
Investment metrics
- 1% rule
- 2.43% ✓
- Cap rate
- 21.05%
- Cash-on-cash
- 52.72%
- DSCR
- 3.35
- GRM
- 3.4
CMA / ARV
- ARV (on-the-fly)
- $104,475
- Comps found
- 12
Show comp detail 12 sales within ~0.75 mi
| Address | Dist | Beds/Ba | Sqft | Sold | Price | $/sf | Match |
|---|---|---|---|---|---|---|---|
| 2621 Prescott Road Space 224 #224 | 0.00mi | 2/2.0 (-1) | 1,440 (+3%) | 3mo | $122,300 | $85 | 87 |
| 2621 Prescott Rd Unit 249a | 0.00mi | 2/2.0 (-1) | 1,440 (+3%) | 6mo | $100,000 | $69 | 84 |
| 2621 Prescott Rd #106 | 0.09mi | 2/2.0 (-1) | 1,344 (-4%) | 1mo | $71,500 | $53 | 84 |
| 2621 Prescott #111 | 0.09mi | 2/2.0 (-1) | 1,368 (-2%) | 6mo | $60,000 | $44 | 82 |
| 2621 Prescott Rd #262 | 0.13mi | 2/2.0 (-1) | 1,344 (-4%) | 2mo | $69,000 | $51 | 82 |
| 2621 Prescott Rd #127 | 0.09mi | 2/2.0 (-1) | 1,440 (+3%) | 6mo | $84,000 | $58 | 80 |
| 2621 Prescott Rd #87 | 0.09mi | 3/2.0 | 1,512 (+8%) | 5mo | $130,000 | $86 | 78 |
| 2621 Prescott Rd #53 | 0.07mi | 3/2.0 | 1,530 (+10%) | 4mo | $105,000 | $69 | 77 |
| 2621 Prescott Rd #151 | 0.09mi | 2/2.0 (-1) | 1,512 (+8%) | 2mo | $125,000 | $83 | 74 |
| 2621 Prescott Rd #17 | 0.07mi | 3/2.0 | 1,573 (+13%) | 2mo | $118,000 | $75 | 73 |
| 2621 Prescott Rd #187 | 0.07mi | 3/2.0 | 1,248 (-10%) | 7mo | $125,000 | $100 | 73 |
| 2129 Viking Ln | 0.38mi | 2/2.0 (-1) | 1,344 (-4%) | 2mo | $205,000 | $153 | 70 |
Match score weights: distance 35% · size 25% · config 20% · recency 20%. Top-matched comps best support the ARV.
Projected returns pro-forma
-3.0% appreciation · 2.25% rent growth · sell at horizon
- IRR
- 49.9%
- Equity multiple
- 3.16×
- Total profit
- $54,320
- Equity at exit
- $13,419
- IRR
- 55.1%
- Equity multiple
- 6.22×
- Total profit
- $131,602
- Equity at exit
- $7,782
Cash invested: $25,200 (down + closing). Projections, not guarantees.
Landlord ↔ Tenant lean methodology
- Overall (STATE)
- 18 Strongly Tenant-Friendly
- State California
- 18 Strongly Tenant-Friendly · D+13
- County
- — inherits STATE
- City
- — inherits STATE
ZIP-level market 95350
- Rents YoY
- 2.2%
- Active inventory
- 164
- Price-to-rent
- 3.4×
Monthly cashflow live
- Estimated rent
- $2,189 high interval (Pro) →
- Mortgage (P&I)
- −$472
- Tax est. 1.5%
- −$112 /mo · $1,350/yr
- Insurance
- −$38
- HOA
- −$0
- Vacancy / Maint / Mgmt
- −$460
- Net cashflow
- $1,107
Break-even live
Sensitivity live
| Price | -10% $1,169 | -5% $1,138 | +0% $1,107 | +5% $1,076 | +10% $1,045 |
|---|---|---|---|---|---|
| Rent | -10% $934 | -5% $1,021 | +0% $1,107 | +5% $1,194 | +10% $1,280 |
| Rate | -1.0pp $1,152 | -0.5pp $1,130 | base $1,107 | +0.5pp $1,084 | +1.0pp $1,060 |
UW: 25.0% down · 7.5% · 30yr · 1.5% tax · 5.0% vac · 8.0% maint · 8.0% mgmt
Financing live
Cash to close
- Down payment
- $22,500
- Closing costs
- $2,700
- Reserves months
- —
- Total cash needed
- —
Loan-product check · same deal, 3 products live
Conventional
25% down · 7.5% · 30yr
- Down + closing
- —
- Monthly P&I
- —
- Monthly cashflow
- —
- DSCR
- —
- Eligible?
- —
Personal DTI + credit; lowest rate.
DSCR
20% down · 8.5% · 30yr
- Down + closing
- —
- Monthly P&I
- —
- Monthly cashflow
- —
- DSCR
- —
- Eligible?
- —
No personal income docs; deal must DSCR.
Hard money
10% down · 12.0% · 12mo
- Down + closing
- —
- Monthly P&I
- —
- Monthly cashflow
- —
- DSCR
- —
- Eligible?
- —
Short-term bridge; refi at stabilization.
Rent comps 29 comps
| Address | Beds | Baths | Sqft | Rent | $/sqft | DOM | Units | Dist |
|---|---|---|---|---|---|---|---|---|
| 2140 Palisade Ave #4 Modesto, CA | 2.0 | 1.0 | 924 | $1,850 | $2.00 | 14d | 1 | 0.18mi |
| 2112 Eicher Ave Modesto, CA | 2.0 | 1.0 | 1100 | $1,995 | $1.81 | 14d | 1 | 0.24mi |
| 1808 W Rumble Rd Modesto, CA | 2.0 | 2.0 | 1000 | $1,800 | $1.80 | 14d | 1 | 0.43mi |
| 1712 Applegate Dr Modesto, CA | 3.0 | 2.0 | 1120 | $2,595 | $2.32 | 14d | 1 | 0.48mi |
| 2531 W Rumble Rd Unit 16 Modesto, CA | 2.0 | 2.0 | 891 | $1,795 | $2.01 | 14d | 1 | 0.57mi |
| 2531 W Rumble Rd Unit 13 Modesto, CA | 2.0 | 2.0 | 887 | $1,825 | $2.06 | 14d | 1 | 0.57mi |
| 1713 Randazzo Ave Unit 1713 Modesto, CA | 2.0 | 2.0 | 960 | $1,895 | $1.97 | 14d | 1 | 0.67mi |
| 2404 Strivens Ave Modesto, CA | 3.0 | 1.0 | 1200 | $2,498 | $2.08 | 14d | 1 | 0.68mi |
| 2821 Lou Ann Dr Modesto, CA | 2.0 | 1.5–2.0 | 1035 | $2,150 | $2.08 | 12d | 3 | 0.80mi |
| 3500 Shawnee Dr Modesto, CA | 2.0 | 2.0 | 1100 | $2,100 | $1.91 | 14d | 1 | 0.80mi |
| 3601 Prescott Rd Modesto, CA | 1.0–2.0 | 1.0–2.0 | 798 | $2,075 | $2.60 | 12d | 1 | 0.85mi |
| 1809 La Corunna Pl Modesto, CA | 2.0 | 3.0 | 1300 | $2,100 | $1.62 | 14d | 1 | 0.85mi |
| 3200 Hahn Dr Modesto, CA | 2.0–3.0 | 2.0–2.5 | 1262 | $2,631 | $2.08 | 4d | 5 | 0.88mi |
| 2900 W Rumble Rd Modesto, CA | 2.0 | 2.0 | 936 | $1,795 | $1.92 | 11d | 1 | 0.90mi |
| 2020 Cheyenne Way Modesto, CA | 1.0–2.0 | 1.0–2.0 | 783 | $1,825 | $2.33 | 4d | 2 | 0.91mi |
| 2213 Camborne Dr Unit 1 Modesto, CA | 2.0 | 2.0 | 1220 | $2,395 | $1.96 | 24d | 1 | 0.92mi |
| 2800 Braden Ave Modesto, CA | 1.0–2.0 | 1.0–2.0 | 779 | $1,960 | $2.52 | 3d | 9 | 0.97mi |
| 1701 Linwood Dr Modesto, CA | 3.0 | 2.0 | 1499 | $2,050 | $1.37 | 14d | 1 | 1.08mi |
| 3904 Breda Ct Modesto, CA | 3.0 | 2.0 | 1680 | $2,400 | $1.43 | 22d | 1 | 1.18mi |
| 3401 Tully Rd Modesto, CA | 2.0 | 2.0 | 1024 | $2,095 | $2.05 | 14d | 2 | 1.20mi |
| 3600 Dale Rd Unit 1 Modesto, CA | 2.0 | 1.5 | 935 | $2,100 | $2.25 | 4d | 1 | 1.24mi |
| 3600 Dale Rd Modesto, CA | 2.0 | 1.0 | 935 | $2,100 | $2.25 | 12d | 1 | 1.24mi |
| 1836 Brahms Way Modesto, CA | 4.0 | 2.0 | 1640 | $2,645 | $1.61 | 14d | 1 | 1.33mi |
| 1836 Brahms Way Modesto, CA | 4.0 | 2.0 | 1640 | $2,645 | $1.61 | 24d | 1 | 1.33mi |
| 2704 Snyder Ave Modesto, CA | 3.0 | 2.0 | 1806 | $2,495 | $1.38 | 12d | 1 | 1.38mi |
| 3445 Colonial Dr Modesto, CA | 1.0–2.0 | 1.0 | 918 | $2,295 | $2.50 | 14d | 10 | 1.40mi |
| 1010 Bowen Ave Modesto, CA | 2.0 | 1.0 | 940 | $1,750 | $1.86 | 14d | 1 | 1.44mi |
| 3820 Gareth Ln Apt C Modesto, CA | 2.0 | 2.0 | 1100 | $1,895 | $1.72 | 14d | 1 | 1.45mi |
| 3620 Historic Ct Modesto, CA | 3.0 | 2.0 | 1569 | $2,800 | $1.78 | 12d | 1 | 1.50mi |
Listing history 20 events
-
2026-06-21days on market $90,000 Active 157 DOM
-
2026-06-18days on market $90,000 Active 154 DOM
-
2026-06-17days on market $90,000 Active 153 DOM
-
2026-06-16days on market $90,000 Active 152 DOM
-
2026-06-15days on market $90,000 Active 151 DOM
-
2026-06-14days on market $90,000 Active 149 DOM
-
2026-06-13days on market $90,000 Active 148 DOM
-
2026-06-10days on market $90,000 Active 146 DOM
-
2026-06-09days on market $90,000 Active 145 DOM
-
2026-06-08days on market $90,000 Active 144 DOM
-
2026-06-07days on market $90,000 Active 143 DOM
-
2026-06-03days on market $90,000 Active 139 DOM
-
2026-06-03price $90,000 Active 138 DOM
-
2026-06-02days on market $95,000 Active 138 DOM
-
2026-06-01days on market $95,000 Active 137 DOM
-
2026-05-31days on market $95,000 Active 136 DOM
-
2026-05-30days on market $95,000 Active 135 DOM
-
2022-02-28soldstatus $149,000 Sold 248-char remark
Show marketing remark (248 chars)
This home is in a gated senior community (+55 and over) and is available for immediate occupancy. The home offers 3 bedrooms 2 baths with an open floor plan. Covered parking along with a Tuff shed for storage. Stop by and look, make this your home.
-
2022-02-14status Pending (Do Not Show) 248-char remark
Show marketing remark (248 chars)
This home is in a gated senior community (+55 and over) and is available for immediate occupancy. The home offers 3 bedrooms 2 baths with an open floor plan. Covered parking along with a Tuff shed for storage. Stop by and look, make this your home.
-
2022-01-12$149,000 Active 248-char remark
Show marketing remark (248 chars)
This home is in a gated senior community (+55 and over) and is available for immediate occupancy. The home offers 3 bedrooms 2 baths with an open floor plan. Covered parking along with a Tuff shed for storage. Stop by and look, make this your home.
ⓘ Source: listings_history table (triggers on properties + properties_extension) + one-shot
backfill from property_details.listing_events for pre-trigger history.
Climate risk First Street
- Flood 1/10 Low FEMA zone X (unshaded) · 0% chance over 30 yrs
- Wildfire 5/10 Major
- Heat 6/10 Major 7 d/yr ≥102°F today · 15 d/yr by 30 yrs out
- Wind 1/10 Low
- Air quality 10/10 Extreme 28 unhealthy d/yr today · 32 by 30 yrs out
Nearby sold comps map
Loading sold comps map…
Walkable amenities ~0.75 mi
Loading nearby amenities…
Taxation est. · year 1
- Rental income
- $26,264
- − Mortgage interest
- −$5,041
- − Property taxes
- −$1,350
- − Insurance
- −$450
- − Repairs & maintenance
- −$2,101
- − Management
- −$2,101
- − Depreciation
- −$2,618
- Taxable income
- $12,602
- Est. tax owed @ 24.0%
- −$3,025
- After-tax cash flow
- $10,260/yr
For passive investors: Depreciation is non-cash, so a rental often shows a tax loss while cash-flowing — sheltering income. Rental losses are passive: they offset passive income freely, and up to $25,000/yr can offset ordinary (W-2) income if you actively participate and your MAGI is under $100k (phasing out to $0 by $150k); unused losses carry forward. On sale, claimed depreciation is recaptured at up to 25%, and gains may owe capital-gains tax (a 1031 exchange can defer both). Figures are a year-1 estimate at your 24.0% rate — not tax advice; consult a CPA.
Schools (NCES district)
- District
- Stanislaus Union Elementary
- NCES district ID
- 0637950
- Math proficiency
- 24% ▼ -14.00%
- Reading proficiency
- 35% ▼ -12.00%
- Median HH income
- $53,731
- Composite
- 26.11/100
- National rank
- #7286
- State rank
- #344 of 517 in CA
Livability — Modesto
- Score
- 63/100
- State rank
- #451
- US rank
- #15229
Category grades
Schools grade is shown separately in the Schools card above.
Census & demographics
- Census place
- Modesto, CA
- County
- Stanislaus County · 445,786 people
- City population
- 225,261
- Metro
- Modesto, CA
- Population (ZIP)
- 57,136
- Household income
- $75,621
- Rent vs Own
- Severe rent burden
- 2163.0
Population outlook (Stanislaus County) Hauer SSP2
- Today (2025)
- 579,493 people
- By 2030
- 598,000 · +3.2%
- By 2040
- 630,930 · +8.9%
- By 2050
- 658,300 · +13.6%
- By 2075
- 712,363 · +22.9%
- By 2100
- 719,805 · +24.2%
Race, ethnicity, and origin ACS 2023
- Neighborhood character
- Diverse neighborhood (Simpson 0.64)
- Race & ethnicity
- White 45% Hispanic / Latino 39% Two or more races 19% Asian 6% Black 5% Native American 2%
- Hispanic origin (detail)
- Mexican 35%
- Common ancestry
- Russian 3% Slovak 2% Portuguese 1%
- Foreign-born
- 14% · Canada, Vietnam
- Languages at home
- 70% English-only · Spanish 23% Other Indo-European 3% Other Asian/Pacific 1%
Political lean MEDSL · Stanislaus
- 2024 margin
- R (+11.0) · D 43.2% · R 54.2% · Other 2.6%
- 2008→2024 swing
- -12.7pp toward R · 2008: 1.7pp · 2024: -11.0pp
- All cycles
- 2024: R+11.0 2020: D+0.8 2016: D+0.6 2012: D+0.7 2008: D+1.7
Not yet ingested
- Civics
- —
Market trends
- HPI YoY
- ▼ -555.05%
- Current HPI
- 307.9532
- Rent YoY
- ▲ 2.25%
- Metro
- Modesto, CA
- State GDP YoY
- ▲ 3.21%
- F500 in state
- 116
Industry mix (Fortune 500 HQ in CA)
| Industry | F500 HQs | Revenue |
|---|---|---|
| Technology | 27 | $1,492B |
|
||
| Financial Services | 3 | $174B |
|
||
| Retail | 3 | $44B |
|
||
| Insurance | 3 | $26B |
|
||
| Media / Entertainment | 2 | $115B |
|
||
| Pharmaceuticals / Biotech | 2 | $62B |
|
||
Price history
+0.0% since first listed3 events — show timeline
- 2022-02-28 Sold (MLS) $149,000 MLSListings
- 2022-02-14 Pending — MLSListings
- 2022-01-12 Listed $149,000 MLSListings
Cash-flow waterfall
monthlySold comps — $/sqft
last 12 mo · ≤1 miLoading sold comps…