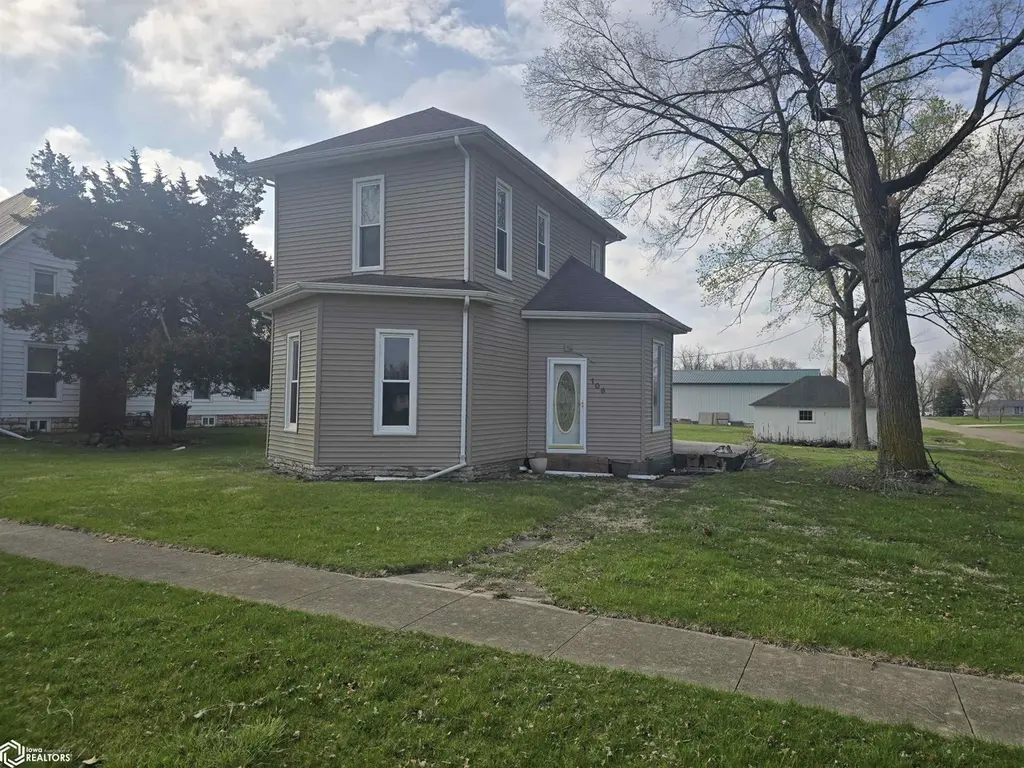
106 W Main St · Brighton, IA
Flood risk 1/10 · Minimal
- FEMA flood zone
- X (unshaded)
- Chance of flooding over 30 yrs
- 0.0%
- Est. flood insurance / yr
- $473 – $860
Fire risk 4/10 · Minor
- Est. fire insurance / yr
- $902 – $1,676
Heat risk 3/10 · Minor
- Hot days now (above 107°F)
- 7 days/yr
- Hot days in 30 yrs
- 15 days/yr
Wind risk 2/10 · Minimal
- Chance of severe wind over 30 yrs
- —
Air-quality risk 2/10 · Minimal
- Unhealthy air days now
- 1 days/yr
- Unhealthy air days in 30 yrs
- 2 days/yr
Risk factors via First Street. Map © Google.
Why this score? — see what drove the B+ grade
The composite is a weighted blend of 9 inputs, each scored 0–100. Each bar is that input's sub-score; the figure is the points it added to the 100-point composite (weight × sub-score).
- Cash flow +30.0/30.0
- 1% rule +10.0/10.0
- DSCR +10.0/10.0
- ARV discount +7.5/15.0
- Appreciation +5.0/10.0
- Schools +4.9/10.0
- Livability +3.1/5.0
- Rent growth +2.5/5.0
- Condition / age +2.5/5.0
$37,000
🖨 Deal sheet (PDF) 📄 Offer letter ✓ Due diligence
Listing remarks
This nearly 1,500-square-foot home offers plenty of space and opportunity for the right buyer. While the property requires significant repairs and updates, its generous layout provides possibilities for renovation. The spacious living room and dining area offer ample room for gathering and entertaining, while the kitchen and main-floor laundry provide a functional floor plan ready for improvement. Situated on a large corner lot, the property also offers outdoor space with potential for landscaping, gardening, or other enhancements. Whether you're an investor, flipper, or buyer looking for a renovation project, this property presents a chance to build equity and transform it into something s
Key facts
- Large corner lot
- Outdoor space
- Main-floor laundry
Tags
Property features AI
Exterior
- Parking: One-car garage with concrete surface
- Utilities: Public water; Public sewer
- Home design: Two-story single-family residence; Vinyl siding
- Construction: Vinyl siding exterior
- Exterior features: Lot approximately 0.2 acre (66 x 132)
Interior
- Bathrooms: One full bathroom
- Heating & cooling: Forced air heating; No cooling system
- Interior features: Basement present; Forced air heating; No central cooling
Neighborhood map
What this means for you Summary
Snapshot
- This is a 2-bed/1.0-bath single-family listed at $37k.
Deal economics
- At list price, monthly cash flow is $489 ($6k/yr) — positive.
- The deal already cash-flows at list — no discount required.
- Meets the 1% rule at list price ($1k rent vs $37k).
Location & tenants
- Location reads 61/100 on livability (#781 in IA) — a middle-class / working-renter tenant base. Strengths: cost of living A+, housing A+; Watch: health & safety D, schools F, amenities F.
- Washington Community School District (town): math 53% / reading 62% proficiency, ranked #254 of 289 in IA (top 88%) — acceptable for families but not a draw, mixed tenant base, ~2y average lease.
- Market conditions: 7 active listings in the ZIP; 42 units permitted in Washington County in 2024 (12 in 5+ unit buildings).
Forward outlook
- In year one you build about $1k of equity ($256 loan paydown + $1k appreciation (3.0% local appreciation)).
- Washington County population projected at +6% by 2050 — modest demand growth; plan on rents tracking national, not racing it.
- At projected returns (3.0% appreciation + 3.0% rent growth), your $10k cash investment doubles in ~2 years — after that, you're playing with house money.
Negotiation context
- Only 14 days on market — expect competitive offers; lowballing is unlikely to land.
- 3 sale attempts since 4y ago with the ask held roughly flat each time — persistent listings suggest the price (not the market) is what's stuck; bring a comps-based counter.
Risks & watch-outs
- Watch-outs: property tax is 4.7% of price; built in 1900 — expect roof / HVAC / electrical / plumbing capex.
Questions for the listing agent
- Built in 1900 — when were the roof, HVAC, electrical panel, plumbing, and water heater last replaced?
- Property tax is high relative to price — has the assessment been appealed recently, and will the sale trigger a re-assessment?
- Is there a deadline driving the sale (1031 exchange, divorce, estate, relocation)? That informs how much negotiation room exists.
- Schools are F-rated, which usually means shorter tenancies and higher turnover. Who's the typical renter profile here, and what's been the actual vacancy rate?
- What's the average days-on-market for RENTAL listings here right now (not sales)? A rising rental-DOM trend means longer vacancies and softer asking-rent achievability than the comps imply.
- What's the recent tenant-quality profile in this submarket — average credit score on applications, eviction rate, late-payment / NSF rate, and stable-employment percentage? A property-management company in the area should have these aggregated.
- How much new for-sale + rental construction is in the pipeline within 1–3 miles? Heavy new supply typically softens prices + rents 12–24 months out; constrained supply supports both.
Investment metrics
- 1% rule
- 2.88% ✓
- Cap rate
- 22.16%
- Cash-on-cash
- 56.65%
- DSCR
- 3.52
- GRM
- 2.9
CMA / ARV
- ARV (on-the-fly)
- $106,800
- Comps found
- 4
Show comp detail 4 sales within ~0.75 mi
| Address | Dist | Beds/Ba | Sqft | Sold | Price | $/sf | Match |
|---|---|---|---|---|---|---|---|
| 410 S Mechanic St | 0.25mi | 2/1.0 | 1,488 (+4%) | 3mo | $5,500 | $4 | 78 |
| 405 E Madison St | 0.29mi | 2/2.0 | 1,375 (-3%) | 16mo | $103,000 | $75 | 63 |
| 201 W Fountain St | 0.17mi | 2/1.5 | 1,216 (-15%) | 20mo | $75,000 | $62 | 49 |
| 402 S Mechanic St | 0.20mi | 3/2.5 (+1) | 1,252 (-12%) | 13mo | $230,000 | $184 | 49 |
Match score weights: distance 35% · size 25% · config 20% · recency 20%. Top-matched comps best support the ARV.
Projected returns pro-forma
3.0% appreciation · 3.0% rent growth · sell at horizon
- IRR
- 61.7%
- Equity multiple
- 4.44×
- Total profit
- $35,684
- Equity at exit
- $16,637
- IRR
- 61.3%
- Equity multiple
- 9.06×
- Total profit
- $83,485
- Equity at exit
- $25,639
Cash invested: $10,360 (down + closing). Projections, not guarantees.
Landlord ↔ Tenant lean methodology
- Overall (STATE)
- 83 Strongly Landlord-Friendly
- State Iowa
- 83 Strongly Landlord-Friendly · R+6
- County
- — inherits STATE
- City
- — inherits STATE
ZIP-level market 52540
- Active inventory
- 7
- Price-to-rent
- 2.9×
Monthly cashflow live
- Estimated rent
- $1,066 medium interval (Pro) →
- Mortgage (P&I)
- −$194
- Tax from tax record
- −$144 /mo · $1,724/yr
- Insurance
- −$15
- HOA
- −$0
- Vacancy / Maint / Mgmt
- −$224
- Net cashflow
- $489
Break-even live
Sensitivity live
| Price | -10% $612 | -5% $500 | +0% $489 | +5% $479 | +10% $468 |
|---|---|---|---|---|---|
| Rent | -10% $405 | -5% $447 | +0% $489 | +5% $531 | +10% $573 |
| Rate | -1.0pp $508 | -0.5pp $499 | base $489 | +0.5pp $480 | +1.0pp $470 |
UW: 25.0% down · 7.5% · 30yr · 1.5% tax · 5.0% vac · 8.0% maint · 8.0% mgmt
Financing live
Cash to close
- Down payment
- $9,250
- Closing costs
- $1,110
- Reserves months
- —
- Total cash needed
- —
Loan-product check · same deal, 3 products live
Conventional
25% down · 7.5% · 30yr
- Down + closing
- —
- Monthly P&I
- —
- Monthly cashflow
- —
- DSCR
- —
- Eligible?
- —
Personal DTI + credit; lowest rate.
DSCR
20% down · 8.5% · 30yr
- Down + closing
- —
- Monthly P&I
- —
- Monthly cashflow
- —
- DSCR
- —
- Eligible?
- —
No personal income docs; deal must DSCR.
Hard money
10% down · 12.0% · 12mo
- Down + closing
- —
- Monthly P&I
- —
- Monthly cashflow
- —
- DSCR
- —
- Eligible?
- —
Short-term bridge; refi at stabilization.
Listing history 11 events
-
2026-06-21days on market $37,000 Active 14 DOM
-
2026-06-18days on market $37,000 Active 12 DOM
-
2026-06-17days on market $37,000 Active 11 DOM
-
2026-06-16days on market $37,000 Active 10 DOM
-
2026-06-15days on market $37,000 Active 9 DOM
-
2026-06-13days on market $37,000 Active 7 DOM
-
2026-06-12days on market $37,000 Active 6 DOM
-
2026-06-09days on market $37,000 Active 3 DOM
-
2026-06-08days on market $37,000 Active 2 DOM
-
2026-06-07remarks 699-char remark
-
2026-06-07$37,000 Active 1 DOM
ⓘ Source: listings_history table (triggers on properties + properties_extension) + one-shot
backfill from property_details.listing_events for pre-trigger history.
Tax reassessment forecast IA · Partial reset (capped growth)
- Current annual tax
- $1,724 · $144/mo
- Projected year-2 tax
- $1,724 · $144/mo
- Expected delta
- $0/yr ($0/mo · 0.0%)
ⓘ Screening estimate from a state-policy table — verify with the county assessor before closing.
Climate risk First Street
- Flood 1/10 Low FEMA zone X (unshaded) · 0% chance over 30 yrs
- Wildfire 4/10 Moderate
- Heat 3/10 Moderate 7 d/yr ≥107°F today · 15 d/yr by 30 yrs out
- Wind 2/10 Low
- Air quality 2/10 Low 1 unhealthy d/yr today · 2 by 30 yrs out
Nearby sold comps map
Loading sold comps map…
Walkable amenities ~0.75 mi
Loading nearby amenities…
Taxation est. · year 1
- Rental income
- $12,793
- − Mortgage interest
- −$2,073
- − Property taxes
- −$1,724
- − Insurance
- −$185
- − Repairs & maintenance
- −$1,023
- − Management
- −$1,023
- − Depreciation
- −$1,076
- Taxable income
- $5,688
- Est. tax owed @ 24.0%
- −$1,365
- After-tax cash flow
- $4,504/yr
For passive investors: Depreciation is non-cash, so a rental often shows a tax loss while cash-flowing — sheltering income. Rental losses are passive: they offset passive income freely, and up to $25,000/yr can offset ordinary (W-2) income if you actively participate and your MAGI is under $100k (phasing out to $0 by $150k); unused losses carry forward. On sale, claimed depreciation is recaptured at up to 25%, and gains may owe capital-gains tax (a 1031 exchange can defer both). Figures are a year-1 estimate at your 24.0% rate — not tax advice; consult a CPA.
Schools (NCES district)
- District
- Washington Community School District
- NCES district ID
- 1930240
- Math proficiency
- 53% ▲ 2.00%
- Reading proficiency
- 62% ▲ 3.00%
- Median HH income
- $49,190
- Composite
- 48.89/100
- National rank
- #2078
- State rank
- #254 of 289 in IA
Livability — Brighton
- Score
- 61/100
- State rank
- #781
- US rank
- #17790
Category grades
Schools grade is shown separately in the Schools card above.
Census & demographics
- Census place
- Brighton, IA
- Population (ZIP)
- 1,102
Population outlook (Washington County) Hauer SSP2
- Today (2025)
- 23,102 people
- By 2030
- 23,487 · +1.7%
- By 2040
- 24,164 · +4.6%
- By 2050
- 24,595 · +6.5%
- By 2075
- 25,969 · +12.4%
- By 2100
- 24,700 · +6.9%
Race, ethnicity, and origin ACS 2023
- Neighborhood character
- Predominantly White (95%)
- Race & ethnicity
- White 95% Two or more races 4% Hispanic / Latino 2%
- Common ancestry
- Lithuanian 12% Italian 9% Romanian 1%
- Foreign-born
- 1% · Canada
- Languages at home
- 98% English-only · Spanish 2%
Political lean MEDSL · Washington
- 2024 margin
- Strong R (+24.4) · D 37.2% · R 61.6% · Other 1.2%
- 2008→2024 swing
- -23.7pp toward R · 2008: -0.7pp · 2024: -24.4pp
- All cycles
- 2024: R+24.4 2020: R+20.5 2016: R+20.6 2012: R+4.2 2008: R+0.7
Not yet ingested
- Civics
- —
Market trends
- HPI YoY
- —
- Current HPI
- —
- Rent YoY
- —
- Metro
- —
- State GDP YoY
- ▲ 2.48%
- F500 in state
- 4
Industry mix (Fortune 500 HQ in IA)
| Industry | F500 HQs | Revenue |
|---|---|---|
| Financial Services | 1 | $16B |
|
||
| Retail / Convenience | 1 | $15B |
|
||
Price history
-59.8% since first listed5 events — show timeline
- 2026-06-05 Listed $37,000 IAR
- 2025-06-22 Listed $65,000 IAR
- 2023-01-07 Price Changed $85,000 ICAARMLS
- 2022-10-05 Price Changed $87,000 ICAARMLS
- 2022-09-06 Listed $92,000 ICAARMLS
Property tax history
+6.5%/yrLatest (2025): $1,724 · +3.2% YoY. Source: county tax records.
Cash-flow waterfall
monthlySold comps — $/sqft
last 12 mo · ≤1 miLoading sold comps…