 121-Plex
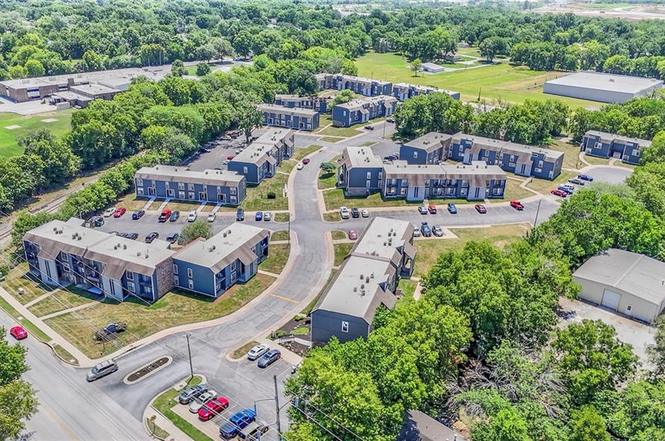
13901 Grandboro Ln · Grandview, MO
Flood risk 1/10 · Minimal
- FEMA flood zone
- X (unshaded)
- Chance of flooding over 30 yrs
- 0.0%
- Est. flood insurance / yr
- $507 – $1,088
Fire risk 3/10 · Minor
- Est. fire insurance / yr
- $1,054 – $1,958
Heat risk 4/10 · Minor
- Hot days now (above 107°F)
- 7 days/yr
- Hot days in 30 yrs
- 17 days/yr
Wind risk 2/10 · Minimal
- Chance of severe wind over 30 yrs
- —
Air-quality risk 3/10 · Minor
- Unhealthy air days now
- 3 days/yr
- Unhealthy air days in 30 yrs
- 3 days/yr
Risk factors via First Street. Map © Google.
Why this score? — see what drove the C+ grade
The composite is a weighted blend of 9 inputs, each scored 0–100. Each bar is that input's sub-score; the figure is the points it added to the 100-point composite (weight × sub-score).
- Cash flow +27.0/30.0
- DSCR +9.4/10.0
- ARV discount +7.5/15.0
- 1% rule +6.8/10.0
- Rent growth +4.0/5.0
- Livability +3.1/5.0
- Condition / age +2.5/5.0
- Schools +2.1/10.0
- Appreciation +0.0/10.0
$9,600,000
🖨 Deal sheet 📄 Offer letter ✓ Due diligence
Multi-family units
County records classify this as Multi-Family (5+ Unit). Listing-text estimate: 121 units. confirmed
5+ unit building — per-unit beds/baths from public records are typically unavailable; the breakdown below (if shown) is an estimate from the listing text.
Listing remarks
Call for offer date is August 28th at 3pm CST. Stabilized asset with assumable loan at 3.1% maturing in 2032 – eligible for supplemental with NOI increases. Douglas Place Apartments is a 121-unit garden/low-rise complex located in Grandview, Missouri. The asset is comprised of nearly 9-acres with 12 two & three-story buildings, a dedicated on-site management office, courtyard/picnic area and 274 off-street parking spaces. The value proposition of the property is strengthened by its diverse selection of spacious floor plans – with an average unit size of 920 square feet – featuring a mix of apartments (studio, 1BR, 2BR, 3BR) and townhome units (3BR & 4BR), a uni
Key facts
- Nearly 9 acres
- 8.54 acre lot
- 274 parking spots
Tags
Neighborhood map
What this means for you Summary
Snapshot
- This is a 121 × 1-bed/1.5-bath units multifamily listed at $9.60M.
Deal economics
- At list price, monthly cash flow is $27k ($324k/yr) — positive. Per door: $223/mo.
- The deal already cash-flows at list — no discount required.
- Meets the 1% rule at list price ($113k rent vs $9.60M).
- Recommended offer: $8.74M (9.0% below list) — sets the bar for market timing.
- Cap rate 9.7% vs local median 5.0% in Grandview — top-decile yield for the area; either an underpriced asset or a hidden risk that comps aren't pricing in. Stress-test before assuming the spread holds.
Location & tenants
- Location reads 61/100 on livability (#454 in MO) — a middle-class / working-renter tenant base. Strengths: cost of living A+, housing A+; Watch: schools D, employment D, crime F.
- Grandview C-4 (suburban): math 17% / reading 32% proficiency, ranked #284 of 324 in MO (top 88%) — low school quality limits family demand, transient renter base, plan for 1-2y turnover; 65% free/reduced lunch — lower-income household profile, screen leases tightly.
- Market conditions: Rents rising fast (+6.1%/yr); 116 active listings in the ZIP; 4,002 units permitted in Jackson County in 2024 (2,271 in 5+ unit buildings).
- At $112,926/mo this rent would consume 2546% of the median local household income ($53k/yr) (locally 1449% of renters already pay >50% of income on rent) — very limited rent-growth headroom before tenants either downsize or default.
Forward outlook
- Local home prices are declining (-3.0%/yr); year-one equity from $66k of loan paydown is wiped out by about $288k of value loss. Plan a longer hold.
- Jackson County population projected at +4% by 2050 — modest demand growth; plan on rents tracking national, not racing it.
- At projected returns (-3.0% appreciation + 6.1% rent growth), your $2.69M cash investment doubles in ~8 years — after that, you're playing with house money.
Negotiation context
- It's been on market 106 days — a 9% lower offer ($8.74M) is reasonable based on typical stale-listing flexibility.
Questions for the listing agent
- It's been on market 106 days. Have you received any prior offers? Is the seller open to a 9% concession, seller financing, or rate buy-down credit?
- Can we see the unit-by-unit rent roll, current vacancy, and any below-market leases? What's the average tenancy length?
- What capital expenditures (roof, boiler, parking lot, exteriors) have been made in the last 5 years, and what's planned in the next 2?
- Built in 1974 — when were the roof, HVAC, electrical panel, plumbing, and water heater last replaced?
- Why hasn't it sold? Are there any deal-killer items the seller is aware of (foundation, flood, title, zoning, code violations)?
- Is there a deadline driving the sale (1031 exchange, divorce, estate, relocation)? That informs how much negotiation room exists.
- Schools are D-rated, which usually means shorter tenancies and higher turnover. Who's the typical renter profile here, and what's been the actual vacancy rate?
- Crime grade is F in this area — have there been break-ins, vandalism, or insurance claims at this property in the last 3 years? What carrier currently insures it and at what premium?
- What's the average days-on-market for RENTAL listings here right now (not sales)? A rising rental-DOM trend means longer vacancies and softer asking-rent achievability than the comps imply.
- What's the recent tenant-quality profile in this submarket — average credit score on applications, eviction rate, late-payment / NSF rate, and stable-employment percentage? A property-management company in the area should have these aggregated.
- How much new apartment / multifamily construction is in the pipeline within 1–3 miles? Heavy new supply (>2% of stock underway) typically softens rents 12–24 months out; light construction supports rent growth.
Investment metrics
- 1% rule
- 1.18% ✓
- Cap rate
- 9.66%
- Cash-on-cash
- 12.04%
- DSCR
- 1.54
- GRM
- 7.1
CMA / ARV
No comps found within radius.
Projected returns pro-forma
-3.0% appreciation · 6.1% rent growth · sell at horizon
- IRR
- 4.9%
- Equity multiple
- 1.20×
- Total profit
- $524,296
- Equity at exit
- $1,431,391
- IRR
- 16.9%
- Equity multiple
- 2.58×
- Total profit
- $4,253,127
- Equity at exit
- $830,033
Cash invested: $2,688,000 (down + closing). Projections, not guarantees.
Landlord ↔ Tenant lean methodology
- Overall (STATE)
- 81 Strongly Landlord-Friendly
- State Missouri
- 81 Strongly Landlord-Friendly · R+10
- County
- — inherits STATE
- City
- — inherits STATE
ZIP-level market 64030
- Home prices YoY
- -30.7%
- Rents YoY
- 6.1%
- Active inventory
- 116
- Price-to-rent
- 857.2×
Monthly cashflow live
- Estimated rent
- $112,926 high interval (Pro) →
- Mortgage (P&I)
- −$50,343
- Tax from tax record
- −$7,901 /mo · $94,807/yr
- Insurance
- −$4,000
- HOA
- −$0
- Vacancy / Maint / Mgmt
- −$23,714
- Net cashflow
- $26,967
Break-even live
121-unit breakdown (identical units grouped — click to expand)
| Units | Beds | Baths | Est. rent |
|---|---|---|---|
| 121× units | 1 | 1.5 | $112,893 |
| #1 | 1 | 1.5 | $933 |
| #2 | 1 | 1.5 | $933 |
| #3 | 1 | 1.5 | $933 |
| #4 | 1 | 1.5 | $933 |
| #5 | 1 | 1.5 | $933 |
| #6 | 1 | 1.5 | $933 |
| #7 | 1 | 1.5 | $933 |
| #8 | 1 | 1.5 | $933 |
| #9 | 1 | 1.5 | $933 |
| #10 | 1 | 1.5 | $933 |
| #11 | 1 | 1.5 | $933 |
| #12 | 1 | 1.5 | $933 |
| #13 | 1 | 1.5 | $933 |
| #14 | 1 | 1.5 | $933 |
| #15 | 1 | 1.5 | $933 |
| #16 | 1 | 1.5 | $933 |
| #17 | 1 | 1.5 | $933 |
| #18 | 1 | 1.5 | $933 |
| #19 | 1 | 1.5 | $933 |
| #20 | 1 | 1.5 | $933 |
| #21 | 1 | 1.5 | $933 |
| #22 | 1 | 1.5 | $933 |
| #23 | 1 | 1.5 | $933 |
| #24 | 1 | 1.5 | $933 |
| #25 | 1 | 1.5 | $933 |
| #26 | 1 | 1.5 | $933 |
| #27 | 1 | 1.5 | $933 |
| #28 | 1 | 1.5 | $933 |
| #29 | 1 | 1.5 | $933 |
| #30 | 1 | 1.5 | $933 |
| #31 | 1 | 1.5 | $933 |
| #32 | 1 | 1.5 | $933 |
| #33 | 1 | 1.5 | $933 |
| #34 | 1 | 1.5 | $933 |
| #35 | 1 | 1.5 | $933 |
| #36 | 1 | 1.5 | $933 |
| #37 | 1 | 1.5 | $933 |
| #38 | 1 | 1.5 | $933 |
| #39 | 1 | 1.5 | $933 |
| #40 | 1 | 1.5 | $933 |
| #41 | 1 | 1.5 | $933 |
| #42 | 1 | 1.5 | $933 |
| #43 | 1 | 1.5 | $933 |
| #44 | 1 | 1.5 | $933 |
| #45 | 1 | 1.5 | $933 |
| #46 | 1 | 1.5 | $933 |
| #47 | 1 | 1.5 | $933 |
| #48 | 1 | 1.5 | $933 |
| #49 | 1 | 1.5 | $933 |
| #50 | 1 | 1.5 | $933 |
| #51 | 1 | 1.5 | $933 |
| #52 | 1 | 1.5 | $933 |
| #53 | 1 | 1.5 | $933 |
| #54 | 1 | 1.5 | $933 |
| #55 | 1 | 1.5 | $933 |
| #56 | 1 | 1.5 | $933 |
| #57 | 1 | 1.5 | $933 |
| #58 | 1 | 1.5 | $933 |
| #59 | 1 | 1.5 | $933 |
| #60 | 1 | 1.5 | $933 |
| #61 | 1 | 1.5 | $933 |
| #62 | 1 | 1.5 | $933 |
| #63 | 1 | 1.5 | $933 |
| #64 | 1 | 1.5 | $933 |
| #65 | 1 | 1.5 | $933 |
| #66 | 1 | 1.5 | $933 |
| #67 | 1 | 1.5 | $933 |
| #68 | 1 | 1.5 | $933 |
| #69 | 1 | 1.5 | $933 |
| #70 | 1 | 1.5 | $933 |
| #71 | 1 | 1.5 | $933 |
| #72 | 1 | 1.5 | $933 |
| #73 | 1 | 1.5 | $933 |
| #74 | 1 | 1.5 | $933 |
| #75 | 1 | 1.5 | $933 |
| #76 | 1 | 1.5 | $933 |
| #77 | 1 | 1.5 | $933 |
| #78 | 1 | 1.5 | $933 |
| #79 | 1 | 1.5 | $933 |
| #80 | 1 | 1.5 | $933 |
| #81 | 1 | 1.5 | $933 |
| #82 | 1 | 1.5 | $933 |
| #83 | 1 | 1.5 | $933 |
| #84 | 1 | 1.5 | $933 |
| #85 | 1 | 1.5 | $933 |
| #86 | 1 | 1.5 | $933 |
| #87 | 1 | 1.5 | $933 |
| #88 | 1 | 1.5 | $933 |
| #89 | 1 | 1.5 | $933 |
| #90 | 1 | 1.5 | $933 |
| #91 | 1 | 1.5 | $933 |
| #92 | 1 | 1.5 | $933 |
| #93 | 1 | 1.5 | $933 |
| #94 | 1 | 1.5 | $933 |
| #95 | 1 | 1.5 | $933 |
| #96 | 1 | 1.5 | $933 |
| #97 | 1 | 1.5 | $933 |
| #98 | 1 | 1.5 | $933 |
| #99 | 1 | 1.5 | $933 |
| #100 | 1 | 1.5 | $933 |
| #101 | 1 | 1.5 | $933 |
| #102 | 1 | 1.5 | $933 |
| #103 | 1 | 1.5 | $933 |
| #104 | 1 | 1.5 | $933 |
| #105 | 1 | 1.5 | $933 |
| #106 | 1 | 1.5 | $933 |
| #107 | 1 | 1.5 | $933 |
| #108 | 1 | 1.5 | $933 |
| #109 | 1 | 1.5 | $933 |
| #110 | 1 | 1.5 | $933 |
| #111 | 1 | 1.5 | $933 |
| #112 | 1 | 1.5 | $933 |
| #113 | 1 | 1.5 | $933 |
| #114 | 1 | 1.5 | $933 |
| #115 | 1 | 1.5 | $933 |
| #116 | 1 | 1.5 | $933 |
| #117 | 1 | 1.5 | $933 |
| #118 | 1 | 1.5 | $933 |
| #119 | 1 | 1.5 | $933 |
| #120 | 1 | 1.5 | $933 |
| #121 | 1 | 1.5 | $933 |
| Total (121 units) | $112,926 | ||
UW: 25.0% down · 7.5% · 30yr · 1.5% tax · 5.0% vac · 8.0% maint · 8.0% mgmt
Financing live
Cash to close
- Down payment
- $2,400,000
- Closing costs
- $288,000
- Reserves months
- —
- Total cash needed
- —
Loan-product check · same deal, 3 products live
Conventional
25% down · 7.5% · 30yr
- Down + closing
- —
- Monthly P&I
- —
- Monthly cashflow
- —
- DSCR
- —
- Eligible?
- —
Personal DTI + credit; lowest rate.
DSCR
20% down · 8.5% · 30yr
- Down + closing
- —
- Monthly P&I
- —
- Monthly cashflow
- —
- DSCR
- —
- Eligible?
- —
No personal income docs; deal must DSCR.
Hard money
10% down · 12.0% · 12mo
- Down + closing
- —
- Monthly P&I
- —
- Monthly cashflow
- —
- DSCR
- —
- Eligible?
- —
Short-term bridge; refi at stabilization.
Listing history 8 events
-
2025-11-08status Pending
-
2025-07-25$9,600,000 Active
-
2018-08-30soldstatus
-
2018-08-30soldstatus
-
2001-12-14soldstatus
-
2001-12-14soldstatus
-
2001-04-23soldstatus
-
1972-08-01soldstatus
ⓘ Source: listings_history table (triggers on properties + properties_extension) + one-shot
backfill from property_details.listing_events for pre-trigger history.
Tax reassessment forecast MO · Resets to sale price
- Current annual tax
- $94,807 · $7,901/mo
- Projected year-2 tax
- $94,807 · $7,901/mo
- Expected delta
- $0/yr ($0/mo · 0.0%)
ⓘ Screening estimate from a state-policy table — verify with the county assessor before closing.
Climate risk First Street
- Flood 1/10 Low FEMA zone X (unshaded) · 0% chance over 30 yrs
- Wildfire 3/10 Moderate
- Heat 4/10 Moderate 7 d/yr ≥107°F today · 17 d/yr by 30 yrs out
- Wind 2/10 Low
- Air quality 3/10 Moderate 3 unhealthy d/yr today · 3 by 30 yrs out
Nearby sold comps map
Loading sold comps map…
Walkable amenities ~0.75 mi
Loading nearby amenities…
Taxation est. · year 1
- Rental income
- $1,355,112
- − Mortgage interest
- −$537,749
- − Property taxes
- −$94,807
- − Insurance
- −$48,000
- − Repairs & maintenance
- −$108,409
- − Management
- −$108,409
- − Depreciation
- −$279,273
- Taxable income
- $178,465
- Est. tax owed @ 24.0%
- −$42,832
- After-tax cash flow
- $280,778/yr
For passive investors: Depreciation is non-cash, so a rental often shows a tax loss while cash-flowing — sheltering income. Rental losses are passive: they offset passive income freely, and up to $25,000/yr can offset ordinary (W-2) income if you actively participate and your MAGI is under $100k (phasing out to $0 by $150k); unused losses carry forward. On sale, claimed depreciation is recaptured at up to 25%, and gains may owe capital-gains tax (a 1031 exchange can defer both). Figures are a year-1 estimate at your 24.0% rate — not tax advice; consult a CPA.
Schools (NCES district)
- District
- Grandview C-4
- NCES district ID
- 2913140
- Math proficiency
- 17% ▼ -12.00%
- Reading proficiency
- 32% ▼ -3.00%
- Median HH income
- $48,934
- Composite
- 21.49/100
- National rank
- #8326
- State rank
- #284 of 324 in MO
Livability — Grandview
- Score
- 61/100
- State rank
- #454
- US rank
- #18350
Category grades
Schools grade is shown separately in the Schools card above.
Census & demographics
- Census place
- Grandview, MO
- County
- Jackson County · 687,798 people
- City population
- 26,422
- Metro
- Kansas City, MO-KS
- Population (ZIP)
- 26,422
- Household income
- $53,216
- Rent vs Own
- Severe rent burden
- 1449.0
Population outlook (Jackson County) Hauer SSP2
- Today (2025)
- 719,589 people
- By 2030
- 731,456 · +1.6%
- By 2040
- 746,689 · +3.8%
- By 2050
- 749,289 · +4.1%
- By 2075
- 736,227 · +2.3%
- By 2100
- 668,210 · -7.1%
Race, ethnicity, and origin ACS 2023
- Neighborhood character
- Diverse neighborhood (Simpson 0.68)
- Race & ethnicity
- White 44% Black 33% Hispanic / Latino 14% Two or more races 7% Asian 3%
- Hispanic origin (detail)
- Mexican 8%
- Common ancestry
- Lithuanian 1% Romanian 1% Slovak 1%
- Foreign-born
- 9% · Canada, South Korea
- Languages at home
- 86% English-only · Spanish 11% Korean 1% Arabic 1%
Political lean MEDSL · Jackson
- 2024 margin
- D (+19.3) · D 58.9% · R 39.5% · Other 1.6%
- 2008→2024 swing
- -6.1pp toward R · 2008: 25.4pp · 2024: 19.3pp
- All cycles
- 2024: D+19.3 2020: D+22.0 2016: D+16.6 2012: D+19.0 2008: D+25.4
Not yet ingested
- Civics
- —
Market trends
- HPI YoY
- ▼ -142.24%
- Current HPI
- 321.6905
- Rent YoY
- ▲ 6.10%
- Metro
- Kansas City, MO-KS
- State GDP YoY
- ▲ 1.84%
- F500 in state
- 20
Industry mix (Fortune 500 HQ in MO)
| Industry | F500 HQs | Revenue |
|---|---|---|
| Healthcare | 1 | $163B |
|
||
| Insurance | 1 | $21B |
|
||
| Industrial Technology | 1 | $17B |
|
||
| Retail | 1 | $16B |
|
||
| Industrial Distribution | 1 | $10B |
|
||
| Utilities | 1 | $9B |
|
||
Price history
8 events — show timeline
- 2025-11-08 Pending — Heartland MLS as Distributed by MLS Grid
- 2025-07-25 Listed $9,600,000 Heartland MLS as Distributed by MLS Grid
- 2018-08-30 Sold (Public Records) — Public Records
- 2018-08-30 Sold (Public Records) — Public Records
- 2001-12-14 Sold (Public Records) — Public Records
- 2001-12-14 Sold (Public Records) — Public Records
- 2001-04-23 Sold (Public Records) — Public Records
- 1972-08-01 Sold (Public Records) — Public Records
Property tax history
+10.8%/yrLatest (2025): $94,807 · -20.3% YoY. Source: county tax records.
Cash-flow waterfall
monthlySold comps — $/sqft
last 12 mo · ≤1 miLoading sold comps…