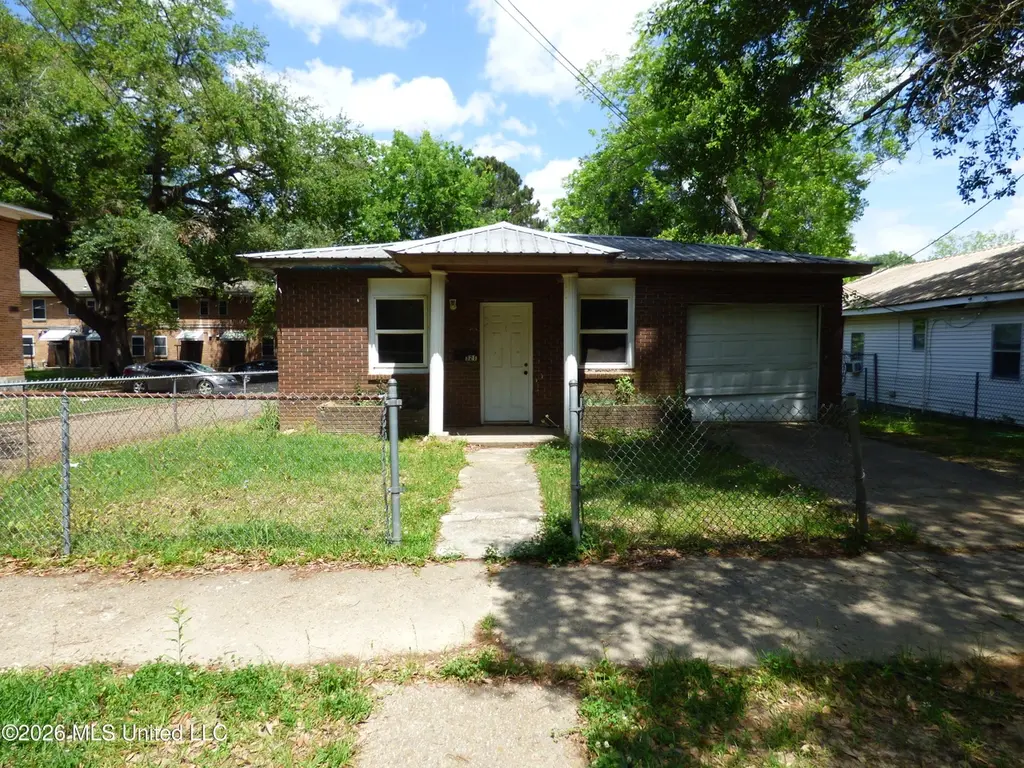
321 Saint Augustine · McComb, MS
Flood risk 1/10 · Minimal
- FEMA flood zone
- X (unshaded)
- Chance of flooding over 30 yrs
- 0.0%
- Est. flood insurance / yr
- $507 – $1,088
Fire risk 5/10 · Moderate
- Est. fire insurance / yr
- $1,241 – $2,305
Heat risk 8/10 · Major
- Hot days now (above 109°F)
- 7 days/yr
- Hot days in 30 yrs
- 20 days/yr
Wind risk 8/10 · Major
- Chance of severe wind over 30 yrs
- 99.0%
Air-quality risk 1/10 · Minimal
- Unhealthy air days now
- 0 days/yr
- Unhealthy air days in 30 yrs
- 0 days/yr
Risk factors via First Street. Map © Google.
Why this score? — see what drove the B- grade
The composite is a weighted blend of 9 inputs, each scored 0–100. Each bar is that input's sub-score; the figure is the points it added to the 100-point composite (weight × sub-score).
- Cash flow +30.0/30.0
- 1% rule +10.0/10.0
- DSCR +10.0/10.0
- ARV discount +7.5/15.0
- Livability +3.5/5.0
- Rent growth +2.5/5.0
- Condition / age +2.5/5.0
- Schools +1.2/10.0
- Appreciation +0.0/10.0
$39,900
🖨 Deal sheet 📄 Offer letter ✓ Due diligence
Listing remarks MLS
This home is a true gem for anyone looking to break into property management. Conveniently located in McComb City limits near local businesses, shopping, and restaurants, this whopping 2,228 ft home boast 4 bedrooms and 2 baths. Recently renovated, this home is now jam packed with value-enhancing updates. All windows/doors were replaced by seller during renovation and an upgraded metal roof was installed in 2014 which includes a warranty that is fully transferrable to the new owner. Owner has priced this property to sell quickly so don't wait on this deal! At $30,000, this is an investor's dream! Schedule your showing today!
Key facts
- 9,583 sq ft lot
- Garage
- Built 1954
Property features AI
Finance
- Other: Fixer condition; Building area reported as 2,228 (per assessor); Zoned: General Residence District; Lot dimensions approximately 50 x 200 (about 0.22 acre)
Exterior
- Parking: Attached garage (1 car)
- Utilities: Public water; Public sewer; Electricity available
- Home design: Single family residence (multi-family structure); One level
- Construction: Brick construction; Pillar/Post/Pier and slab foundation; Metal roof; Built year from assessor
- Exterior features: Porch; City lot; Corner lot
Interior
- Flooring: Carpet; Ceramic tile
- Bathrooms: 2 full bathrooms
- Heating & cooling: Heating present (other type); Window unit cooling
- Interior features: Carpet and ceramic tile flooring
- Laundry & utility: Washer hookup
Neighborhood map
What this means for you Summary
Snapshot
- This is a 4-bed/2.0-bath single-family listed at $40k.
Deal economics
- At list price, monthly cash flow is $805 ($10k/yr) — positive.
- The deal already cash-flows at list — no discount required.
- Meets the 1% rule at list price ($1k rent vs $40k).
- Recommended offer: $39k (3.0% below list) — sets the bar for market timing.
- Cap rate 30.5% vs local median 6.5% in McComb — top-decile yield for the area; either an underpriced asset or a hidden risk that comps aren't pricing in. Stress-test before assuming the spread holds.
Location & tenants
- Location reads 69/100 on livability (#50 in MS) — a middle-class / working-renter tenant base. Strengths: cost of living A+, health & safety A+, housing A-; Watch: schools D-, amenities F, commute F.
- Mccomb School District (town): math 15% / reading 16% proficiency, ranked #106 of 130 in MS (top 82%) — low school quality limits family demand, transient renter base, plan for 1-2y turnover; 93% free/reduced lunch — lower-income household profile, screen leases tightly.
- Market conditions: 190 active listings in the ZIP; 10 units permitted in Pike County in 2024 (0 in 5+ unit buildings).
Forward outlook
- Local home prices are declining (-3.0%/yr); year-one equity from $276 of loan paydown is wiped out by about $1k of value loss. Plan a longer hold.
- Pike County population projected at -14% by 2050 — secular population decline; favor cash flow + early exit over multi-decade hold.
- At projected returns (-3.0% appreciation + 3.0% rent growth), your $11k cash investment doubles in ~2 years — after that, you're playing with house money.
Negotiation context
- It's been on market 56 days — a 3% lower offer ($39k) is reasonable based on typical stale-listing flexibility.
- 4 sale attempts since 15y ago with the ask held roughly flat each time — persistent listings suggest the price (not the market) is what's stuck; bring a comps-based counter.
Risks & watch-outs
- Watch-outs: property tax is 3.3% of price; built in 1954 — expect roof / HVAC / electrical / plumbing capex.
- Climate carrying-cost: severe wind risk, 99% chance of damaging wind over 30y; moderate wildfire risk; extreme-heat days projected 7→20/yr by 2055 (HVAC capex compounding) — expect insurance premiums to compound above CPI over the hold.
Questions for the listing agent
- It's been on market 56 days. Have you received any prior offers? Is the seller open to a 3% concession, seller financing, or rate buy-down credit?
- Built in 1954 — when were the roof, HVAC, electrical panel, plumbing, and water heater last replaced?
- Property tax is high relative to price — has the assessment been appealed recently, and will the sale trigger a re-assessment?
- Is there a deadline driving the sale (1031 exchange, divorce, estate, relocation)? That informs how much negotiation room exists.
- Schools are D-rated, which usually means shorter tenancies and higher turnover. Who's the typical renter profile here, and what's been the actual vacancy rate?
- What's the average days-on-market for RENTAL listings here right now (not sales)? A rising rental-DOM trend means longer vacancies and softer asking-rent achievability than the comps imply.
- What's the recent tenant-quality profile in this submarket — average credit score on applications, eviction rate, late-payment / NSF rate, and stable-employment percentage? A property-management company in the area should have these aggregated.
- How much new for-sale + rental construction is in the pipeline within 1–3 miles? Heavy new supply typically softens prices + rents 12–24 months out; constrained supply supports both.
Investment metrics
- 1% rule
- 3.62% ✓
- Cap rate
- 30.52%
- Cash-on-cash
- 86.51%
- DSCR
- 4.85
- GRM
- 2.3
CMA / ARV
- ARV (median comp)
- $117,734
- List price
- $39,900
- Delta
- -66.11%
- Verdict
- UNDERPRICED
- Comps
- 20 within 1.0 mi
Show comp detail 6 sales within ~0.75 mi
| Address | Dist | Beds/Ba | Sqft | Sold | Price | $/sf | Match |
|---|---|---|---|---|---|---|---|
| 708 Dyson Dr | 0.10mi | 4/1.5 | 2,018 (-6%) | 16mo | $65,000 | $32 | 69 |
| 402 High St | 0.61mi | 4/2.0 | 2,023 (-6%) | 8mo | $169,900 | $84 | 55 |
| 507 W Georgia Ave | 0.67mi | 3/2.0 (-1) | 2,264 (+5%) | 1mo | $55,000 | $24 | 54 |
| 600 Jackson Ave | 0.57mi | 4/3.0 | 2,400 (+11%) | 6mo | $159,000 | $66 | 46 |
| 408 New York Ave W | 0.64mi | 4/2.0 | 1,850 (-14%) | 12mo | $109,500 | $59 | 37 |
| 715 N James Ave | 0.74mi | 3/2.0 (-1) | 1,918 (-11%) | 14mo | $199,000 | $104 | 30 |
Match score weights: distance 35% · size 25% · config 20% · recency 20%. Top-matched comps best support the ARV.
Projected returns pro-forma
-3.0% appreciation · 3.0% rent growth · sell at horizon
- IRR
- 87.1%
- Equity multiple
- 5.02×
- Total profit
- $44,891
- Equity at exit
- $5,949
- IRR
- 90.2%
- Equity multiple
- 10.43×
- Total profit
- $105,383
- Equity at exit
- $3,450
Cash invested: $11,172 (down + closing). Projections, not guarantees.
Landlord ↔ Tenant lean methodology
- Overall (STATE)
- 90 Strongly Landlord-Friendly
- State Mississippi
- 90 Strongly Landlord-Friendly · R+11
- County
- — inherits STATE
- City
- — inherits STATE
ZIP-level market 39648
- Active inventory
- 190
- Price-to-rent
- 2.3×
Monthly cashflow live
- Estimated rent
- $1,444 medium interval (Pro) →
- Mortgage (P&I)
- −$209
- Tax from tax record
- −$110 /mo · $1,316/yr
- Insurance
- −$17
- HOA
- −$0
- Vacancy / Maint / Mgmt
- −$303
- Net cashflow
- $805
Break-even live
UW: 25.0% down · 7.5% · 30yr · 1.5% tax · 5.0% vac · 8.0% maint · 8.0% mgmt
Financing live
Cash to close
- Down payment
- $9,975
- Closing costs
- $1,197
- Reserves months
- —
- Total cash needed
- —
Loan-product check · same deal, 3 products live
Conventional
25% down · 7.5% · 30yr
- Down + closing
- —
- Monthly P&I
- —
- Monthly cashflow
- —
- DSCR
- —
- Eligible?
- —
Personal DTI + credit; lowest rate.
DSCR
20% down · 8.5% · 30yr
- Down + closing
- —
- Monthly P&I
- —
- Monthly cashflow
- —
- DSCR
- —
- Eligible?
- —
No personal income docs; deal must DSCR.
Hard money
10% down · 12.0% · 12mo
- Down + closing
- —
- Monthly P&I
- —
- Monthly cashflow
- —
- DSCR
- —
- Eligible?
- —
Short-term bridge; refi at stabilization.
Listing history 22 events
-
2026-06-18days on market $39,900 Active 56 DOM
-
2026-06-17days on market $39,900 Active 55 DOM
-
2026-06-16days on market $39,900 Active 54 DOM
-
2026-06-15days on market $39,900 Active 53 DOM
-
2026-06-13days on market $39,900 Active 51 DOM
-
2026-06-12days on market $39,900 Active 50 DOM
-
2026-06-09days on market $39,900 Active 47 DOM
-
2026-06-08days on market $39,900 Active 46 DOM
-
2026-06-07days on market $39,900 Active 45 DOM
-
2026-06-07days on market $39,900 Active 44 DOM
-
2026-06-04days on market $39,900 Active 41 DOM
-
2026-06-02days on market $39,900 Active 40 DOM
-
2026-06-01days on market $39,900 Active 39 DOM
-
2026-05-31days on market $39,900 Active 38 DOM
-
2026-04-23$39,900 Active 309-char remark
-
2023-08-08historical
-
2023-07-28$30,000
-
2021-04-05soldstatus
-
2021-04-02soldstatus
Show marketing remark (632 chars)
This home is a true gem for anyone looking to break into property management. Conveniently located in McComb City limits near local businesses, shopping, and restaurants, this whopping 2,228 ft home boast 4 bedrooms and 2 baths. Recently renovated, this home is now jam packed with value-enhancing updates. All windows/doors were replaced by seller during renovation and an upgraded metal roof was installed in 2014 which includes a warranty that is fully transferrable to the new owner. Owner has priced this property to sell quickly so don't wait on this deal! At $30,000, this is an investor's dream! Schedule your showing today!
-
2017-06-23$30,000
Show marketing remark (632 chars)
This home is a true gem for anyone looking to break into property management. Conveniently located in McComb City limits near local businesses, shopping, and restaurants, this whopping 2,228 ft home boast 4 bedrooms and 2 baths. Recently renovated, this home is now jam packed with value-enhancing updates. All windows/doors were replaced by seller during renovation and an upgraded metal roof was installed in 2014 which includes a warranty that is fully transferrable to the new owner. Owner has priced this property to sell quickly so don't wait on this deal! At $30,000, this is an investor's dream! Schedule your showing today!
-
2012-04-20soldstatus
-
2011-07-30$7,200
ⓘ Source: listings_history table (triggers on properties + properties_extension) + one-shot
backfill from property_details.listing_events for pre-trigger history.
Tax reassessment forecast MS · Resets to sale price
- Current annual tax
- $1,316 · $110/mo
- Projected year-2 tax
- $1,316 · $110/mo
- Expected delta
- $0/yr ($0/mo · 0.0%)
ⓘ Screening estimate from a state-policy table — verify with the county assessor before closing.
Climate risk First Street
- Flood 1/10 Low FEMA zone X (unshaded) · 0% chance over 30 yrs
- Wildfire 5/10 Major
- Heat 8/10 Severe 7 d/yr ≥109°F today · 20 d/yr by 30 yrs out
- Wind 8/10 Severe 99% chance of damaging wind over 30 yrs
- Air quality 1/10 Low 0 unhealthy d/yr today · 0 by 30 yrs out
Nearby sold comps map
Loading sold comps map…
Walkable amenities ~0.75 mi
Loading nearby amenities…
Taxation est. · year 1
- Rental income
- $17,331
- − Mortgage interest
- −$2,235
- − Property taxes
- −$1,316
- − Insurance
- −$200
- − Repairs & maintenance
- −$1,386
- − Management
- −$1,386
- − Depreciation
- −$1,161
- Taxable income
- $9,647
- Est. tax owed @ 24.0%
- −$2,315
- After-tax cash flow
- $7,350/yr
For passive investors: Depreciation is non-cash, so a rental often shows a tax loss while cash-flowing — sheltering income. Rental losses are passive: they offset passive income freely, and up to $25,000/yr can offset ordinary (W-2) income if you actively participate and your MAGI is under $100k (phasing out to $0 by $150k); unused losses carry forward. On sale, claimed depreciation is recaptured at up to 25%, and gains may owe capital-gains tax (a 1031 exchange can defer both). Figures are a year-1 estimate at your 24.0% rate — not tax advice; consult a CPA.
Schools (NCES district)
- District
- Mccomb School District
- NCES district ID
- 2802880
- Math proficiency
- 15% ▼ -20.00%
- Reading proficiency
- 16% ▼ -5.00%
- Median HH income
- $29,855
- Composite
- 12.26/100
- National rank
- #9645
- State rank
- #106 of 130 in MS
Livability — McComb
- Score
- 69/100
- State rank
- #50
- US rank
- #8347
Category grades
Schools grade is shown separately in the Schools card above.
Census & demographics
- Census place
- McComb, MS
- Population (ZIP)
- 19,767
Population outlook (Pike County) Hauer SSP2
- Today (2025)
- 38,766 people
- By 2030
- 37,874 · -2.3%
- By 2040
- 35,743 · -7.8%
- By 2050
- 33,276 · -14.2%
- By 2075
- 26,799 · -30.9%
- By 2100
- 18,562 · -52.1%
Race, ethnicity, and origin ACS 2023
- Neighborhood character
- Majority Black (64%)
- Race & ethnicity
- Black 64% White 32% Two or more races 2% Hispanic / Latino 2%
- Common ancestry
- Slovak 2% Lithuanian 1% Italian 1%
- Foreign-born
- 1%
- Languages at home
- 98% English-only · Spanish 1%
Political lean MEDSL · Pike
- 2024 margin
- Toss-up / Even · D 47.8% · R 51.3%
- 2008→2024 swing
- -7.0pp toward R · 2008: 3.5pp · 2024: -3.5pp
- All cycles
- 2024: R+3.5 2020: D+1.0 2016: R+0.7 2012: D+7.6 2008: D+3.5
Not yet ingested
- Civics
- —
Market trends
- HPI YoY
- ▼ -88.61%
- Current HPI
- 92.2495
- Rent YoY
- —
- Metro
- —
- State GDP YoY
- —
- F500 in state
- 0
Price history
+454.2% since first listed8 events — show timeline
- 2026-04-23 Listed $39,900 MLSU
- 2023-08-08 Listing Removed — MLSU
- 2023-07-28 Listed $30,000 MLSU
- 2021-04-05 Sold (Public Records) — Public Records
- 2021-04-02 Sold (MLS) — MLSU
- 2017-06-23 Listed $30,000 MLSU
- 2012-04-20 Sold (MLS) — MLSU
- 2011-07-30 Listed $7,200 MLSU
Property tax history
+2.9%/yrLatest (2025): $1,316 · +17.9% YoY. Source: county tax records.
Cash-flow waterfall
monthlySold comps — $/sqft
last 12 mo · ≤1 miLoading sold comps…