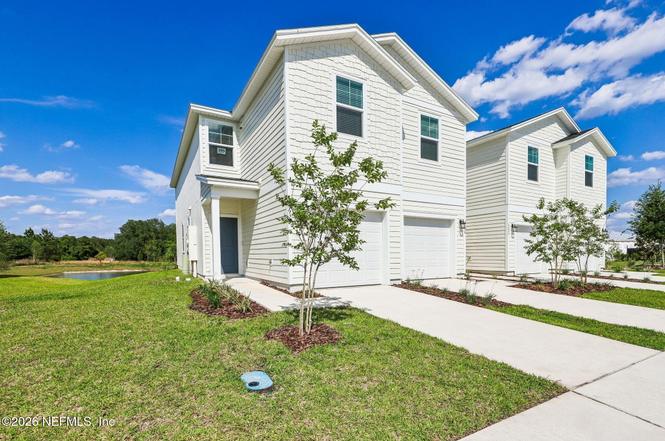
3632 Luxor Way · Oakleaf Plantation, FL
Flood risk No data
- FEMA flood zone
- —
- Chance of flooding over 30 yrs
- —
- Est. flood insurance / yr
- —
Fire risk No data
- Est. fire insurance / yr
- —
Heat risk No data
- Hot days now (above threshold)
- —
- Hot days in 30 yrs
- —
Wind risk No data
- Chance of severe wind over 30 yrs
- —
Air-quality risk No data
- Unhealthy air days now
- —
- Unhealthy air days in 30 yrs
- —
Risk factors via First Street. Map © Google.
Why this score? — see what drove the D grade
The composite is a weighted blend of 9 inputs, each scored 0–100. Each bar is that input's sub-score; the figure is the points it added to the 100-point composite (weight × sub-score).
- Cash flow +9.7/30.0
- ARV discount +9.6/15.0
- Schools +5.1/10.0
- 1% rule +3.8/10.0
- Livability +3.5/5.0
- Rent growth +3.3/5.0
- DSCR +2.7/10.0
- Condition / age +2.5/5.0
- Appreciation +0.0/10.0
$259,990
🖨 Deal sheet 📄 Offer letter ✓ Due diligence
Listing remarks
Step into a fresh take on living better--now selling new homes in the District at Oakleaf. Thoughtfully designed with modern style and everyday comfort. This home features a water view, spray foam insulation and a Clean Air Home system for energy efficiency and healthier living. The heart of the home centers around a spacious kitchen island that opens seamlessly to the main living area, perfect for gathering and entertaining. Interiors include Whirlpool stainless steel appliances, washer and dryer, blinds, quartz or granite countertops, and 42-inch upper cabinets. Stay connected with a smart home package featuring a front door camera, keyless entry, and thermostat control from your phone. E
Key facts
- Dog park
- Cabana and pool
- Open layout
Tags
Property features AI
Finance
- HOA & community: Homeowners association with monthly fee of $175; Community amenities include dog park, park, and playground
Exterior
- Parking: Attached garage with garage door opener (1 garage space)
- Utilities: Public sewer; Cable available; Electricity connected; Sewer connected; Water connected
- Home design: Townhouse (attached property); Residential use
- Construction: Fiber cement construction
- Exterior features: Fenced yard (other type); Shingle roof
Interior
- Kitchen: Disposal; Electric range; ENERGY STAR qualified dishwasher; Microwave; Refrigerator
- Bedrooms: 3 bedrooms (all on the second level)
- Flooring: Carpet; Tile
- Bathrooms: 2 full bathrooms; 1 half bathroom
- Heating & cooling: Central heating; Central air conditioning
- Interior features: Entrance foyer; Kitchen island; Open floor plan; Pantry; Primary bathroom with shower (no tub); Smart home features; Walk-in closet(s)
- Laundry & utility: Laundry located on the upper level
Neighborhood map
What this means for you Summary
Snapshot
- This is a 3-bed/2.5-bath single-family listed at $260k.
Deal economics
- At list price, monthly cash flow is $-173 ($-2k/yr) — negative.
- To cash-flow at today's rent, offer at most $235k (9.6% below list).
- To meet the 1% rule (rent ≥ 1% of price), the offer needs to be $228k (12.4% below list).
- Recommended offer: $228k (12.4% below list) — sets the bar for 1% rule.
- Cap rate 5.5% vs local median 4.0% in Oakleaf Plantation — top-decile yield for the area; either an underpriced asset or a hidden risk that comps aren't pricing in. Stress-test before assuming the spread holds.
Location & tenants
- Location reads 70/100 on livability (#446 in FL) — a middle-class / working-renter tenant base. Strengths: employment A+, housing A+, crime B+; Watch: amenities F, commute F, health & safety F.
- Clay (suburban): math 58% / reading 59% proficiency, ranked #14 of 73 in FL (top 19%) — acceptable for families but not a draw, mixed tenant base, ~2y average lease.
- Zoned schools: Tynes Elementary School (math 65% / reading 63%, grade B, #552 of 2,144 statewide, top 26%, 1,021 students, 43% FRL); Oakleaf Junior High (math 50% / reading 54%, grade C+, #217 of 571 statewide, top 40%, 1,118 students, 46% FRL); Ridgeview High School (math 41% / reading 53%, grade D-, #207 of 667 statewide, top 32%, 1,828 students, 46% FRL).
- Market conditions: Rents rising (+3.4%/yr); 601 active listings in the ZIP; 9 comparable units currently listed for rent nearby; rentals leasing fast (median 5d on market — plan ~1-2 weeks tenant-placement turnaround); solid renter incomes; 1,876 units permitted in Clay County in 2024 (14 in 5+ unit buildings).
- This rent runs 32% of the median local income ($84k/yr) — at the standard rent-burdened threshold; future hikes will face affordability resistance.
Forward outlook
- Local home prices are declining (-3.0%/yr); year-one equity from $2k of loan paydown is wiped out by about $8k of value loss. Plan a longer hold.
- Clay County population projected at +19% by 2050 — long-run rental-demand tailwind backs the buy-and-hold thesis.
Negotiation context
- It's been on market 98 days — a 9% lower offer ($237k) is reasonable based on typical stale-listing flexibility.
Questions for the listing agent
- What do current leases actually rent for vs. the listed asking? Can we see a recent rent roll and the last 12 months of T-12 income?
- It's been on market 98 days. Have you received any prior offers? Is the seller open to a 12% concession, seller financing, or rate buy-down credit?
- What does the HOA fee cover, when was the last increase, and are there any pending special assessments or reserve-fund shortfalls?
- Why hasn't it sold? Are there any deal-killer items the seller is aware of (foundation, flood, title, zoning, code violations)?
- Is there a deadline driving the sale (1031 exchange, divorce, estate, relocation)? That informs how much negotiation room exists.
- The area grade is low — what's the realistic commute time and amenity access for the typical tenant pool here? Any planned neighborhood developments (good or bad) we should know about?
- What's the average days-on-market for RENTAL listings here right now (not sales)? A rising rental-DOM trend means longer vacancies and softer asking-rent achievability than the comps imply.
- What's the recent tenant-quality profile in this submarket — average credit score on applications, eviction rate, late-payment / NSF rate, and stable-employment percentage? A property-management company in the area should have these aggregated.
- How much new for-sale + rental construction is in the pipeline within 1–3 miles? Heavy new supply typically softens prices + rents 12–24 months out; constrained supply supports both.
Investment metrics
- 1% rule
- 0.88% ✗
- Cap rate
- 5.50%
- Cash-on-cash
- -2.84%
- DSCR
- 0.87
- GRM
- 9.5
CMA / ARV
- ARV (on-the-fly)
- $272,688
- Comps found
- 10
Show comp detail 10 sales within ~0.75 mi
| Address | Dist | Beds/Ba | Sqft | Sold | Price | $/sf | Match |
|---|---|---|---|---|---|---|---|
| 3467 Lynn Ct | 0.24mi | 4/2.0 (+1) | 1,488 (+0%) | 15mo | $262,500 | $176 | 69 |
| 3305 New Beginnings Ln | 0.27mi | 3/2.0 | 1,352 (-9%) | 5mo | $240,000 | $178 | 67 |
| 3548 Grayson Ln | 0.29mi | 3/2.0 | 1,557 (+5%) | 13mo | $287,000 | $184 | 66 |
| 916 Rooster Hollow Way | 0.43mi | 3/2.0 | 1,590 (+7%) | 10mo | $348,000 | $219 | 58 |
| 762 Celebration Ln | 0.32mi | 3/2.5 | 1,637 (+10%) | 14mo | $289,000 | $177 | 56 |
| 3468 Kindlewood Dr | 0.48mi | 3/2.0 | 1,590 (+7%) | 10mo | $362,000 | $228 | 55 |
| 724 Sunny Stroll Dr | 0.42mi | 4/2.0 (+1) | 1,695 (+14%) | 1mo | $291,000 | $172 | 49 |
| 628 Sunny Stroll Dr | 0.29mi | 3/2.0 | 1,272 (-14%) | 17mo | $265,000 | $208 | 46 |
| 3396 Green Oaks Ln | 0.68mi | 3/2.0 | 1,384 (-7%) | 13mo | $230,000 | $166 | 44 |
| 3248 Roundabout Dr | 0.32mi | 3/2.0 | 1,272 (-14%) | 21mo | $268,000 | $211 | 42 |
Match score weights: distance 35% · size 25% · config 20% · recency 20%. Top-matched comps best support the ARV.
Projected returns pro-forma
-3.0% appreciation · 3.35% rent growth · sell at horizon
- IRR
- -20.5%
- Equity multiple
- 0.28×
- Total profit
- $-52,170
- Equity at exit
- $38,765
- IRR
- -12.8%
- Equity multiple
- 0.24×
- Total profit
- $-55,675
- Equity at exit
- $22,479
Cash invested: $72,797 (down + closing). Projections, not guarantees.
Landlord ↔ Tenant lean methodology
- Overall (STATE)
- 87 Strongly Landlord-Friendly
- State Florida
- 87 Strongly Landlord-Friendly · R+3
- County
- — inherits STATE
- City
- — inherits STATE
ZIP-level market 32068
- Home prices YoY
- -27.5%
- Rents YoY
- 3.4%
- Active inventory
- 601
- Price-to-rent
- 9.5×
Monthly cashflow live
- Estimated rent
- $2,277 high interval (Pro) →
- Mortgage (P&I)
- −$1,363
- Tax est. 1.5%
- −$325 /mo · $3,900/yr
- Insurance
- −$108
- HOA
- −$175
- Vacancy / Maint / Mgmt
- −$478
- Net cashflow
- $-173
Break-even live
UW: 25.0% down · 7.5% · 30yr · 1.5% tax · 5.0% vac · 8.0% maint · 8.0% mgmt
Financing live
Cash to close
- Down payment
- $64,998
- Closing costs
- $7,800
- Reserves months
- —
- Total cash needed
- —
Loan-product check · same deal, 3 products live
Conventional
25% down · 7.5% · 30yr
- Down + closing
- —
- Monthly P&I
- —
- Monthly cashflow
- —
- DSCR
- —
- Eligible?
- —
Personal DTI + credit; lowest rate.
DSCR
20% down · 8.5% · 30yr
- Down + closing
- —
- Monthly P&I
- —
- Monthly cashflow
- —
- DSCR
- —
- Eligible?
- —
No personal income docs; deal must DSCR.
Hard money
10% down · 12.0% · 12mo
- Down + closing
- —
- Monthly P&I
- —
- Monthly cashflow
- —
- DSCR
- —
- Eligible?
- —
Short-term bridge; refi at stabilization.
Rent comps 9 comps
| Address | Beds | Baths | Sqft | Rent | $/sqft | DOM | Units | Dist |
|---|---|---|---|---|---|---|---|---|
| 3608 York Ln Middleburg, FL | 3.0 | 2.5 | 1624 | $2,299 | $1.42 | 2d | 121 | 0.10mi |
| 903 Rivertree Pl Middleburg, FL | 2.0 | 2.5 | 1160 | $1,695 | $1.46 | 7d | 1 | 0.44mi |
| 728 Sunny Stroll Dr Middleburg, FL | 4.0 | 2.0 | 1860 | $2,200 | $1.18 | 24d | 1 | 0.45mi |
| 824 Integra Park Dr Middleburg, FL | 1.0–3.0 | 1.0–2.0 | 1047 | $2,258 | $2.16 | 2d | 10 | 0.71mi |
| 670 Grover Ln Orange Park, FL | 3.0 | 2.5 | 1704 | $2,100 | $1.23 | 24d | 1 | 1.23mi |
| 3938 Bloomfield Ct Middleburg, FL | 3.0 | 2.5 | 1715 | $2,275 | $1.33 | 17d | 1 | 1.25mi |
| 3750 Silver Bluff Blvd Orange Park, FL | 2.0–3.0 | 2.0–3.0 | 1862 | $1,850 | $0.99 | 2d | 2 | 1.39mi |
| 1064 Moosehead Dr Orange Park, FL | 4.0 | 2.0 | 1713 | $2,099 | $1.23 | 4d | 1 | 1.42mi |
| 3764 Athenian Way Middleburg, FL | 3.0 | 2.5 | 1433 | $1,900 | $1.33 | 3d | 1 | 1.46mi |
HOA detail
- Monthly dues
- $175 · $2,100/yr
- Likely covers
- waterpool
Listing history 5 events
-
2026-05-05status Pending
-
2026-04-22price $259,990
-
2026-04-09price $260,990
-
2026-03-04price $265,990
-
2026-01-27$267,990 Active
ⓘ Source: listings_history table (triggers on properties + properties_extension) + one-shot
backfill from property_details.listing_events for pre-trigger history.
Nearby sold comps map
Loading sold comps map…
Walkable amenities ~0.75 mi
Loading nearby amenities…
Taxation est. · year 1
- Rental income
- $27,330
- − Mortgage interest
- −$14,563
- − Property taxes
- −$3,900
- − Insurance
- −$1,300
- − Repairs & maintenance
- −$2,186
- − Management
- −$2,186
- − HOA
- −$2,100
- − Depreciation
- −$7,563
- Taxable loss
- −$6,470
- Est. tax savings @ 24.0%
- +$1,553
- After-tax cash flow
- $-517/yr
For passive investors: Depreciation is non-cash, so a rental often shows a tax loss while cash-flowing — sheltering income. Rental losses are passive: they offset passive income freely, and up to $25,000/yr can offset ordinary (W-2) income if you actively participate and your MAGI is under $100k (phasing out to $0 by $150k); unused losses carry forward. On sale, claimed depreciation is recaptured at up to 25%, and gains may owe capital-gains tax (a 1031 exchange can defer both). Figures are a year-1 estimate at your 24.0% rate — not tax advice; consult a CPA.
Schools (NCES district)
- District
- Clay
- NCES district ID
- 1200300
- Math proficiency
- 58% ▼ -8.00%
- Reading proficiency
- 59% ▼ -3.00%
- Median HH income
- $59,379
- Composite
- 50.73/100
- National rank
- #1815
- State rank
- #14 of 73 in FL
Livability — Oakleaf Plantation
- Score
- 70/100
- State rank
- #446
- US rank
- #8083
Category grades
Schools grade is shown separately in the Schools card above.
Census & demographics
- Census place
- Oakleaf Plantation, FL
- County
- Clay County · 208,450 people
- City population
- 40,366
- Metro
- Jacksonville, FL
- Population (ZIP)
- 58,983
- Household income
- $84,431
- Rent vs Own
- Severe rent burden
- 975.0
Population outlook (Clay County) Hauer SSP2
- Today (2025)
- 230,495 people
- By 2030
- 242,427 · +5.2%
- By 2040
- 262,244 · +13.8%
- By 2050
- 275,148 · +19.4%
- By 2075
- 295,397 · +28.2%
- By 2100
- 287,592 · +24.8%
Race, ethnicity, and origin ACS 2023
- Neighborhood character
- Predominantly White (74%)
- Race & ethnicity
- White 74% Hispanic / Latino 13% Two or more races 10% Black 7%
- Hispanic origin (detail)
- Mexican 2% Puerto Rican 5%
- Common ancestry
- Slovak 2% Romanian 2% Lithuanian 2%
- Foreign-born
- 7% · Canada, Jamaica
- Languages at home
- 87% English-only · Spanish 9% Arabic 1% German/W. Germanic 1%
Political lean MEDSL · Clay
- 2024 margin
- Solid R (+39.3) · D 29.9% · R 69.2%
- 2008→2024 swing
- +3.6pp toward D · 2008: -42.8pp · 2024: -39.3pp
- All cycles
- 2024: R+39.3 2020: R+37.1 2016: R+44.3 2012: R+45.8 2008: R+42.8
Not yet ingested
- Civics
- —
Market trends
- HPI YoY
- ▼ -115.99%
- Current HPI
- 305.2531
- Rent YoY
- ▲ 3.35%
- Metro
- Jacksonville, FL
- State GDP YoY
- ▲ 3.28%
- F500 in state
- 36
Industry mix (Fortune 500 HQ in FL)
| Industry | F500 HQs | Revenue |
|---|---|---|
| Industrial Technology | 2 | $29B |
|
||
| Insurance | 2 | $17B |
|
||
| Retail | 1 | $60B |
|
||
| Technology Distribution | 1 | $58B |
|
||
| Homebuilding | 1 | $35B |
|
||
| Technology Manufacturing | 1 | $35B |
|
||
Price history
-3.0% since first listed5 events — show timeline
- 2026-05-05 Pending — realMLS
- 2026-04-22 Price Changed $259,990 realMLS
- 2026-04-09 Price Changed $260,990 realMLS
- 2026-03-04 Price Changed $265,990 realMLS
- 2026-01-27 Listed $267,990 realMLS
Cash-flow waterfall
monthlySold comps — $/sqft
last 12 mo · ≤1 miLoading sold comps…