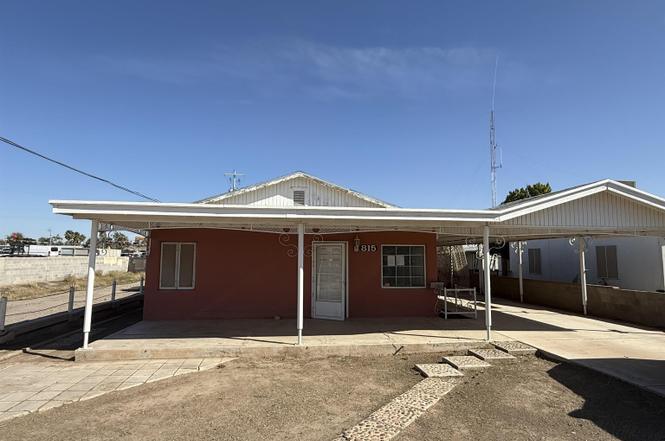
815 S 10 Ave · Yuma, AZ
Flood risk 1/10 · Minimal
- FEMA flood zone
- X (shaded)
- Chance of flooding over 30 yrs
- 0.0%
- Est. flood insurance / yr
- $507 – $1,088
Fire risk 1/10 · Minimal
- Est. fire insurance / yr
- $610 – $1,132
Heat risk 9/10 · Severe
- Hot days now (above 114°F)
- 7 days/yr
- Hot days in 30 yrs
- 20 days/yr
Wind risk 1/10 · Minimal
- Chance of severe wind over 30 yrs
- —
Air-quality risk 2/10 · Minimal
- Unhealthy air days now
- 2 days/yr
- Unhealthy air days in 30 yrs
- 2 days/yr
Risk factors via First Street. Map © Google.
Why this score? — see what drove the C+ grade
The composite is a weighted blend of 9 inputs, each scored 0–100. Each bar is that input's sub-score; the figure is the points it added to the 100-point composite (weight × sub-score).
- Cash flow +28.0/30.0
- DSCR +9.9/10.0
- ARV discount +7.5/15.0
- 1% rule +6.4/10.0
- Livability +3.6/5.0
- Rent growth +3.0/5.0
- Condition / age +2.5/5.0
- Schools +1.3/10.0
- Appreciation +0.0/10.0
$129,900
🖨 Deal sheet 📄 Offer letter ✓ Due diligence
Listing remarks
Looking for a great opportunity !! This home has lots of potential! Great-sized lot featuring a covered carport with expanded patio coverage and additional covered storage in the back. Detached possible ADU or workshop. Close to all city services. Financed offers must include: POF & Lender Pre-approval Letter. Cash offers must include POF. Corporate offers must include Corporate Resolution. All offers must be submitted by the Buyer's agent via the RES. NET Agent Portal
Key facts
- Covered carport
- Workshop
- 7,058 sq ft lot
Tags
Neighborhood map
What this means for you Summary
Snapshot
- This is a 3-bed/2.0-bath single-family listed at $130k.
Deal economics
- At list price, monthly cash flow is $405 ($5k/yr) — positive.
- The deal already cash-flows at list — no discount required.
- Meets the 1% rule at list price ($1k rent vs $130k).
- Cap rate 10.0% vs local median 3.9% in Yuma — top-decile yield for the area; either an underpriced asset or a hidden risk that comps aren't pricing in. Stress-test before assuming the spread holds.
Location & tenants
- Location reads 71/100 on livability (#30 in AZ) — a middle-class / working-renter tenant base. Strengths: cost of living A+, housing A+, health & safety A+; Watch: schools C-, crime C-, employment D.
- Yuma Union High School District (4507) (urban): math 14% / reading 16% proficiency, ranked #212 of 249 in AZ (top 85%) — low school quality limits family demand, transient renter base, plan for 1-2y turnover.
- Market conditions: Rents rising (+2.0%/yr); 262 active listings in the ZIP; 14 comparable units currently listed for rent nearby; rentals leasing fast (median 13d on market — plan ~1-2 weeks tenant-placement turnaround); 1,399 units permitted in Yuma County in 2024 (180 in 5+ unit buildings).
- This rent runs 31% of the median local income ($58k/yr) — at the standard rent-burdened threshold; future hikes will face affordability resistance.
Forward outlook
- Local home prices are declining (-3.0%/yr); year-one equity from $898 of loan paydown is wiped out by about $4k of value loss. Plan a longer hold.
- Yuma County population projected at +4% by 2050 — modest demand growth; plan on rents tracking national, not racing it.
- At projected returns (-3.0% appreciation + 2.0% rent growth), your $36k cash investment doubles in ~10 years — after that, you're playing with house money.
Negotiation context
- Only 12 days on market — expect competitive offers; lowballing is unlikely to land.
Risks & watch-outs
- Watch-outs: built in 1948 — expect roof / HVAC / electrical / plumbing capex.
- Climate carrying-cost: extreme-heat days projected 7→20/yr by 2055 (HVAC capex compounding) — expect insurance premiums to compound above CPI over the hold.
Questions for the listing agent
- Built in 1948 — when were the roof, HVAC, electrical panel, plumbing, and water heater last replaced?
- Is there a deadline driving the sale (1031 exchange, divorce, estate, relocation)? That informs how much negotiation room exists.
- What's the average days-on-market for RENTAL listings here right now (not sales)? A rising rental-DOM trend means longer vacancies and softer asking-rent achievability than the comps imply.
- What's the recent tenant-quality profile in this submarket — average credit score on applications, eviction rate, late-payment / NSF rate, and stable-employment percentage? A property-management company in the area should have these aggregated.
- How much new for-sale + rental construction is in the pipeline within 1–3 miles? Heavy new supply typically softens prices + rents 12–24 months out; constrained supply supports both.
Investment metrics
- 1% rule
- 1.14% ✓
- Cap rate
- 10.03%
- Cash-on-cash
- 13.36%
- DSCR
- 1.59
- GRM
- 7.3
CMA / ARV
- ARV (on-the-fly)
- $260,050
- Comps found
- 12
Show comp detail 12 sales within ~0.75 mi
| Address | Dist | Beds/Ba | Sqft | Sold | Price | $/sf | Match |
|---|---|---|---|---|---|---|---|
| 815 S 10 Ave | 0.00mi | 2/2.0 (-1) | 1,486 (0%) | 3mo | $137,000 | $92 | 92 |
| 932 S 9 Ave | 0.18mi | 3/2.0 | 1,557 (+5%) | 4mo | $275,000 | $177 | 80 |
| 577 S 9 Ave | 0.28mi | 4/1.5 (+1) | 1,523 (+2%) | 2mo | $168,500 | $111 | 74 |
| 584 S 6 Ave | 0.36mi | 2/1.0 (-1) | 1,519 (+2%) | 6mo | $260,000 | $171 | 66 |
| 617 S 7 Ave | 0.30mi | 4/2.0 (+1) | 1,626 (+9%) | 1mo | $345,000 | $212 | 65 |
| 500 S 7 Ave | 0.40mi | 3/2.0 | 1,642 (+10%) | 2mo | $287,500 | $175 | 62 |
| 846 S 6 Ave | 0.24mi | 3/1.0 | 1,320 (-11%) | 7mo | $85,000 | $64 | 61 |
| 1272 W 13 St | 0.62mi | 4/2.0 (+1) | 1,485 (-0%) | 7mo | $295,000 | $199 | 60 |
| 902 S 1 Ave | 0.62mi | 4/2.0 (+1) | 1,431 (-4%) | 3mo | $164,500 | $115 | 58 |
| 585 S 7 Ave | 0.34mi | 3/2.0 | 1,266 (-15%) | 7mo | $189,900 | $150 | 54 |
| 1338 S 11 Ave | 0.71mi | 3/2.0 | 1,349 (-9%) | 6mo | $240,000 | $178 | 46 |
| 739 S 20 Ave | 0.73mi | 3/2.0 | 1,292 (-13%) | 0mo | $242,500 | $188 | 44 |
Match score weights: distance 35% · size 25% · config 20% · recency 20%. Top-matched comps best support the ARV.
Projected returns pro-forma
-3.0% appreciation · 2.04% rent growth · sell at horizon
- IRR
- 2.4%
- Equity multiple
- 1.09×
- Total profit
- $3,265
- Equity at exit
- $19,369
- IRR
- 11.0%
- Equity multiple
- 1.83×
- Total profit
- $30,112
- Equity at exit
- $11,231
Cash invested: $36,372 (down + closing). Projections, not guarantees.
Landlord ↔ Tenant lean methodology
- Overall (STATE)
- 87 Strongly Landlord-Friendly
- State Arizona
- 87 Strongly Landlord-Friendly · R+3
- County
- — inherits STATE
- City
- — inherits STATE
ZIP-level market 85364
- Rents YoY
- 2.0%
- Active inventory
- 262
- Price-to-rent
- 7.3×
Monthly cashflow live
- Estimated rent
- $1,478 high interval (Pro) →
- Mortgage (P&I)
- −$681
- Tax from tax record
- −$28 /mo · $332/yr
- Insurance
- −$54
- HOA
- −$0
- Vacancy / Maint / Mgmt
- −$310
- Net cashflow
- $405
Break-even live
UW: 25.0% down · 7.5% · 30yr · 1.5% tax · 5.0% vac · 8.0% maint · 8.0% mgmt
Financing live
Cash to close
- Down payment
- $32,475
- Closing costs
- $3,897
- Reserves months
- —
- Total cash needed
- —
Loan-product check · same deal, 3 products live
Conventional
25% down · 7.5% · 30yr
- Down + closing
- —
- Monthly P&I
- —
- Monthly cashflow
- —
- DSCR
- —
- Eligible?
- —
Personal DTI + credit; lowest rate.
DSCR
20% down · 8.5% · 30yr
- Down + closing
- —
- Monthly P&I
- —
- Monthly cashflow
- —
- DSCR
- —
- Eligible?
- —
No personal income docs; deal must DSCR.
Hard money
10% down · 12.0% · 12mo
- Down + closing
- —
- Monthly P&I
- —
- Monthly cashflow
- —
- DSCR
- —
- Eligible?
- —
Short-term bridge; refi at stabilization.
Rent comps 14 comps
| Address | Beds | Baths | Sqft | Rent | $/sqft | DOM | Units | Dist |
|---|---|---|---|---|---|---|---|---|
| 1020 W 11th St Yuma, AZ | 2.0 | 1.0 | 1133 | $1,400 | $1.24 | 13d | 1 | 0.36mi |
| 750 S 15th Ave Yuma, AZ | 2.0–3.0 | 2.0 | 1050 | $1,450 | $1.38 | 13d | 2 | 0.42mi |
| 486 S 15th Ave Yuma, AZ | 3.0 | 1.0 | 875 | $995 | $1.14 | 13d | 1 | 0.53mi |
| 1600 W 12th St Yuma, AZ | 1.0–3.0 | 1.0–2.0 | 779 | $1,400 | $1.80 | 13d | 32 | 0.59mi |
| 1265 S 13th Ave Yuma, AZ | 4.0 | 2.0 | 1301 | $1,800 | $1.38 | 13d | 1 | 0.61mi |
| 179 W 12th St Unit B Yuma, AZ | 2.0 | 1.0 | 936 | $1,300 | $1.39 | 13d | 1 | 0.78mi |
| 1425 S 9th Ave Yuma, AZ | 3.0 | 2.0 | 1146 | $1,600 | $1.40 | 13d | 1 | 0.83mi |
| 1665 W 14th St Yuma, AZ | 2.0 | 2.0 | 1241 | $1,425 | $1.15 | 20d | 1 | 0.88mi |
| 314 S 21st Ave Yuma, AZ | 3.0 | 2.0 | 1172 | $1,600 | $1.37 | 13d | 1 | 0.96mi |
| 1686 W 1st St Yuma, AZ | 2.0 | 2.0 | 1128 | $1,500 | $1.33 | 13d | 1 | 0.99mi |
| 1334 S Avenue B Yuma, AZ | 1.0–2.0 | 1.5–2.0 | 888 | $1,295 | $1.46 | 13d | 24 | 1.25mi |
| 2605 W 12th Pl Yuma, AZ | 3.0 | 2.0 | 1227 | $1,495 | $1.22 | 13d | 1 | 1.27mi |
| 1928 W 17th St Yuma, AZ | 3.0 | 2.0 | 1134 | $1,750 | $1.54 | 13d | 1 | 1.33mi |
| 1955 South Avenue A Unit A Yuma, AZ | 3.0 | 1.5 | 1308 | $1,400 | $1.07 | 20d | 1 | 1.44mi |
Listing history 3 events
-
2026-03-12soldstatus $137,000
-
2026-02-19status Pending
-
2026-02-06$129,900 Active
ⓘ Source: listings_history table (triggers on properties + properties_extension) + one-shot
backfill from property_details.listing_events for pre-trigger history.
Tax reassessment forecast AZ · Resets to sale price
- Current annual tax
- $332 · $28/mo
- Projected year-2 tax
- $857 · $71/mo
- Expected delta
- +$526/yr (+$44/mo · 158.4%)
ⓘ Screening estimate from a state-policy table — verify with the county assessor before closing.
Climate risk First Street
- Flood 1/10 Low FEMA zone X (shaded) · 0% chance over 30 yrs
- Wildfire 1/10 Low
- Heat 9/10 Extreme 7 d/yr ≥114°F today · 20 d/yr by 30 yrs out
- Wind 1/10 Low
- Air quality 2/10 Low 2 unhealthy d/yr today · 2 by 30 yrs out
Nearby sold comps map
Loading sold comps map…
Walkable amenities ~0.75 mi
Loading nearby amenities…
Taxation est. · year 1
- Rental income
- $17,740
- − Mortgage interest
- −$7,276
- − Property taxes
- −$332
- − Insurance
- −$650
- − Repairs & maintenance
- −$1,419
- − Management
- −$1,419
- − Depreciation
- −$3,779
- Taxable income
- $2,865
- Est. tax owed @ 24.0%
- −$688
- After-tax cash flow
- $4,171/yr
For passive investors: Depreciation is non-cash, so a rental often shows a tax loss while cash-flowing — sheltering income. Rental losses are passive: they offset passive income freely, and up to $25,000/yr can offset ordinary (W-2) income if you actively participate and your MAGI is under $100k (phasing out to $0 by $150k); unused losses carry forward. On sale, claimed depreciation is recaptured at up to 25%, and gains may owe capital-gains tax (a 1031 exchange can defer both). Figures are a year-1 estimate at your 24.0% rate — not tax advice; consult a CPA.
Schools (NCES district)
- District
- Yuma Union High School District (4507)
- NCES district ID
- 0409630
- Math proficiency
- 14% ▼ -12.00%
- Reading proficiency
- 16% ▼ -10.00%
- Median HH income
- $40,512
- Composite
- 12.86/100
- National rank
- #9592
- State rank
- #212 of 249 in AZ
Livability — Yuma
- Score
- 71/100
- State rank
- #30
- US rank
- #6635
Category grades
Schools grade is shown separately in the Schools card above.
Census & demographics
- Census place
- Yuma, AZ
- County
- Yuma County · 149,809 people
- City population
- 149,809
- Metro
- Yuma, AZ
- Population (ZIP)
- 72,960
- Household income
- $57,874
- Rent vs Own
- Severe rent burden
- 2195.0
Population outlook (Yuma County) Hauer SSP2
- Today (2025)
- 211,633 people
- By 2030
- 214,114 · +1.2%
- By 2040
- 217,856 · +2.9%
- By 2050
- 220,276 · +4.1%
- By 2075
- 222,359 · +5.1%
- By 2100
- 198,880 · -6.0%
Race, ethnicity, and origin ACS 2023
- Neighborhood character
- Predominantly Hispanic (70%)
- Race & ethnicity
- Hispanic / Latino 70% Two or more races 29% White 24% Asian 2% Black 2% Native American 1%
- Hispanic origin (detail)
- Mexican 67%
- Common ancestry
- Portuguese 1% Lithuanian 1% Romanian 1%
- Foreign-born
- 22% · Canada
- Languages at home
- 48% English-only · Spanish 50% Tagalog/Filipino 1%
Political lean MEDSL · Yuma
- 2024 margin
- Strong R (+20.4) · D 39.3% · R 59.8%
- 2008→2024 swing
- -6.6pp toward R · 2008: -13.8pp · 2024: -20.4pp
- All cycles
- 2024: R+20.4 2020: R+6.2 2016: R+5.5 2012: R+16.1 2008: R+13.8
Not yet ingested
- Civics
- —
Market trends
- HPI YoY
- ▼ -197.00%
- Current HPI
- 220.8058
- Rent YoY
- ▲ 2.04%
- Metro
- Yuma, AZ
- State GDP YoY
- ▲ 4.54%
- F500 in state
- 20
Industry mix (Fortune 500 HQ in AZ)
| Industry | F500 HQs | Revenue |
|---|---|---|
| Technology | 2 | $13B |
|
||
| Mining / Metals | 1 | $23B |
|
||
| Environmental Services | 1 | $16B |
|
||
| Metals / Steel | 1 | $14B |
|
||
| Technology Distribution | 1 | $9B |
|
||
| Homebuilding | 1 | $8B |
|
||
Price history
+5.5% since first listed3 events — show timeline
- 2026-03-12 Sold (Public Records) $137,000 Public Records
- 2026-02-19 Pending — YAR
- 2026-02-06 Listed $129,900 YAR
Property tax history
+6.6%/yrLatest (2025): $332 · +2.0% YoY. Source: county tax records.
Cash-flow waterfall
monthlySold comps — $/sqft
last 12 mo · ≤1 miLoading sold comps…