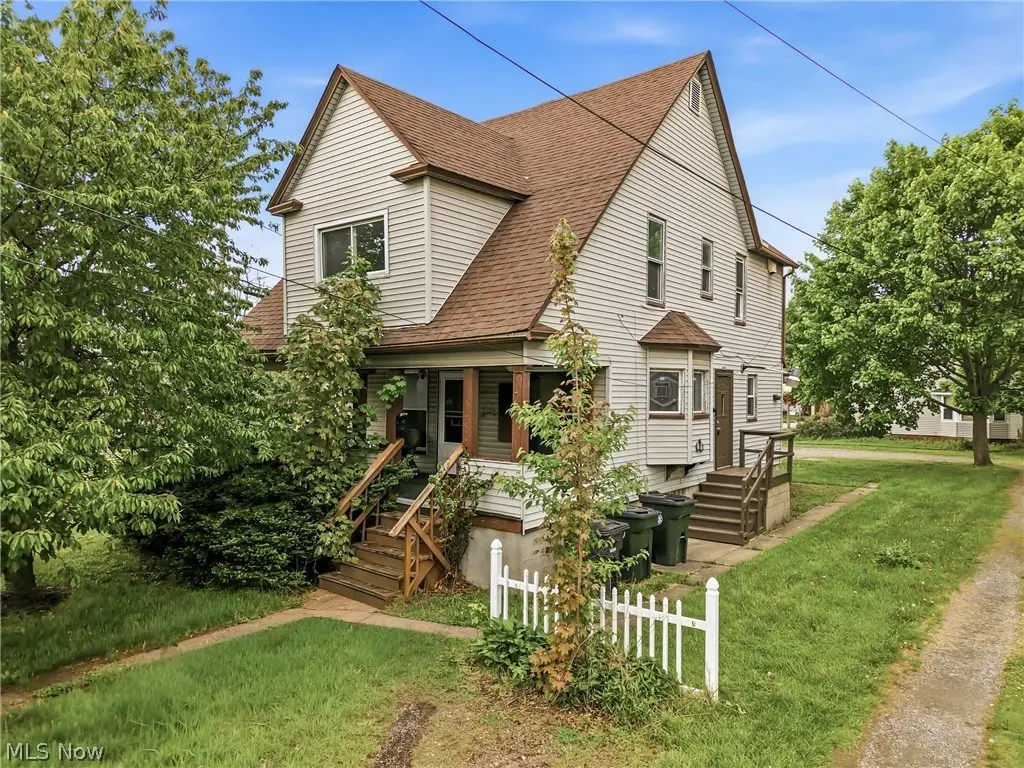
 Duplex
1103 High St NE · Warren, OH
Flood risk 1/10 · Minimal
- FEMA flood zone
- X (unshaded)
- Chance of flooding over 30 yrs
- 0.0%
- Est. flood insurance / yr
- $473 – $860
Fire risk 1/10 · Minimal
- Est. fire insurance / yr
- $713 – $1,323
Heat risk 3/10 · Minor
- Hot days now (above 97°F)
- 7 days/yr
- Hot days in 30 yrs
- 17 days/yr
Wind risk 1/10 · Minimal
- Chance of severe wind over 30 yrs
- —
Air-quality risk 3/10 · Minor
- Unhealthy air days now
- 1 days/yr
- Unhealthy air days in 30 yrs
- 4 days/yr
Risk factors via First Street. Map © Google.
Why this score? — see what drove the C+ grade
The composite is a weighted blend of 9 inputs, each scored 0–100. Each bar is that input's sub-score; the figure is the points it added to the 100-point composite (weight × sub-score).
- Cash flow +30.0/30.0
- 1% rule +10.0/10.0
- DSCR +10.0/10.0
- Livability +3.7/5.0
- Rent growth +2.5/5.0
- Condition / age +2.5/5.0
- Schools +2.2/10.0
- ARV discount +0.0/15.0
- Appreciation +0.0/10.0
$110,000
🖨 Deal sheet 📄 Offer letter ✓ Due diligence
Multi-family units
County records classify this as Multi-Family (2-4 Unit). Listing-text estimate: 2 units. confirmed
Listing remarks MLS
Calling all investors—great opportunity to add a fully rented property to your portfolio. This income-producing property features two units with a full basement that tenants can share. The first-floor unit has a long-term tenant in place, while the second-floor unit was just rented and recently updated with some brand-new flooring, fresh paint, and newer light fixtures throughout. The home also offers newer windows and a shared driveway leading to a rear parking lot with ample parking. A solid, turnkey investment with immediate rental income. Preferred to be sold as package with 1113 High St.
Key facts
- Rear parking lot
- Two units
- Full basement
Tags
Neighborhood map
What this means for you Summary
Snapshot
- This is a 2 × 2-bed/1.0-bath units multifamily listed at $110k.
Deal economics
- At list price, monthly cash flow is $786 ($9k/yr) — positive. Per door: $393/mo.
- The deal already cash-flows at list — no discount required.
- Meets the 1% rule at list price ($2k rent vs $110k).
- Recommended offer: $103k (6.0% below list) — sets the bar for market timing.
- Cap rate 14.9% vs local median 6.0% in Warren — top-decile yield for the area; either an underpriced asset or a hidden risk that comps aren't pricing in. Stress-test before assuming the spread holds.
Location & tenants
- Location reads 73/100 on livability (#312 in OH) — a middle-class / working-renter tenant base. Strengths: cost of living A+, health & safety A+, housing A; Watch: crime D-, commute F, employment F.
- Warren City (urban): math 22% / reading 32% proficiency, ranked #599 of 656 in OH (top 91%) — low school quality limits family demand, transient renter base, plan for 1-2y turnover; 75% free/reduced lunch — lower-income household profile, screen leases tightly.
- Market conditions: 107 active listings in the ZIP; 4 comparable units currently listed for rent nearby; rentals at typical pace (median 21d on market — plan ~3-4 weeks tenant-placement turnaround); 129 units permitted in Trumbull County in 2024 (0 in 5+ unit buildings).
- At $1,882/mo this rent would consume 46% of the median local household income ($49k/yr) (locally 989% of renters already pay >50% of income on rent) — very limited rent-growth headroom before tenants either downsize or default.
Forward outlook
- Local home prices are declining (-3.0%/yr); year-one equity from $761 of loan paydown is wiped out by about $3k of value loss. Plan a longer hold.
- Trumbull County population projected at -22% by 2050 — secular population decline; favor cash flow + early exit over multi-decade hold.
- At projected returns (-3.0% appreciation + 3.0% rent growth), your $31k cash investment doubles in ~4 years — after that, you're playing with house money.
Negotiation context
- It's been on market 61 days — a 6% lower offer ($103k) is reasonable based on typical stale-listing flexibility.
- 4 sale attempts since 3y ago with the ask held roughly flat each time — persistent listings suggest the price (not the market) is what's stuck; bring a comps-based counter.
- Current owner paid $62k; list at $110k implies a 76% gain — meaningful room to come down on a strong offer.
Risks & watch-outs
- Watch-outs: built in 1920 — expect roof / HVAC / electrical / plumbing capex.
Questions for the listing agent
- It's been on market 61 days. Have you received any prior offers? Is the seller open to a 6% concession, seller financing, or rate buy-down credit?
- Can we see the unit-by-unit rent roll, current vacancy, and any below-market leases? What's the average tenancy length?
- What capital expenditures (roof, boiler, parking lot, exteriors) have been made in the last 5 years, and what's planned in the next 2?
- Built in 1920 — when were the roof, HVAC, electrical panel, plumbing, and water heater last replaced?
- Why hasn't it sold? Are there any deal-killer items the seller is aware of (foundation, flood, title, zoning, code violations)?
- Is there a deadline driving the sale (1031 exchange, divorce, estate, relocation)? That informs how much negotiation room exists.
- Crime grade is D in this area — have there been break-ins, vandalism, or insurance claims at this property in the last 3 years? What carrier currently insures it and at what premium?
- What's the average days-on-market for RENTAL listings here right now (not sales)? A rising rental-DOM trend means longer vacancies and softer asking-rent achievability than the comps imply.
- What's the recent tenant-quality profile in this submarket — average credit score on applications, eviction rate, late-payment / NSF rate, and stable-employment percentage? A property-management company in the area should have these aggregated.
- How much new apartment / multifamily construction is in the pipeline within 1–3 miles? Heavy new supply (>2% of stock underway) typically softens rents 12–24 months out; light construction supports rent growth.
Investment metrics
- 1% rule
- 1.71% ✓
- Cap rate
- 14.87%
- Cash-on-cash
- 30.62%
- DSCR
- 2.36
- GRM
- 4.9
CMA / ARV
- ARV (median comp)
- $87,033
- List price
- $110,000
- Delta
- 26.39%
- Verdict
- OVERPRICED
- Comps
- 10 within 1.0 mi
Show comp detail 2 sales within ~0.75 mi
| Address | Dist | Beds/Ba | Sqft | Sold | Price | $/sf | Match |
|---|---|---|---|---|---|---|---|
| 524 Washington St NW | 0.46mi | 4/2.5 (+1) | 1,692 (+6%) | 9mo | $35,000 | $21 | 53 |
| 426 Laird Ave SE | 0.42mi | 2/2.0 (-1) | 1,446 (-9%) | 21mo | $65,000 | $45 | 43 |
Match score weights: distance 35% · size 25% · config 20% · recency 20%. Top-matched comps best support the ARV.
Projected returns pro-forma
-3.0% appreciation · 3.0% rent growth · sell at horizon
- IRR
- 25.3%
- Equity multiple
- 2.05×
- Total profit
- $32,217
- Equity at exit
- $16,401
- IRR
- 33.0%
- Equity multiple
- 4.00×
- Total profit
- $92,468
- Equity at exit
- $9,511
Cash invested: $30,800 (down + closing). Projections, not guarantees.
Landlord ↔ Tenant lean methodology
- Overall (STATE)
- 73 Landlord-Friendly
- State Ohio
- 73 Landlord-Friendly · R+6
- County
- — inherits STATE
- City
- — inherits STATE
ZIP-level market 44483
- Home prices YoY
- -16.3%
- Active inventory
- 107
- Price-to-rent
- 9.7×
Monthly cashflow live
- Estimated rent
- $1,882 medium interval (Pro) →
- Mortgage (P&I)
- −$577
- Tax from tax record
- −$78 /mo · $939/yr
- Insurance
- −$46
- HOA
- −$0
- Vacancy / Maint / Mgmt
- −$395
- Net cashflow
- $786
Break-even live
2-unit breakdown (identical units grouped — click to expand)
| Units | Beds | Baths | Est. rent |
|---|---|---|---|
| 2× units | 2 | 1 | $1,882 |
| #1 | 2 | 1 | $941 |
| #2 | 2 | 1 | $941 |
| Total (2 units) | $1,882 | ||
UW: 25.0% down · 7.5% · 30yr · 1.5% tax · 5.0% vac · 8.0% maint · 8.0% mgmt
Financing live
Cash to close
- Down payment
- $27,500
- Closing costs
- $3,300
- Reserves months
- —
- Total cash needed
- —
Loan-product check · same deal, 3 products live
Conventional
25% down · 7.5% · 30yr
- Down + closing
- —
- Monthly P&I
- —
- Monthly cashflow
- —
- DSCR
- —
- Eligible?
- —
Personal DTI + credit; lowest rate.
DSCR
20% down · 8.5% · 30yr
- Down + closing
- —
- Monthly P&I
- —
- Monthly cashflow
- —
- DSCR
- —
- Eligible?
- —
No personal income docs; deal must DSCR.
Hard money
10% down · 12.0% · 12mo
- Down + closing
- —
- Monthly P&I
- —
- Monthly cashflow
- —
- DSCR
- —
- Eligible?
- —
Short-term bridge; refi at stabilization.
Rent comps 4 comps
| Address | Beds | Baths | Sqft | Rent | $/sqft | DOM | Units | Dist |
|---|---|---|---|---|---|---|---|---|
| 341 Charles AVE Warren, OH | 3.0 | 1.0 | 1232 | $1,100 | $0.89 | 43d | 1 | 0.30mi |
| 407 Washington St NE Niles, OH | 3.0 | 1.5 | 1388 | $1,250 | $0.90 | 13d | 1 | 0.58mi |
| 1216 Hollywood St NE Warren, OH | 3.0 | 1.0 | 1158 | $1,050 | $0.91 | 21d | 1 | 0.65mi |
| 1151 Kenilworth Ave SE Warren, OH | 2.0 | 1.0 | 1207 | $900 | $0.75 | 13d | 1 | 0.90mi |
Listing history 28 events
-
2026-06-19days on market $110,000 Active 61 DOM
-
2026-06-18days on market $110,000 Active 60 DOM
-
2026-06-17days on market $110,000 Active 59 DOM
-
2026-06-16days on market $110,000 Active 58 DOM
-
2026-06-15price $110,000 Active 57 DOM
-
2026-06-15days on market $115,000 Active 57 DOM
-
2026-06-14days on market $115,000 Active 55 DOM
-
2026-06-13days on market $115,000 Active 54 DOM
-
2026-06-10days on market $115,000 Active 52 DOM
-
2026-06-09days on market $115,000 Active 51 DOM
-
2026-06-08days on market $115,000 Active 50 DOM
-
2026-06-07days on market $115,000 Active 49 DOM
-
2026-06-05days on market $115,000 Active 46 DOM
-
2026-06-02days on market $115,000 Active 44 DOM
-
2026-06-01days on market $115,000 Active 43 DOM
-
2026-05-31days on market $115,000 Active 42 DOM
-
2026-05-30days on market $115,000 Active 41 DOM
-
2026-04-19$115,000 Active 605-char remark
Show marketing remark (605 chars)
Calling all investors—great opportunity to add a fully rented property to your portfolio. This income-producing property features two units with a full basement that tenants can share. The first-floor unit has a long-term tenant in place, while the second-floor unit was just rented and recently updated with some brand-new flooring, fresh paint, and newer light fixtures throughout. The home also offers newer windows and a shared driveway leading to a rear parking lot with ample parking. A solid, turnkey investment with immediate rental income. Preferred to be sold as package with 1113 High St.
-
2024-05-13historical $700
-
2024-04-12$700
-
2023-10-10soldstatus $62,500
-
2023-10-06soldstatus $62,500 Closed 299-char remark
Show marketing remark (299 chars)
Well maintained 2 Story duplex. 2 bedrooms 1 bath each unit. 1st. floor 808 Sqft. 2nd 780 Sqft. Each unit has laundry hookup. Seller pays gas. Each unit has separate electric meters and water meters for 1103. City Permit current. Sold as package with 1113 High St. for 150,000. 100% tenant occupied.
-
2023-09-28status Pending 299-char remark
Show marketing remark (299 chars)
Well maintained 2 Story duplex. 2 bedrooms 1 bath each unit. 1st. floor 808 Sqft. 2nd 780 Sqft. Each unit has laundry hookup. Seller pays gas. Each unit has separate electric meters and water meters for 1103. City Permit current. Sold as package with 1113 High St. for 150,000. 100% tenant occupied.
-
2023-09-11historical Contingent 299-char remark
Show marketing remark (299 chars)
Well maintained 2 Story duplex. 2 bedrooms 1 bath each unit. 1st. floor 808 Sqft. 2nd 780 Sqft. Each unit has laundry hookup. Seller pays gas. Each unit has separate electric meters and water meters for 1103. City Permit current. Sold as package with 1113 High St. for 150,000. 100% tenant occupied.
-
2023-08-14status Active 299-char remark
Show marketing remark (299 chars)
Well maintained 2 Story duplex. 2 bedrooms 1 bath each unit. 1st. floor 808 Sqft. 2nd 780 Sqft. Each unit has laundry hookup. Seller pays gas. Each unit has separate electric meters and water meters for 1103. City Permit current. Sold as package with 1113 High St. for 150,000. 100% tenant occupied.
-
2023-07-31status Pending 299-char remark
Show marketing remark (299 chars)
Well maintained 2 Story duplex. 2 bedrooms 1 bath each unit. 1st. floor 808 Sqft. 2nd 780 Sqft. Each unit has laundry hookup. Seller pays gas. Each unit has separate electric meters and water meters for 1103. City Permit current. Sold as package with 1113 High St. for 150,000. 100% tenant occupied.
-
2023-06-01$75,000 Active 299-char remark
Show marketing remark (299 chars)
Well maintained 2 Story duplex. 2 bedrooms 1 bath each unit. 1st. floor 808 Sqft. 2nd 780 Sqft. Each unit has laundry hookup. Seller pays gas. Each unit has separate electric meters and water meters for 1103. City Permit current. Sold as package with 1113 High St. for 150,000. 100% tenant occupied.
-
2016-03-29soldstatus $55,000
ⓘ Source: listings_history table (triggers on properties + properties_extension) + one-shot
backfill from property_details.listing_events for pre-trigger history.
Tax reassessment forecast OH · Partial reset (capped growth)
- Current annual tax
- $939 · $78/mo
- Projected year-2 tax
- $1,328 · $111/mo
- Expected delta
- +$388/yr (+$32/mo · 41.3%)
ⓘ Screening estimate from a state-policy table — verify with the county assessor before closing.
Climate risk First Street
- Flood 1/10 Low FEMA zone X (unshaded) · 0% chance over 30 yrs
- Wildfire 1/10 Low
- Heat 3/10 Moderate 7 d/yr ≥97°F today · 17 d/yr by 30 yrs out
- Wind 1/10 Low
- Air quality 3/10 Moderate 1 unhealthy d/yr today · 4 by 30 yrs out
Nearby sold comps map
Loading sold comps map…
Walkable amenities ~0.75 mi
Loading nearby amenities…
Taxation est. · year 1
- Rental income
- $22,584
- − Mortgage interest
- −$6,162
- − Property taxes
- −$939
- − Insurance
- −$550
- − Repairs & maintenance
- −$1,807
- − Management
- −$1,807
- − Depreciation
- −$3,200
- Taxable income
- $8,120
- Est. tax owed @ 24.0%
- −$1,949
- After-tax cash flow
- $7,481/yr
For passive investors: Depreciation is non-cash, so a rental often shows a tax loss while cash-flowing — sheltering income. Rental losses are passive: they offset passive income freely, and up to $25,000/yr can offset ordinary (W-2) income if you actively participate and your MAGI is under $100k (phasing out to $0 by $150k); unused losses carry forward. On sale, claimed depreciation is recaptured at up to 25%, and gains may owe capital-gains tax (a 1031 exchange can defer both). Figures are a year-1 estimate at your 24.0% rate — not tax advice; consult a CPA.
Schools (NCES district)
- District
- Warren City
- NCES district ID
- 3904499
- Math proficiency
- 22% ▼ -16.00%
- Reading proficiency
- 32% ▼ -9.00%
- Median HH income
- $28,222
- Composite
- 21.6/100
- National rank
- #8299
- State rank
- #599 of 656 in OH
Livability — Warren
- Score
- 73/100
- State rank
- #312
- US rank
- #5068
Category grades
Schools grade is shown separately in the Schools card above.
Census & demographics
- Census place
- Warren, OH
- County
- Trumbull County · 61,158 people
- City population
- 25,805
- Metro
- Youngstown-Warren-Boardman, OH-PA
- Population (ZIP)
- 25,805
- Household income
- $49,017
- Rent vs Own
- Severe rent burden
- 989.0
Population outlook (Trumbull County) Hauer SSP2
- Today (2025)
- 191,696 people
- By 2030
- 184,015 · -4.0%
- By 2040
- 166,810 · -13.0%
- By 2050
- 149,857 · -21.8%
- By 2075
- 115,769 · -39.6%
- By 2100
- 83,617 · -56.4%
Race, ethnicity, and origin ACS 2023
- Neighborhood character
- Predominantly White (77%)
- Race & ethnicity
- White 77% Black 14% Two or more races 7% Hispanic / Latino 4%
- Common ancestry
- Romanian 3% Slovak 2% Italian 1%
- Foreign-born
- 2% · Canada
- Languages at home
- 96% English-only · Other Indo-European 2% Spanish 2%
Political lean MEDSL · Trumbull
- 2024 margin
- R (+16.8) · D 41.2% · R 58.0%
- 2008→2024 swing
- -39.2pp toward R · 2008: 22.4pp · 2024: -16.8pp
- All cycles
- 2024: R+16.8 2020: R+10.6 2016: R+6.4 2012: D+22.2 2008: D+22.4
Not yet ingested
- Civics
- —
Market trends
- HPI YoY
- ▼ -42.50%
- Current HPI
- 218.3455
- Rent YoY
- —
- Metro
- Youngstown-Warren-Boardman, OH-PA
- State GDP YoY
- ▲ 1.98%
- F500 in state
- 48
Industry mix (Fortune 500 HQ in OH)
| Industry | F500 HQs | Revenue |
|---|---|---|
| Insurance | 3 | $145B |
|
||
| Industrial Machinery | 3 | $49B |
|
||
| Financial Services | 3 | $24B |
|
||
| Consumer Goods | 2 | $93B |
|
||
| Aerospace / Defense | 2 | $47B |
|
||
| Utilities | 2 | $33B |
|
||
Price history
+109.1% since first listed11 events — show timeline
- 2026-04-19 Listed $115,000 MLSNOW
- 2024-05-13 Rental Removed $700 YESMLS
- 2024-04-12 Listed for Rent $700 YESMLS
- 2023-10-10 Sold (Public Records) $62,500 Public Records
- 2023-10-06 Sold (MLS) $62,500 MLSNOW
- 2023-09-28 Pending — MLSNOW
- 2023-09-11 Contingent — MLSNOW
- 2023-08-14 Relisted — MLSNOW
- 2023-07-31 Pending — MLSNOW
- 2023-06-01 Listed $75,000 MLSNOW
- 2016-03-29 Sold (Public Records) $55,000 Public Records
Property tax history
+6.0%/yrLatest (2025): $939 · +1.9% YoY. Source: county tax records.
Cash-flow waterfall
monthlySold comps — $/sqft
last 12 mo · ≤1 miLoading sold comps…