803 Ripley St · Ennis, TX
Flood risk 1/10 · Minimal
- FEMA flood zone
- X (unshaded)
- Chance of flooding over 30 yrs
- 0.0%
- Est. flood insurance / yr
- $507 – $1,088
Fire risk 4/10 · Minor
- Est. fire insurance / yr
- $1,222 – $2,270
Heat risk 7/10 · Major
- Hot days now (above 109°F)
- 7 days/yr
- Hot days in 30 yrs
- 25 days/yr
Wind risk 6/10 · Moderate
- Chance of severe wind over 30 yrs
- 39.0%
Air-quality risk 2/10 · Minimal
- Unhealthy air days now
- 0 days/yr
- Unhealthy air days in 30 yrs
- 1 days/yr
Risk factors via First Street. Map © Google.
Why this score? — see what drove the C grade
The composite is a weighted blend of 9 inputs, each scored 0–100. Each bar is that input's sub-score; the figure is the points it added to the 100-point composite (weight × sub-score).
- Cash flow +18.6/30.0
- ARV discount +15.0/15.0
- 1% rule +6.3/10.0
- DSCR +5.8/10.0
- Livability +3.6/5.0
- Schools +3.4/10.0
- Rent growth +3.2/5.0
- Condition / age +2.5/5.0
- Appreciation +0.0/10.0
$152,900
🖨 Deal sheet 📄 Offer letter ✓ Due diligence
Listing remarks
Charming fixer-upper located on a quiet street in the small town of Ennis, Texas—home of the famous Ennis Bluebonnet Trails Festival, local shops, dining, and small-town charm. This 3-bedroom, 2 full bath home offers great potential for an investor or first-time homebuyer not afraid of a little work and ready to make it their own. Conveniently located close to schools, shopping, and everyday amenities while still enjoying a peaceful neighborhood setting. Less than an hour from Dallas and Fort Worth, making for an easy commute or weekend getaway from the city. With a little vision and TLC, this property could truly shine. Buyer and buyer’s agent to verify all information.
Key facts
- Quiet street
- Close to schools
- Easy commute
Tags
Property features AI
Exterior
- Parking: Attached garage; 2 covered parking spaces (garage)
- Security: Security system
- Utilities: Electricity available and connected; Public water available and connected; Public sewer connected
- Home design: Single-story home; Faces east; Resale property
- Construction: Cement siding; Composition roof; Block foundation; Built per public records
- Exterior features: Private yard; Covered front porch; Many trees; Back yard privacy fencing
Interior
- Kitchen: Dishwasher; Granite counters; Eat-in kitchen; Breakfast bar; Pantry
- Bedrooms: 3 main-level bedrooms; Main level primary
- Flooring: Carpet; Tile; Vinyl
- Bathrooms: 1 full bathroom
- Heating & cooling: Central heating (electric); Central air (electric)
- Interior features: Breakfast bar; Ceiling fan(s); Eat-in kitchen; Granite counters; Pantry; Storage; Soaking tub; Natural woodwork; Storm windows
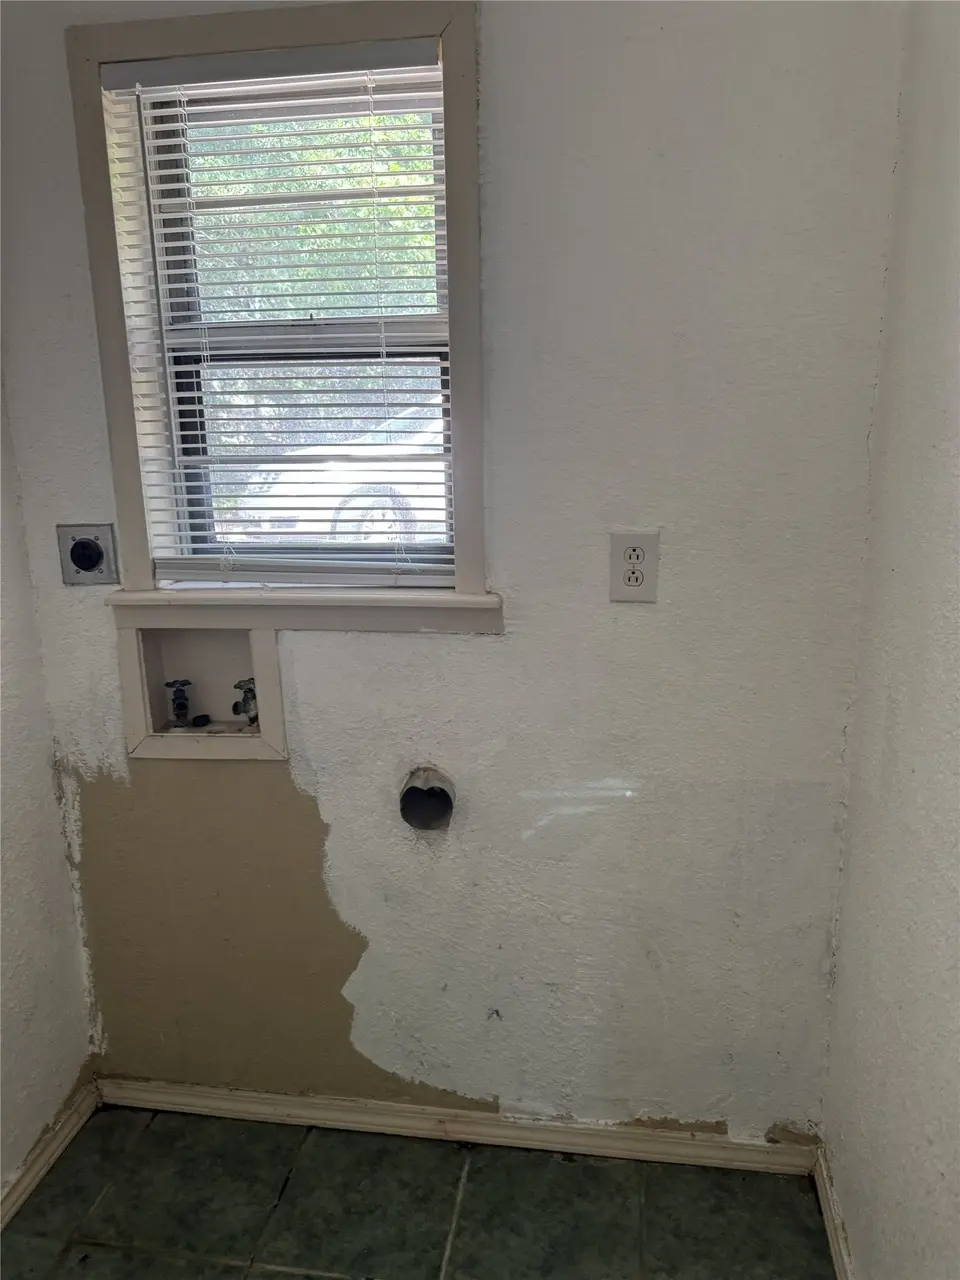
- Laundry & utility: Laundry closet and laundry room on main level; Washer hookup; Electric dryer hookup
Neighborhood map
What this means for you Summary
Snapshot
- This is a 3-bed/2.0-bath single-family listed at $153k.
Deal economics
- At list price, monthly cash flow is $148 ($2k/yr) — positive.
- The deal already cash-flows at list — no discount required.
- Meets the 1% rule at list price ($2k rent vs $153k).
- Recommended offer: $151k (1.5% below list) — sets the bar for market timing.
- Cap rate 7.5% vs local median 4.5% in Ennis — top-decile yield for the area; either an underpriced asset or a hidden risk that comps aren't pricing in. Stress-test before assuming the spread holds.
Location & tenants
- Location reads 71/100 on livability (#304 in TX) — a middle-class / working-renter tenant base. Strengths: cost of living A+, housing A+, crime B+; Watch: schools D-, amenities F, commute F.
- Ennis ISD (rural): math 41% / reading 39% proficiency, ranked #411 of 826 in TX (top 50%) — families likely to look elsewhere, expect single-tenant / working-renter base with shorter leases; 60% free/reduced lunch — lower-income household profile, screen leases tightly.
- Market conditions: Rents rising (+3.0%/yr); 363 active listings in the ZIP; 20 comparable units currently listed for rent nearby; rentals at typical pace (median 22d on market — plan ~3-4 weeks tenant-placement turnaround); 40% of comp listings sitting > 30 days — soft ceiling on asking rent; solid renter incomes; 3,016 units permitted in Ellis County in 2024 (20 in 5+ unit buildings).
Forward outlook
- Local home prices are declining (-3.0%/yr); year-one equity from $1k of loan paydown is wiped out by about $5k of value loss. Plan a longer hold.
- Ellis County population projected at +36% by 2050 — long-run rental-demand tailwind backs the buy-and-hold thesis.
Negotiation context
- It's been on market 28 days — a 2% lower offer ($151k) is reasonable based on typical stale-listing flexibility.
- 8 sale attempts since 10y ago with the ask held roughly flat each time — persistent listings suggest the price (not the market) is what's stuck; bring a comps-based counter.
Risks & watch-outs
- Watch-outs: property tax is 2.8% of price.
- Climate carrying-cost: major wind risk, 39% chance of damaging wind over 30y; extreme-heat days projected 7→25/yr by 2055 (HVAC capex compounding) — expect insurance premiums to compound above CPI over the hold.
Questions for the listing agent
- Built in 1969 — when were the roof, HVAC, electrical panel, plumbing, and water heater last replaced?
- Property tax is high relative to price — has the assessment been appealed recently, and will the sale trigger a re-assessment?
- Is there a deadline driving the sale (1031 exchange, divorce, estate, relocation)? That informs how much negotiation room exists.
- Schools are D-rated, which usually means shorter tenancies and higher turnover. Who's the typical renter profile here, and what's been the actual vacancy rate?
- What's the average days-on-market for RENTAL listings here right now (not sales)? A rising rental-DOM trend means longer vacancies and softer asking-rent achievability than the comps imply.
- What's the recent tenant-quality profile in this submarket — average credit score on applications, eviction rate, late-payment / NSF rate, and stable-employment percentage? A property-management company in the area should have these aggregated.
- How much new for-sale + rental construction is in the pipeline within 1–3 miles? Heavy new supply typically softens prices + rents 12–24 months out; constrained supply supports both.
Investment metrics
- 1% rule
- 1.13% ✓
- Cap rate
- 7.46%
- Cash-on-cash
- 4.16%
- DSCR
- 1.18
- GRM
- 7.4
CMA / ARV
- ARV (median comp)
- $267,527
- List price
- $152,900
- Delta
- -40.23%
- Verdict
- UNDERPRICED
- Comps
- 20 within 1.0 mi
Show comp detail 12 sales within ~0.75 mi
| Address | Dist | Beds/Ba | Sqft | Sold | Price | $/sf | Match |
|---|---|---|---|---|---|---|---|
| 510 Washington St | 0.31mi | 3/2.0 | 1,404 (-5%) | 1mo | $260,000 | $185 | 76 |
| 801 E Tyler St | 0.10mi | 3/2.0 | 1,384 (-6%) | 10mo | $290,000 | $210 | 76 |
| 206 E Belknap St | 0.37mi | 3/1.0 | 1,442 (-2%) | 4mo | $175,000 | $121 | 72 |
| 1308 N Kaufman St | 0.42mi | 3/2.0 | 1,394 (-6%) | 1mo | $195,000 | $140 | 70 |
| 705 E Denton St | 0.17mi | 3/2.0 | 1,627 (+10%) | 7mo | $298,000 | $183 | 69 |
| 1308 Daffan Ave | 0.38mi | 4/2.0 (+1) | 1,550 (+5%) | 4mo | $260,000 | $168 | 65 |
| 603 N Mckinney St | 0.58mi | 3/2.0 | 1,593 (+8%) | 5mo | $178,200 | $112 | 56 |
| 907 W Main St | 0.44mi | 3/1.0 | 1,326 (-10%) | 10mo | $68,000 | $51 | 50 |
| 609 N Sherman St | 0.64mi | 3/2.0 | 1,308 (-11%) | 8mo | $299,000 | $229 | 44 |
| 804 N Mckinney St | 0.54mi | 2/1.0 (-1) | 1,316 (-11%) | 8mo | $206,000 | $157 | 41 |
| 121 Highland Dr | 0.75mi | 3/1.5 | 1,304 (-12%) | 10mo | $199,999 | $153 | 36 |
| 409 S Paris St | 0.71mi | 2/1.0 (-1) | 1,320 (-11%) | 10mo | $215,000 | $163 | 32 |
Match score weights: distance 35% · size 25% · config 20% · recency 20%. Top-matched comps best support the ARV.
Projected returns pro-forma
-3.0% appreciation · 2.95% rent growth · sell at horizon
- IRR
- -9.8%
- Equity multiple
- 0.64×
- Total profit
- $-15,293
- Equity at exit
- $22,798
- IRR
- -0.3%
- Equity multiple
- 0.98×
- Total profit
- $-1,005
- Equity at exit
- $13,220
Cash invested: $42,812 (down + closing). Projections, not guarantees.
Landlord ↔ Tenant lean methodology
- Overall (STATE)
- 87 Strongly Landlord-Friendly
- State Texas
- 87 Strongly Landlord-Friendly · R+5
- County
- — inherits STATE
- City
- — inherits STATE
ZIP-level market 75119
- Rents YoY
- 3.0%
- Active inventory
- 363
- Price-to-rent
- 7.4×
Monthly cashflow live
- Estimated rent
- $1,728 high interval (Pro) →
- Mortgage (P&I)
- −$802
- Tax from tax record
- −$351 /mo · $4,215/yr
- Insurance
- −$64
- HOA
- −$0
- Vacancy / Maint / Mgmt
- −$363
- Net cashflow
- $148
Break-even live
UW: 25.0% down · 7.5% · 30yr · 1.5% tax · 5.0% vac · 8.0% maint · 8.0% mgmt
Financing live
Cash to close
- Down payment
- $38,225
- Closing costs
- $4,587
- Reserves months
- —
- Total cash needed
- —
Loan-product check · same deal, 3 products live
Conventional
25% down · 7.5% · 30yr
- Down + closing
- —
- Monthly P&I
- —
- Monthly cashflow
- —
- DSCR
- —
- Eligible?
- —
Personal DTI + credit; lowest rate.
DSCR
20% down · 8.5% · 30yr
- Down + closing
- —
- Monthly P&I
- —
- Monthly cashflow
- —
- DSCR
- —
- Eligible?
- —
No personal income docs; deal must DSCR.
Hard money
10% down · 12.0% · 12mo
- Down + closing
- —
- Monthly P&I
- —
- Monthly cashflow
- —
- DSCR
- —
- Eligible?
- —
Short-term bridge; refi at stabilization.
Rent comps 20 comps
| Address | Beds | Baths | Sqft | Rent | $/sqft | DOM | Units | Dist |
|---|---|---|---|---|---|---|---|---|
| 206 E Belknap St Ennis, TX | 3.0 | 1.0 | 1442 | $1,700 | $1.18 | 43d | 1 | 0.39mi |
| 205 W Gilmer St Ennis, TX | 2.0 | 1.0 | 1052 | $1,495 | $1.42 | 12d | 1 | 0.52mi |
| 205 W Gilmer St Ennis, TX | 2.0 | 1.0 | 1052 | $1,400 | $1.33 | 7d | 1 | 0.52mi |
| 110 W Knox St Unit 202 Ennis, TX | 2.0 | 1.0 | 882 | $1,400 | $1.59 | 24d | 1 | 0.62mi |
| 2000 N Kaufman St Ennis, TX | 1.0–3.0 | 1.0 | 821 | $1,300 | $1.58 | 1d | 6 | 0.73mi |
| 136 Highland Dr Ennis, TX | 3.0 | 1.0 | 1181 | $1,600 | $1.35 | 43d | 1 | 0.77mi |
| 136 Highland Dr Ennis, TX | 3.0 | 1.0 | 1181 | $1,600 | $1.35 | 12d | 1 | 0.77mi |
| 508 W Baylor St Apt B Ennis, TX | 3.0 | 2.0 | 1260 | $1,495 | $1.19 | 22d | 1 | 0.80mi |
| 2001 Floyd St Ennis, TX | 4.0 | 2.0 | 1350 | $1,641 | $1.22 | 1d | 1 | 0.81mi |
| 1203 N Clay St Unit 122 Ennis, TX | 2.0 | 2.0 | 1000 | $1,400 | $1.40 | 43d | 1 | 0.90mi |
| 715 W Tyler St Unit 715 Ennis, TX | 4.0 | 1.5 | 1000 | $1,700 | $1.70 | 43d | 1 | 0.90mi |
| 1309 N Clay St Ennis, TX | 3.0 | 2.0 | 1609 | $1,650 | $1.03 | 1d | 1 | 0.93mi |
| 1050 E Burnett St Unit 1B Ennis, TX | 3.0 | 2.0 | 1164 | $1,595 | $1.37 | 43d | 1 | 0.93mi |
| 910 W Knox St Unit B Ennis, TX | 2.0 | 2.0 | 1248 | $1,750 | $1.40 | 43d | 1 | 1.08mi |
| 710 W Waco St Ennis, TX | 3.0 | 2.0 | 1092 | $1,750 | $1.60 | 12d | 1 | 1.16mi |
| 517 Cherry Ln Ennis, TX | 4.0 | 2.0 | 1440 | $1,975 | $1.37 | 12d | 1 | 1.17mi |
| 914 S Chatfield St Ennis, TX | 2.0 | 2.0 | 948 | $1,595 | $1.68 | 6d | 1 | 1.38mi |
| 1500 W Baldridge St Ennis, TX | 3.0 | 2.0 | 1602 | $1,800 | $1.12 | 43d | 1 | 1.40mi |
| 1409 Fantail Ln Ennis, TX | 3.0 | 2.0 | 1346 | $1,795 | $1.33 | 43d | 1 | 1.45mi |
| 2402 Woodlawn Dr Ennis, TX | 3.0 | 2.0 | 1752 | $2,000 | $1.14 | 22d | 1 | 1.48mi |
Listing history 27 events
-
2026-06-15days on market $152,900 Active 28 DOM
-
2026-06-13days on market $152,900 Active 26 DOM
-
2026-06-09days on market $152,900 Active 22 DOM
-
2026-06-08days on market $152,900 Active 21 DOM
-
2026-06-07days on market $152,900 Active 20 DOM
-
2026-06-04days on market $152,900 Active 17 DOM
-
2026-06-03days on market $152,900 Active 16 DOM
-
2026-06-02days on market $152,900 Active 15 DOM
-
2026-06-01days on market $152,900 Active 14 DOM
-
2026-05-31days on market $152,900 Active 13 DOM
-
2026-05-18$159,900 Active 691-char remark
-
2026-05-13$159,900 Active 691-char remark
-
2026-05-13$159,900 Active
-
2026-05-06$159,900 Active
-
2021-02-09soldstatus
-
2021-01-28soldstatus Sold
-
2021-01-18status Pending
-
2021-01-03historical Active Option Contract
-
2020-12-28$145,000 Active
-
2017-02-28soldstatus Sold
-
2017-02-09status Pending
-
2017-01-26status Active
-
2017-01-11status Pending
-
2016-12-23price $44,900
-
2016-11-16price $54,900
-
2016-10-14price $63,900
-
2016-09-13$78,900 Active
ⓘ Source: listings_history table (triggers on properties + properties_extension) + one-shot
backfill from property_details.listing_events for pre-trigger history.
Tax reassessment forecast TX · Resets to sale price
- Current annual tax
- $4,215 · $351/mo
- Projected year-2 tax
- $4,215 · $351/mo
- Expected delta
- $0/yr ($0/mo · 0.0%)
ⓘ Screening estimate from a state-policy table — verify with the county assessor before closing.
Climate risk First Street
- Flood 1/10 Low FEMA zone X (unshaded) · 0% chance over 30 yrs
- Wildfire 4/10 Moderate
- Heat 7/10 Severe 7 d/yr ≥109°F today · 25 d/yr by 30 yrs out
- Wind 6/10 Major 39% chance of damaging wind over 30 yrs
- Air quality 2/10 Low 0 unhealthy d/yr today · 1 by 30 yrs out
Nearby sold comps map
Loading sold comps map…
Walkable amenities ~0.75 mi
Loading nearby amenities…
Taxation est. · year 1
- Rental income
- $20,736
- − Mortgage interest
- −$8,565
- − Property taxes
- −$4,215
- − Insurance
- −$764
- − Repairs & maintenance
- −$1,659
- − Management
- −$1,659
- − Depreciation
- −$4,448
- Taxable loss
- −$574
- Est. tax savings @ 24.0%
- +$138
- After-tax cash flow
- $1,917/yr
For passive investors: Depreciation is non-cash, so a rental often shows a tax loss while cash-flowing — sheltering income. Rental losses are passive: they offset passive income freely, and up to $25,000/yr can offset ordinary (W-2) income if you actively participate and your MAGI is under $100k (phasing out to $0 by $150k); unused losses carry forward. On sale, claimed depreciation is recaptured at up to 25%, and gains may owe capital-gains tax (a 1031 exchange can defer both). Figures are a year-1 estimate at your 24.0% rate — not tax advice; consult a CPA.
Schools (NCES district)
- District
- Ennis ISD
- NCES district ID
- 4818540
- Math proficiency
- 41% ▼ -6.00%
- Reading proficiency
- 39% ▼ -3.00%
- Median HH income
- $46,105
- Composite
- 34.14/100
- National rank
- #5283
- State rank
- #411 of 826 in TX
Livability — Ennis
- Score
- 71/100
- State rank
- #304
- US rank
- #6893
Category grades
Schools grade is shown separately in the Schools card above.
Census & demographics
- Census place
- Ennis, TX
- County
- Ellis County · 199,237 people
- City population
- 31,866
- Metro
- Dallas-Fort Worth-Arlington, TX
- Population (ZIP)
- 31,866
- Household income
- $77,053
- Rent vs Own
- Severe rent burden
- 784.0
Population outlook (Ellis County) Hauer SSP2
- Today (2025)
- 194,556 people
- By 2030
- 209,679 · +7.8%
- By 2040
- 238,837 · +22.8%
- By 2050
- 265,451 · +36.4%
- By 2075
- 326,571 · +67.9%
- By 2100
- 362,156 · +86.1%
Race, ethnicity, and origin ACS 2023
- Neighborhood character
- Diverse neighborhood (Simpson 0.60)
- Race & ethnicity
- White 47% Hispanic / Latino 41% Two or more races 13% Black 9%
- Hispanic origin (detail)
- Mexican 37%
- Common ancestry
- Slovak 1% Serbian 1% Italian 1%
- Foreign-born
- 15% · Canada
- Languages at home
- 69% English-only · Spanish 29% Other Indo-European 1%
Political lean MEDSL · Ellis
- 2024 margin
- Solid R (+31.1) · D 34.0% · R 65.1%
- 2008→2024 swing
- +11.2pp toward D · 2008: -42.2pp · 2024: -31.1pp
- All cycles
- 2024: R+31.1 2020: R+34.1 2016: R+45.4 2012: R+47.5 2008: R+42.2
Not yet ingested
- Civics
- —
Market trends
- HPI YoY
- ▼ -207.30%
- Current HPI
- 253.0134
- Rent YoY
- ▲ 2.95%
- Metro
- Dallas-Fort Worth-Arlington, TX
- State GDP YoY
- ▲ 3.95%
- F500 in state
- 110
Industry mix (Fortune 500 HQ in TX)
| Industry | F500 HQs | Revenue |
|---|---|---|
| Energy | 16 | $1,198B |
|
||
| Technology | 5 | $198B |
|
||
| Engineering / Construction | 4 | $72B |
|
||
| Energy Services | 3 | $60B |
|
||
| Utilities | 3 | $41B |
|
||
| Healthcare | 2 | $330B |
|
||
Price history
+93.8% since first listed26 events — show timeline
- 2026-06-15 Listing Removed — HARMLS
- 2026-06-15 Listing Removed — CTXMLS
- 2026-06-06 Listing Removed — NTREIS
- 2026-06-05 Relisted — NTREIS
- 2026-06-02 Contingent — NTREIS
- 2026-05-25 Price Changed $152,900 NTREIS
- 2026-05-25 Price Changed — Unlock MLS
- 2026-05-25 Price Changed $152,900 HARMLS
- 2026-05-25 Price Changed $152,900 CTXMLS
- 2026-05-18 Listed — Unlock MLS
- 2026-05-13 Listed $159,900 HARMLS
- 2026-05-13 Listed $159,900 CTXMLS
- 2026-05-06 Listed $159,900 NTREIS
- 2021-02-09 Sold (Public Records) — Public Records
- 2021-01-28 Sold (MLS) — NTREIS
- 2021-01-18 Pending — NTREIS
- 2021-01-03 Contingent — NTREIS
- 2020-12-28 Listed $145,000 NTREIS
- 2017-02-28 Sold (MLS) — NTREIS
- 2017-02-09 Pending — NTREIS
- 2017-01-26 Relisted — NTREIS
- 2017-01-11 Pending — NTREIS
- 2016-12-23 Price Changed $44,900 NTREIS
- 2016-11-16 Price Changed $54,900 NTREIS
- 2016-10-14 Price Changed $63,900 NTREIS
- 2016-09-13 Listed $78,900 NTREIS
Property tax history
+8.3%/yrLatest (2025): $4,215 · +1.3% YoY. Source: county tax records.
Cash-flow waterfall
monthlySold comps — $/sqft
last 12 mo · ≤1 miLoading sold comps…