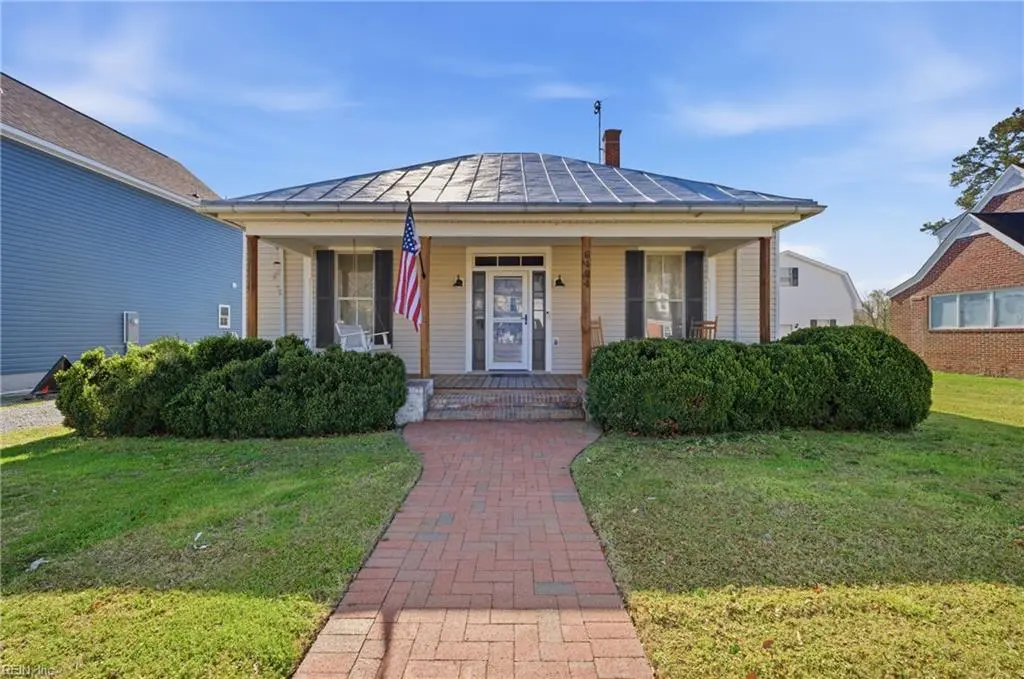
6404 Whaleyville Blvd · Suffolk, VA
Flood risk 1/10 · Minimal
- FEMA flood zone
- X (unshaded)
- Chance of flooding over 30 yrs
- 0.0%
- Est. flood insurance / yr
- $507 – $1,088
Fire risk 3/10 · Minor
- Est. fire insurance / yr
- $666 – $1,236
Heat risk 8/10 · Major
- Hot days now (above 109°F)
- 7 days/yr
- Hot days in 30 yrs
- 16 days/yr
Wind risk 8/10 · Major
- Chance of severe wind over 30 yrs
- 80.0%
Air-quality risk 2/10 · Minimal
- Unhealthy air days now
- 0 days/yr
- Unhealthy air days in 30 yrs
- 1 days/yr
Risk factors via First Street. Map © Google.
Why this score? — see what drove the C+ grade
The composite is a weighted blend of 9 inputs, each scored 0–100. Each bar is that input's sub-score; the figure is the points it added to the 100-point composite (weight × sub-score).
- Cash flow +26.9/30.0
- DSCR +9.3/10.0
- 1% rule +6.6/10.0
- Schools +4.8/10.0
- ARV discount +4.7/15.0
- Livability +3.9/5.0
- Rent growth +2.5/5.0
- Condition / age +2.5/5.0
- Appreciation +0.0/10.0
$320,000
🖨 Deal sheet 📄 Offer letter ✓ Due diligence
Listing remarks MLS
This charming property offers comfort, style, and your outdoor oasis. Inside, you’ll find freshly refinished floors that give a like-new feel throughout the home.Your backyard retreat features an above-ground pool, ideal for cooling off, and a custom bar area that is great for hosting. Don’t miss this opportunity for quaint, country living.
Key facts
- 0.33 acre lot
- 4 parking spots
- Pool
Neighborhood map
What this means for you Summary
Snapshot
- This is a 3-bed/2.0-bath single-family listed at $320k.
Deal economics
- At list price, monthly cash flow is $890 ($11k/yr) — positive.
- The deal already cash-flows at list — no discount required.
- Meets the 1% rule at list price ($4k rent vs $320k).
- Recommended offer: $301k (6.0% below list) — sets the bar for market timing.
- Cap rate 9.6% vs local median 3.5% in Suffolk — top-decile yield for the area; either an underpriced asset or a hidden risk that comps aren't pricing in. Stress-test before assuming the spread holds.
Location & tenants
- Location reads 77/100 on livability (#88 in VA, #2,896 nationally) — a middle-class / working-renter tenant base. Strengths: housing A+, health & safety A+, schools A; Watch: crime C-, commute F.
- Suffolk City Public School District (suburban): math 41% / reading 69% proficiency, ranked #72 of 131 in VA (top 55%) — acceptable for families but not a draw, mixed tenant base, ~2y average lease.
- Market conditions: 24 active listings in the ZIP; 680 units permitted in Suffolk city in 2024 (0 in 5+ unit buildings).
Forward outlook
- Local home prices are declining (-3.0%/yr); year-one equity from $2k of loan paydown is wiped out by about $10k of value loss. Plan a longer hold.
- Suffolk County population projected at +11% by 2050 — modest demand growth; plan on rents tracking national, not racing it.
- At projected returns (-3.0% appreciation + 3.0% rent growth), your $90k cash investment doubles in ~10 years — after that, you're playing with house money.
Negotiation context
- It's been on market 84 days — a 6% lower offer ($301k) is reasonable based on typical stale-listing flexibility.
- 5 sale attempts since 6y ago with the ask held roughly flat each time — persistent listings suggest the price (not the market) is what's stuck; bring a comps-based counter.
- Current owner paid $275k; 16% above their basis — modest negotiation headroom, anchor on the comps not their cost.
Risks & watch-outs
- Watch-outs: built in 1900 — expect roof / HVAC / electrical / plumbing capex.
- Climate carrying-cost: severe wind risk, 80% chance of damaging wind over 30y; extreme-heat days projected 7→16/yr by 2055 (HVAC capex compounding) — expect insurance premiums to compound above CPI over the hold.
Questions for the listing agent
- It's been on market 84 days. Have you received any prior offers? Is the seller open to a 6% concession, seller financing, or rate buy-down credit?
- Built in 1900 — when were the roof, HVAC, electrical panel, plumbing, and water heater last replaced?
- Why hasn't it sold? Are there any deal-killer items the seller is aware of (foundation, flood, title, zoning, code violations)?
- Is there a deadline driving the sale (1031 exchange, divorce, estate, relocation)? That informs how much negotiation room exists.
- Schools are A-rated — typically a magnet for longer-tenancy family renters. What's the average tenant stay here, and is there a school-zone premium baked into asking?
- What's the average days-on-market for RENTAL listings here right now (not sales)? A rising rental-DOM trend means longer vacancies and softer asking-rent achievability than the comps imply.
- What's the recent tenant-quality profile in this submarket — average credit score on applications, eviction rate, late-payment / NSF rate, and stable-employment percentage? A property-management company in the area should have these aggregated.
- How much new for-sale + rental construction is in the pipeline within 1–3 miles? Heavy new supply typically softens prices + rents 12–24 months out; constrained supply supports both.
Investment metrics
- 1% rule
- 1.16% ✓
- Cap rate
- 9.63%
- Cash-on-cash
- 11.92%
- DSCR
- 1.53
- GRM
- 7.2
CMA / ARV
- ARV (median comp)
- $301,164
- List price
- $320,000
- Delta
- 6.25%
- Verdict
- FAIR
- Comps
- 8 within 1.0 mi
Show comp detail 5 sales within ~0.75 mi
| Address | Dist | Beds/Ba | Sqft | Sold | Price | $/sf | Match |
|---|---|---|---|---|---|---|---|
| 6350 Whaleyville Blvd | 0.02mi | 3/2.5 | 1,436 (-13%) | 1mo | $339,900 | $237 | 75 |
| 148 Lane St | 0.22mi | 3/2.0 | 1,824 (+10%) | 9mo | $325,000 | $178 | 65 |
| 346 Great Fork Rd | 0.71mi | 3/2.0 | 1,683 (+2%) | 8mo | $328,000 | $195 | 57 |
| 229 Mineral Spring Rd | 0.35mi | 4/2.0 (+1) | 1,500 (-9%) | 10mo | $285,000 | $190 | 55 |
| 6661 Whaleyville Blvd | 0.59mi | 3/2.0 | 1,576 (-5%) | 13mo | $298,500 | $189 | 54 |
Match score weights: distance 35% · size 25% · config 20% · recency 20%. Top-matched comps best support the ARV.
Projected returns pro-forma
-3.0% appreciation · 3.0% rent growth · sell at horizon
- IRR
- 1.4%
- Equity multiple
- 1.05×
- Total profit
- $4,777
- Equity at exit
- $47,713
- IRR
- 11.0%
- Equity multiple
- 1.86×
- Total profit
- $76,965
- Equity at exit
- $27,668
Cash invested: $89,600 (down + closing). Projections, not guarantees.
Landlord ↔ Tenant lean methodology
- Overall (STATE)
- 55 Moderately Landlord-Leaning
- State Virginia
- 55 Moderately Landlord-Leaning · D+2
- County
- — inherits STATE
- City
- — inherits STATE
ZIP-level market 23438
- Home prices YoY
- -34.4%
- Active inventory
- 24
- Price-to-rent
- 7.2×
Monthly cashflow live
- Estimated rent
- $3,724 medium interval (Pro) →
- Mortgage (P&I)
- −$1,678
- Tax from tax record
- −$241 /mo · $2,891/yr
- Insurance
- −$133
- HOA
- −$0
- Vacancy / Maint / Mgmt
- −$782
- Net cashflow
- $890
Break-even live
UW: 25.0% down · 7.5% · 30yr · 1.5% tax · 5.0% vac · 8.0% maint · 8.0% mgmt
Financing live
Cash to close
- Down payment
- $80,000
- Closing costs
- $9,600
- Reserves months
- —
- Total cash needed
- —
Loan-product check · same deal, 3 products live
Conventional
25% down · 7.5% · 30yr
- Down + closing
- —
- Monthly P&I
- —
- Monthly cashflow
- —
- DSCR
- —
- Eligible?
- —
Personal DTI + credit; lowest rate.
DSCR
20% down · 8.5% · 30yr
- Down + closing
- —
- Monthly P&I
- —
- Monthly cashflow
- —
- DSCR
- —
- Eligible?
- —
No personal income docs; deal must DSCR.
Hard money
10% down · 12.0% · 12mo
- Down + closing
- —
- Monthly P&I
- —
- Monthly cashflow
- —
- DSCR
- —
- Eligible?
- —
Short-term bridge; refi at stabilization.
Listing history 29 events
-
2026-06-18days on market $320,000 Active 84 DOM
-
2026-06-17days on market $320,000 Active 83 DOM
-
2026-06-16days on market $320,000 Active 82 DOM
-
2026-06-15days on market $320,000 Active 81 DOM
-
2026-06-13days on market $320,000 Active 79 DOM
-
2026-06-09days on market $320,000 Active 75 DOM
-
2026-06-08days on market $320,000 Active 74 DOM
-
2026-06-07days on market $320,000 Active 73 DOM
-
2026-06-03days on market $320,000 Active 69 DOM
-
2026-06-02days on market $320,000 Active 68 DOM
-
2026-06-01days on market $320,000 Active 67 DOM
-
2026-05-31days on market $320,000 Active 66 DOM
-
2026-04-26price $327,500 354-char remark
Show marketing remark (354 chars)
This charming property offers comfort, style, and your outdoor oasis. Inside, you’ll find freshly refinished floors that give a like-new feel throughout the home.Your backyard retreat features an above-ground pool, ideal for cooling off, and a custom bar area that is great for hosting. Don’t miss this opportunity for quaint, country living.
-
2026-04-15price $329,500 354-char remark
Show marketing remark (354 chars)
This charming property offers comfort, style, and your outdoor oasis. Inside, you’ll find freshly refinished floors that give a like-new feel throughout the home.Your backyard retreat features an above-ground pool, ideal for cooling off, and a custom bar area that is great for hosting. Don’t miss this opportunity for quaint, country living.
-
2026-04-14status Active 354-char remark
Show marketing remark (354 chars)
This charming property offers comfort, style, and your outdoor oasis. Inside, you’ll find freshly refinished floors that give a like-new feel throughout the home.Your backyard retreat features an above-ground pool, ideal for cooling off, and a custom bar area that is great for hosting. Don’t miss this opportunity for quaint, country living.
-
2026-04-07historical Active Under Contract 354-char remark
Show marketing remark (354 chars)
This charming property offers comfort, style, and your outdoor oasis. Inside, you’ll find freshly refinished floors that give a like-new feel throughout the home.Your backyard retreat features an above-ground pool, ideal for cooling off, and a custom bar area that is great for hosting. Don’t miss this opportunity for quaint, country living.
-
2026-03-26$330,000 Active 354-char remark
Show marketing remark (354 chars)
This charming property offers comfort, style, and your outdoor oasis. Inside, you’ll find freshly refinished floors that give a like-new feel throughout the home.Your backyard retreat features an above-ground pool, ideal for cooling off, and a custom bar area that is great for hosting. Don’t miss this opportunity for quaint, country living.
-
2022-09-20soldstatus $275,000
-
2022-09-02status Under Contract
-
2022-08-22historical Active Under Contract
-
2022-07-28$275,000 Active
-
2022-01-31soldstatus $150,000
-
2022-01-04status Under Contract
-
2021-10-30historical Active Under Contract
-
2021-10-20$149,000 Active
-
2021-02-04soldstatus $225,800
-
2020-12-30status Under Contract
-
2020-12-11historical Active Under Contract
-
2020-11-09$189,900 Active
ⓘ Source: listings_history table (triggers on properties + properties_extension) + one-shot
backfill from property_details.listing_events for pre-trigger history.
Tax reassessment forecast VA · Resets to sale price
- Current annual tax
- $2,891 · $241/mo
- Projected year-2 tax
- $2,891 · $241/mo
- Expected delta
- $0/yr ($0/mo · 0.0%)
ⓘ Screening estimate from a state-policy table — verify with the county assessor before closing.
Climate risk First Street
- Flood 1/10 Low FEMA zone X (unshaded) · 0% chance over 30 yrs
- Wildfire 3/10 Moderate
- Heat 8/10 Severe 7 d/yr ≥109°F today · 16 d/yr by 30 yrs out
- Wind 8/10 Severe 80% chance of damaging wind over 30 yrs
- Air quality 2/10 Low 0 unhealthy d/yr today · 1 by 30 yrs out
Nearby sold comps map
Loading sold comps map…
Walkable amenities ~0.75 mi
Loading nearby amenities…
Taxation est. · year 1
- Rental income
- $44,691
- − Mortgage interest
- −$17,925
- − Property taxes
- −$2,891
- − Insurance
- −$1,600
- − Repairs & maintenance
- −$3,575
- − Management
- −$3,575
- − Depreciation
- −$9,309
- Taxable income
- $5,816
- Est. tax owed @ 24.0%
- −$1,396
- After-tax cash flow
- $9,282/yr
For passive investors: Depreciation is non-cash, so a rental often shows a tax loss while cash-flowing — sheltering income. Rental losses are passive: they offset passive income freely, and up to $25,000/yr can offset ordinary (W-2) income if you actively participate and your MAGI is under $100k (phasing out to $0 by $150k); unused losses carry forward. On sale, claimed depreciation is recaptured at up to 25%, and gains may owe capital-gains tax (a 1031 exchange can defer both). Figures are a year-1 estimate at your 24.0% rate — not tax advice; consult a CPA.
Schools (NCES district)
- District
- Suffolk City Public School District
- NCES district ID
- 5103710
- Math proficiency
- 41% ▼ -43.00%
- Reading proficiency
- 69% ▼ -8.00%
- Median HH income
- $65,573
- Composite
- 48.31/100
- National rank
- #2151
- State rank
- #72 of 131 in VA
Livability — Suffolk
- Score
- 77/100
- State rank
- #88
- US rank
- #2896
Category grades
Schools grade is shown separately in the Schools card above.
Census & demographics
- Census place
- Suffolk, VA
- City population
- 88,108
- Population (ZIP)
- 1,620
Population outlook (Suffolk County) Hauer SSP2
- Today (2025)
- 95,269 people
- By 2030
- 98,269 · +3.1%
- By 2040
- 103,177 · +8.3%
- By 2050
- 105,777 · +11.0%
- By 2075
- 110,963 · +16.5%
- By 2100
- 103,711 · +8.9%
Race, ethnicity, and origin ACS 2023
- Neighborhood character
- Predominantly White (83%)
- Race & ethnicity
- White 83% Two or more races 6% Asian 5% Black 4% Hispanic / Latino 4%
- Common ancestry
- Slovak 3% Lithuanian 1% Iranian 1%
- Foreign-born
- 4% · Canada
- Languages at home
- 94% English-only · Other Indo-European 3% Spanish 2%
Political lean MEDSL · Suffolk
- 2024 margin
- D (+15.9) · D 57.4% · R 41.5% · Other 1.2%
- 2008→2024 swing
- +2.7pp toward D · 2008: 13.2pp · 2024: 15.9pp
- All cycles
- 2024: D+15.9 2020: D+17.3 2016: D+13.8 2012: D+15.1 2008: D+13.2
Not yet ingested
- Civics
- —
Market trends
- HPI YoY
- ▼ -84.36%
- Current HPI
- 160.6199
- Rent YoY
- —
- Metro
- —
- State GDP YoY
- ▲ 2.40%
- F500 in state
- 50
Industry mix (Fortune 500 HQ in VA)
| Industry | F500 HQs | Revenue |
|---|---|---|
| Aerospace / Defense | 4 | $236B |
|
||
| Technology / Defense | 3 | $32B |
|
||
| Financial Services | 2 | $176B |
|
||
| Utilities | 2 | $27B |
|
||
| Insurance | 2 | $25B |
|
||
| Technology | 2 | $15B |
|
||
Price history
+72.5% since first listed17 events — show timeline
- 2026-04-26 Price Changed $327,500 REINMLS
- 2026-04-15 Price Changed $329,500 REINMLS
- 2026-04-14 Relisted — REINMLS
- 2026-04-07 Contingent — REINMLS
- 2026-03-26 Listed $330,000 REINMLS
- 2022-09-20 Sold (Public Records) $275,000 Public Records
- 2022-09-02 Pending — REINMLS
- 2022-08-22 Contingent — REINMLS
- 2022-07-28 Listed $275,000 REINMLS
- 2022-01-31 Sold (Public Records) $150,000 Public Records
- 2022-01-04 Pending — REINMLS
- 2021-10-30 Contingent — REINMLS
- 2021-10-20 Listed $149,000 REINMLS
- 2021-02-04 Sold (Public Records) $225,800 Public Records
- 2020-12-30 Pending — REINMLS
- 2020-12-11 Contingent — REINMLS
- 2020-11-09 Listed $189,900 REINMLS
Property tax history
+7.8%/yrLatest (2025): $2,891 · +3.5% YoY. Source: county tax records.
Cash-flow waterfall
monthlySold comps — $/sqft
last 12 mo · ≤1 miLoading sold comps…