 🌊 Lakefront
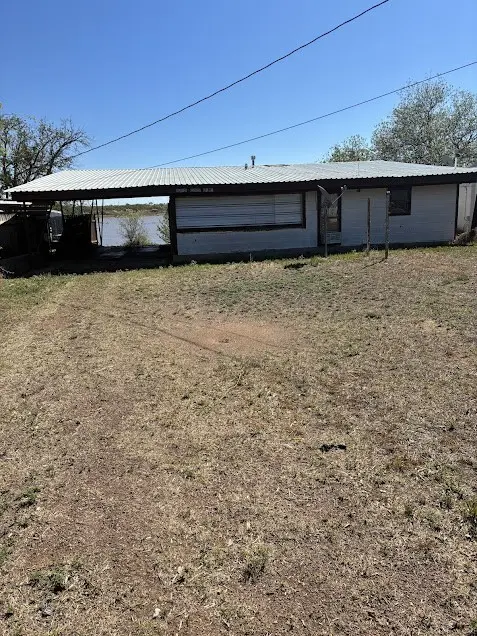
2239 Lois Ln · Lake Colorado City, TX
Flood risk 4/10 · Minor
- FEMA flood zone
- A
- Chance of flooding over 30 yrs
- 0.22%
- Est. flood insurance / yr
- $1,009 – $1,996
Fire risk 6/10 · Moderate
- Est. fire insurance / yr
- $1,222 – $2,270
Heat risk 7/10 · Major
- Hot days now (above 104°F)
- 6 days/yr
- Hot days in 30 yrs
- 18 days/yr
Wind risk 3/10 · Minor
- Chance of severe wind over 30 yrs
- 7.0%
Air-quality risk 1/10 · Minimal
- Unhealthy air days now
- 0 days/yr
- Unhealthy air days in 30 yrs
- 0 days/yr
Risk factors via First Street. Map © Google.
Why this score? — see what drove the B+ grade
The composite is a weighted blend of 9 inputs, each scored 0–100. Each bar is that input's sub-score; the figure is the points it added to the 100-point composite (weight × sub-score).
- Cash flow +30.0/30.0
- 1% rule +10.0/10.0
- DSCR +10.0/10.0
- ARV discount +7.5/15.0
- Appreciation +7.2/10.0
- Schools +4.3/10.0
- Livability +3.2/5.0
- Rent growth +2.5/5.0
- Condition / age +2.5/5.0
$59,999
🖨 Deal sheet (PDF) 📄 Offer letter ✓ Due diligence
Listing remarks MLS
LAKE FRONTAGE! We just listed this small lake front home in Colorado City! It is located in the Lake Colorado City area and a short drive to the Lake Colorado City State Park. This home has frontage RIGHT ON THE LAKE. It is being sold AS IS but has a lot of potential. WE MAKE IT EASY TO OWN. If you are a fisherman this is your great opportunity! Don't wait, call us today to get more information on the owner's easy terms and smooth process that may be able to put the deed in your name and make this your dream home.
Key facts
- Lake frontage
- Right on the lake
- 9,530 sq ft lot
Tags
Neighborhood map
What this means for you Summary
Snapshot
- This is a 2-bed/1.0-bath single-family listed at $60k.
Deal economics
- At list price, monthly cash flow is $240 ($3k/yr) — positive.
- The deal already cash-flows at list — no discount required.
- Meets the 1% rule at list price ($944 rent vs $60k).
- Recommended offer: $53k (12.0% below list) — sets the bar for market timing.
Location & tenants
- Location reads 64/100 on livability (#782 in TX) — a middle-class / working-renter tenant base. Strengths: employment A+, cost of living A+, housing A+; Watch: health & safety C-, schools F, crime F.
- Westbrook ISD (rural): math 50% / reading 45% proficiency, ranked #429 of 1,141 in TX (top 38%) — families likely to look elsewhere, expect single-tenant / working-renter base with shorter leases.
- Market conditions: 86 active listings in the ZIP.
Forward outlook
- In year one you build about $3k of equity ($415 loan paydown + $3k appreciation (4.4% local appreciation)).
- Mitchell County population projected at +8% by 2050 — modest demand growth; plan on rents tracking national, not racing it.
- At projected returns (4.4% appreciation + 3.0% rent growth), your $17k cash investment doubles in ~3 years — after that, you're playing with house money.
Negotiation context
- It's been on market 207 days — a 12% lower offer ($53k) is reasonable based on typical stale-listing flexibility.
Risks & watch-outs
- Watch-outs: flood insurance adds $125/mo; built in 1950 — expect roof / HVAC / electrical / plumbing capex.
- Climate carrying-cost: in FEMA flood zone A (mandatory federal flood insurance); major wildfire risk; extreme-heat days projected 6→18/yr by 2055 (HVAC capex compounding) — expect insurance premiums to compound above CPI over the hold.
Questions for the listing agent
- It's been on market 207 days. Have you received any prior offers? Is the seller open to a 12% concession, seller financing, or rate buy-down credit?
- Built in 1950 — when were the roof, HVAC, electrical panel, plumbing, and water heater last replaced?
- What's the actual annual flood-insurance premium (NFIP or private), and is the property in a SFHA with mandatory coverage?
- Why hasn't it sold? Are there any deal-killer items the seller is aware of (foundation, flood, title, zoning, code violations)?
- Is there a deadline driving the sale (1031 exchange, divorce, estate, relocation)? That informs how much negotiation room exists.
- Schools are F-rated, which usually means shorter tenancies and higher turnover. Who's the typical renter profile here, and what's been the actual vacancy rate?
- Crime grade is F in this area — have there been break-ins, vandalism, or insurance claims at this property in the last 3 years? What carrier currently insures it and at what premium?
- This sits on a lake — are riparian / water-frontage rights deeded with the parcel? Any dock permits, shoreline easements, or HOA water-use restrictions?
- What's the documented flood / surge / shoreline-erosion history here (FEMA AND non-FEMA — e.g., storm surge, creek backup, septic-field saturation)?
- Any water-quality or seasonal algae-bloom issues that affect tenant satisfaction or short-term-rental demand?
- What's the average days-on-market for RENTAL listings here right now (not sales)? A rising rental-DOM trend means longer vacancies and softer asking-rent achievability than the comps imply.
- What's the recent tenant-quality profile in this submarket — average credit score on applications, eviction rate, late-payment / NSF rate, and stable-employment percentage? A property-management company in the area should have these aggregated.
- How much new for-sale + rental construction is in the pipeline within 1–3 miles? Heavy new supply typically softens prices + rents 12–24 months out; constrained supply supports both.
Investment metrics
- 1% rule
- 1.57% ✓
- Cap rate
- 13.59%
- Cash-on-cash
- 26.05%
- DSCR
- 2.16
- GRM
- 5.3
CMA / ARV
No comps found within radius.
Projected returns pro-forma
4.37% appreciation · 3.0% rent growth · sell at horizon
- IRR
- 26.5%
- Equity multiple
- 2.61×
- Total profit
- $27,024
- Equity at exit
- $31,733
- IRR
- 26.0%
- Equity multiple
- 5.15×
- Total profit
- $69,735
- Equity at exit
- $52,978
Cash invested: $16,800 (down + closing). Projections, not guarantees.
Landlord ↔ Tenant lean methodology
- Overall (STATE)
- 87 Strongly Landlord-Friendly
- State Texas
- 87 Strongly Landlord-Friendly · R+5
- County
- — inherits STATE
- City
- — inherits STATE
ZIP-level market 79512
- Home prices YoY
- 4.6%
- Active inventory
- 86
- Price-to-rent
- 5.3×
Monthly cashflow live
- Estimated rent
- $944 medium interval (Pro) →
- Mortgage (P&I)
- −$315
- Tax from tax record
- −$42 /mo · $499/yr
- Insurance
- −$25
- Flood insurance flood zone
- −$125 /mo · $1,502/yr
- HOA
- −$0
- Vacancy / Maint / Mgmt
- −$198
- Net cashflow
- $240
Break-even live
Sensitivity live
| Price | -10% $273 | -5% $257 | +0% $240 | +5% $223 | +10% $206 |
|---|---|---|---|---|---|
| Rent | -10% $165 | -5% $202 | +0% $240 | +5% $277 | +10% $314 |
| Rate | -1.0pp $270 | -0.5pp $255 | base $240 | +0.5pp $224 | +1.0pp $208 |
UW: 25.0% down · 7.5% · 30yr · 1.5% tax · 5.0% vac · 8.0% maint · 8.0% mgmt
Financing live
Cash to close
- Down payment
- $15,000
- Closing costs
- $1,800
- Reserves months
- —
- Total cash needed
- —
Loan-product check · same deal, 3 products live
Conventional
25% down · 7.5% · 30yr
- Down + closing
- —
- Monthly P&I
- —
- Monthly cashflow
- —
- DSCR
- —
- Eligible?
- —
Personal DTI + credit; lowest rate.
DSCR
20% down · 8.5% · 30yr
- Down + closing
- —
- Monthly P&I
- —
- Monthly cashflow
- —
- DSCR
- —
- Eligible?
- —
No personal income docs; deal must DSCR.
Hard money
10% down · 12.0% · 12mo
- Down + closing
- —
- Monthly P&I
- —
- Monthly cashflow
- —
- DSCR
- —
- Eligible?
- —
Short-term bridge; refi at stabilization.
Listing history 19 events
-
2026-06-21days on market $59,999 Pending 207 DOM
-
2026-06-21days on market $59,999 Pending 206 DOM
-
2026-06-18days on market $59,999 Pending 204 DOM
-
2026-06-17days on market $59,999 Pending 203 DOM
-
2026-06-16days on market $59,999 Pending 202 DOM
-
2026-06-15days on market $59,999 Pending 201 DOM
-
2026-06-15days on market $59,999 Pending 200 DOM
-
2026-06-13days on market $59,999 Pending 199 DOM
-
2026-06-12days on market $59,999 Pending 198 DOM
-
2026-06-09days on market $59,999 Pending 195 DOM
-
2026-06-08statusdays on market $59,999 Pending 194 DOM
-
2026-06-08days on market $59,999 Active 193 DOM
-
2026-06-05days on market $59,999 Active 191 DOM
-
2026-06-03days on market $59,999 Active 189 DOM
-
2026-06-02days on market $59,999 Active 188 DOM
-
2026-06-01days on market $59,999 Active 187 DOM
-
2026-05-31days on market $59,999 Active 186 DOM
-
2025-11-26$59,999 Active 519-char remark
Show marketing remark (519 chars)
LAKE FRONTAGE! We just listed this small lake front home in Colorado City! It is located in the Lake Colorado City area and a short drive to the Lake Colorado City State Park. This home has frontage RIGHT ON THE LAKE. It is being sold AS IS but has a lot of potential. WE MAKE IT EASY TO OWN. If you are a fisherman this is your great opportunity! Don't wait, call us today to get more information on the owner's easy terms and smooth process that may be able to put the deed in your name and make this your dream home.
-
2018-02-23soldstatus
ⓘ Source: listings_history table (triggers on properties + properties_extension) + one-shot
backfill from property_details.listing_events for pre-trigger history.
Tax reassessment forecast TX · Resets to sale price
- Current annual tax
- $499 · $42/mo
- Projected year-2 tax
- $1,098 · $91/mo
- Expected delta
- +$599/yr (+$50/mo · 119.9%)
ⓘ Screening estimate from a state-policy table — verify with the county assessor before closing.
Climate risk First Street
- Flood 4/10 Moderate FEMA zone A · 22% chance over 30 yrs
- Wildfire 6/10 Major
- Heat 7/10 Severe 6 d/yr ≥104°F today · 18 d/yr by 30 yrs out
- Wind 3/10 Moderate 7% chance of damaging wind over 30 yrs
- Air quality 1/10 Low 0 unhealthy d/yr today · 0 by 30 yrs out
Nearby sold comps map
Loading sold comps map…
Walkable amenities ~0.75 mi
Loading nearby amenities…
Taxation est. · year 1
- Rental income
- $11,332
- − Mortgage interest
- −$3,361
- − Property taxes
- −$499
- − Insurance
- −$1,802
- − Repairs & maintenance
- −$907
- − Management
- −$907
- − Depreciation
- −$1,745
- Taxable income
- $2,110
- Est. tax owed @ 24.0%
- −$506
- After-tax cash flow
- $2,368/yr
For passive investors: Depreciation is non-cash, so a rental often shows a tax loss while cash-flowing — sheltering income. Rental losses are passive: they offset passive income freely, and up to $25,000/yr can offset ordinary (W-2) income if you actively participate and your MAGI is under $100k (phasing out to $0 by $150k); unused losses carry forward. On sale, claimed depreciation is recaptured at up to 25%, and gains may owe capital-gains tax (a 1031 exchange can defer both). Figures are a year-1 estimate at your 24.0% rate — not tax advice; consult a CPA.
Schools (NCES district)
- District
- Westbrook ISD
- NCES district ID
- 4845210
- Math proficiency
- 50% ▲ 10.00%
- Reading proficiency
- 45% ▲ 5.00%
- Median HH income
- $51,806
- Composite
- 43.02/100
- National rank
- #6658
- State rank
- #429 of 1141 in TX
Livability — Lake Colorado City
- Score
- 64/100
- State rank
- #782
- US rank
- #14249
Category grades
Schools grade is shown separately in the Schools card above.
Census & demographics
- Census place
- Lake Colorado City, TX
- City population
- 7,672
- Population (ZIP)
- 7,672
Population outlook (Mitchell County) Hauer SSP2
- Today (2025)
- 8,476 people
- By 2030
- 8,723 · +2.9%
- By 2040
- 9,046 · +6.7%
- By 2050
- 9,200 · +8.5%
- By 2075
- 8,936 · +5.4%
- By 2100
- 7,978 · -5.9%
Race, ethnicity, and origin ACS 2023
- Neighborhood character
- Diverse neighborhood (Simpson 0.64)
- Race & ethnicity
- White 47% Hispanic / Latino 37% Two or more races 20% Black 6% Asian 2%
- Hispanic origin (detail)
- Mexican 34%
- Common ancestry
- Serbian 2% Lithuanian 1% Slovak 1%
- Foreign-born
- 3% · Canada
- Languages at home
- 80% English-only · Spanish 18% Tagalog/Filipino 1%
Political lean MEDSL · Mitchell
- 2024 margin
- Solid R (+71.3) · D 14.0% · R 85.3%
- 2008→2024 swing
- -20.8pp toward R · 2008: -50.5pp · 2024: -71.3pp
- All cycles
- 2024: R+71.3 2020: R+68.8 2016: R+65.2 2012: R+52.7 2008: R+50.5
Not yet ingested
- Civics
- —
Market trends
- HPI YoY
- ▲ 4.37%
- Current HPI
- 99.8822
- Rent YoY
- —
- Metro
- —
- State GDP YoY
- ▲ 3.95%
- F500 in state
- 110
Industry mix (Fortune 500 HQ in TX)
| Industry | F500 HQs | Revenue |
|---|---|---|
| Energy | 16 | $1,198B |
|
||
| Technology | 5 | $198B |
|
||
| Engineering / Construction | 4 | $72B |
|
||
| Energy Services | 3 | $60B |
|
||
| Utilities | 3 | $41B |
|
||
| Healthcare | 2 | $330B |
|
||
Price history
2 events — show timeline
- 2025-11-26 Listed $59,999 HARMLS
- 2018-02-23 Sold (Public Records) — Public Records
Property tax history
-3.7%/yrLatest (2025): $499 · -31.6% YoY. Source: county tax records.
Cash-flow waterfall
monthlySold comps — $/sqft
last 12 mo · ≤1 miLoading sold comps…