 Multi-family
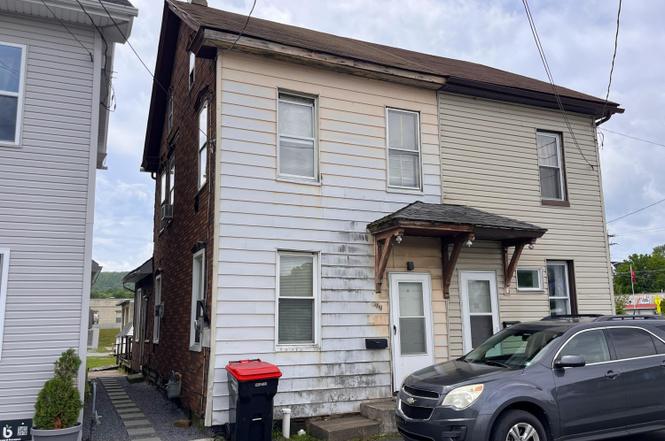
207 N Main Ln · Lehighton, PA
Flood risk 8/10 · Major
- FEMA flood zone
- AE
- Chance of flooding over 30 yrs
- 0.96%
- Est. flood insurance / yr
- $1,737 – $8,500
Fire risk 3/10 · Minor
- Est. fire insurance / yr
- $511 – $949
Heat risk 4/10 · Minor
- Hot days now (above 98°F)
- 7 days/yr
- Hot days in 30 yrs
- 16 days/yr
Wind risk 4/10 · Minor
- Chance of severe wind over 30 yrs
- 10.0%
Air-quality risk 2/10 · Minimal
- Unhealthy air days now
- 1 days/yr
- Unhealthy air days in 30 yrs
- 2 days/yr
Risk factors via First Street. Map © Google.
Why this score? — see what drove the D grade
The composite is a weighted blend of 9 inputs, each scored 0–100. Each bar is that input's sub-score; the figure is the points it added to the 100-point composite (weight × sub-score).
- Cash flow +15.0/30.0
- ARV discount +7.5/15.0
- 1% rule +5.0/10.0
- DSCR +5.0/10.0
- Livability +3.9/5.0
- Schools +3.5/10.0
- Rent growth +2.5/5.0
- Condition / age +2.5/5.0
- Appreciation +0.0/10.0
$49,900
🖨 Deal sheet 📄 Offer letter ✓ Due diligence
Multi-family units
County records classify this as Multi-Family (2-4 Unit). Listing-text estimate: 1 unit. estimate disagrees with records
Listing remarks
Handyman special! This 3 bedroom/1 bath home is looking to be refreshed & is conveniently located next to the Lehighton Spur of the D & L biking Trail! The main floor features a traditional layout complete with living room, dining room, & eat-in kitchen. The second floor includes 2 bedrooms & 1 full bathroom, while the third floor has an additional bedroom (no built-in heat source on the third floor). The rear deck leads to a charming yard. Plenty of potential! This is a cash only sale. Please be cautious when touring the home as the property is in disrepair and be sure to bring a flashlight. The rear utility shed/pigeon coop belongs to the neighbor; the neighbor pla
Key facts
- D l biking trail
- Charming yard
- Utility shed
Tags
Property features AI
Exterior
- Parking: On-street parking
- Utilities: Public water; Public sewer
- Home design: Duplex; Single-family residence subtype; Shared wall (1 common wall)
- Construction: Shingle roof; Asbestos, asphalt, and aluminum siding exterior materials
- Exterior features: Deck; Level lot; Paved road access; Publicly maintained road
Interior
- Kitchen: Electric oven; Electric range
- Flooring: Linoleum; Vinyl
- Bathrooms: 1 full bathroom
- Heating & cooling: Baseboard heating; Electric heating
- Interior features: Unfurnished; 6 total rooms
- Laundry & utility: Washer; Dryer
Neighborhood map
What this means for you Summary
Snapshot
- This is a 2-bed/1.0-bath multifamily listed at $50k.
Deal economics
- At list price, monthly cash flow is $1k ($13k/yr) — positive.
- The deal already cash-flows at list — no discount required.
- Meets the 1% rule at list price ($2k rent vs $50k).
- Cap rate 43.3% vs local median 4.7% in Lehighton — top-decile yield for the area; either an underpriced asset or a hidden risk that comps aren't pricing in. Stress-test before assuming the spread holds.
Location & tenants
- Location reads 77/100 on livability (#321 in PA, #2,848 nationally) — a middle-class / working-renter tenant base. Strengths: cost of living A+, health & safety A+, crime A-; Watch: employment D, commute F.
- Lehighton Area SD (suburban): math 32% / reading 50% proficiency, ranked #336 of 539 in PA (top 62%) — families likely to look elsewhere, expect single-tenant / working-renter base with shorter leases.
- Market conditions: 139 active listings in the ZIP; 6 comparable units currently listed for rent nearby; rentals leasing fast (median 3d on market — plan ~1-2 weeks tenant-placement turnaround); 180 units permitted in Carbon County in 2024 (10 in 5+ unit buildings).
Forward outlook
- Local home prices are declining (-3.0%/yr); year-one equity from $345 of loan paydown is wiped out by about $1k of value loss. Plan a longer hold.
- Carbon County population projected at -18% by 2050 — secular population decline; favor cash flow + early exit over multi-decade hold.
- At projected returns (-3.0% appreciation + 3.0% rent growth), your $14k cash investment doubles in ~2 years — after that, you're playing with house money.
Negotiation context
- Only 1 days on market — expect competitive offers; lowballing is unlikely to land.
Risks & watch-outs
- Watch-outs: property tax is 3.7% of price; flood insurance adds $427/mo; built in 1925 — expect roof / HVAC / electrical / plumbing capex.
- Climate carrying-cost: in FEMA flood zone AE (mandatory federal flood insurance) — expect insurance premiums to compound above CPI over the hold.
Questions for the listing agent
- Built in 1925 — when were the roof, HVAC, electrical panel, plumbing, and water heater last replaced?
- Property tax is high relative to price — has the assessment been appealed recently, and will the sale trigger a re-assessment?
- What's the actual annual flood-insurance premium (NFIP or private), and is the property in a SFHA with mandatory coverage?
- Is there a deadline driving the sale (1031 exchange, divorce, estate, relocation)? That informs how much negotiation room exists.
- The area grade is low — what's the realistic commute time and amenity access for the typical tenant pool here? Any planned neighborhood developments (good or bad) we should know about?
- What's the average days-on-market for RENTAL listings here right now (not sales)? A rising rental-DOM trend means longer vacancies and softer asking-rent achievability than the comps imply.
- What's the recent tenant-quality profile in this submarket — average credit score on applications, eviction rate, late-payment / NSF rate, and stable-employment percentage? A property-management company in the area should have these aggregated.
- How much new apartment / multifamily construction is in the pipeline within 1–3 miles? Heavy new supply (>2% of stock underway) typically softens rents 12–24 months out; light construction supports rent growth.
Investment metrics
- 1% rule
- 5.01% ✓
- Cap rate
- 43.33%
- Cash-on-cash
- 132.28%
- DSCR
- 6.89
- GRM
- 1.7
CMA / ARV
No comps found within radius.
Projected returns pro-forma
-3.0% appreciation · 3.0% rent growth · sell at horizon
- IRR
- 96.8%
- Equity multiple
- 5.52×
- Total profit
- $63,198
- Equity at exit
- $7,440
- IRR
- 99.5%
- Equity multiple
- 11.58×
- Total profit
- $147,807
- Equity at exit
- $4,314
Cash invested: $13,972 (down + closing). Projections, not guarantees.
Landlord ↔ Tenant lean methodology
- Overall (STATE)
- 62 Landlord-Friendly
- State Pennsylvania
- 62 Landlord-Friendly · EVEN
- County
- — inherits STATE
- City
- — inherits STATE
ZIP-level market 18235
- Home prices YoY
- -27.1%
- Active inventory
- 139
- Price-to-rent
- 3.3×
Monthly cashflow live
- Estimated rent
- $2,500 medium interval (Pro) →
- Mortgage (P&I)
- −$262
- Tax from tax record
- −$152 /mo · $1,828/yr
- Insurance
- −$21
- Flood insurance flood zone
- −$427 /mo · $5,118/yr
- HOA
- −$0
- Vacancy / Maint / Mgmt
- −$525
- Net cashflow
- $1,114
Break-even live
2-unit breakdown (identical units grouped — click to expand)
| Units | Beds | Baths | Est. rent |
|---|---|---|---|
| 1× unit | 3 | 1 | $1,250 |
| 1× unit | 2 | 1 | $1,250 |
| Total (2 units) | $2,500 | ||
UW: 25.0% down · 7.5% · 30yr · 1.5% tax · 5.0% vac · 8.0% maint · 8.0% mgmt
Financing live
Cash to close
- Down payment
- $12,475
- Closing costs
- $1,497
- Reserves months
- —
- Total cash needed
- —
Loan-product check · same deal, 3 products live
Conventional
25% down · 7.5% · 30yr
- Down + closing
- —
- Monthly P&I
- —
- Monthly cashflow
- —
- DSCR
- —
- Eligible?
- —
Personal DTI + credit; lowest rate.
DSCR
20% down · 8.5% · 30yr
- Down + closing
- —
- Monthly P&I
- —
- Monthly cashflow
- —
- DSCR
- —
- Eligible?
- —
No personal income docs; deal must DSCR.
Hard money
10% down · 12.0% · 12mo
- Down + closing
- —
- Monthly P&I
- —
- Monthly cashflow
- —
- DSCR
- —
- Eligible?
- —
Short-term bridge; refi at stabilization.
Rent comps 6 comps
| Address | Beds | Baths | Sqft | Rent | $/sqft | DOM | Units | Dist |
|---|---|---|---|---|---|---|---|---|
| 206 N 2nd St Lehighton, PA | 3.0 | 1.0 | 1000 | $1,450 | $1.45 | 2d | 1 | 0.22mi |
| 204 N 2nd St Lehighton, PA | 3.0 | 1.0 | 1000 | $1,600 | $1.60 | 2d | 1 | 0.25mi |
| 339 N 2nd St Lehighton, PA | 3.0 | 1.0 | 1073 | $1,700 | $1.58 | 2d | 1 | 0.34mi |
| 318 Bridge St Unit A Weissport, PA | 2.0 | 1.0 | 900 | $975 | $1.08 | 2d | 1 | 0.35mi |
| 404 Mahoning St Apt 2 Lehighton, PA | 3.0 | 1.0 | 800 | $1,500 | $1.88 | 2d | 1 | 0.37mi |
| 123 Jamestown St Lehighton, PA | 2.0 | 1.0 | 780 | $1,395 | $1.79 | 2d | 1 | 0.58mi |
Listing history 2 events
-
2026-06-19remarks 683-char remark
-
2026-06-19$49,900 Active 1 DOM
ⓘ Source: listings_history table (triggers on properties + properties_extension) + one-shot
backfill from property_details.listing_events for pre-trigger history.
Tax reassessment forecast PA · Partial reset (capped growth)
- Current annual tax
- $1,828 · $152/mo
- Projected year-2 tax
- $1,828 · $152/mo
- Expected delta
- $0/yr ($0/mo · 0.0%)
ⓘ Screening estimate from a state-policy table — verify with the county assessor before closing.
Climate risk First Street
- Flood 8/10 Severe FEMA zone AE · 96% chance over 30 yrs
- Wildfire 3/10 Moderate
- Heat 4/10 Moderate 7 d/yr ≥98°F today · 16 d/yr by 30 yrs out
- Wind 4/10 Moderate 10% chance of damaging wind over 30 yrs
- Air quality 2/10 Low 1 unhealthy d/yr today · 2 by 30 yrs out
Nearby sold comps map
Loading sold comps map…
Walkable amenities ~0.75 mi
Loading nearby amenities…
Taxation est. · year 1
- Rental income
- $30,000
- − Mortgage interest
- −$2,795
- − Property taxes
- −$1,828
- − Insurance
- −$5,368
- − Repairs & maintenance
- −$2,400
- − Management
- −$2,400
- − Depreciation
- −$1,452
- Taxable income
- $13,757
- Est. tax owed @ 24.0%
- −$3,302
- After-tax cash flow
- $10,062/yr
For passive investors: Depreciation is non-cash, so a rental often shows a tax loss while cash-flowing — sheltering income. Rental losses are passive: they offset passive income freely, and up to $25,000/yr can offset ordinary (W-2) income if you actively participate and your MAGI is under $100k (phasing out to $0 by $150k); unused losses carry forward. On sale, claimed depreciation is recaptured at up to 25%, and gains may owe capital-gains tax (a 1031 exchange can defer both). Figures are a year-1 estimate at your 24.0% rate — not tax advice; consult a CPA.
Schools (NCES district)
- District
- Lehighton Area SD
- NCES district ID
- 4213500
- Math proficiency
- 32% ▼ -7.00%
- Reading proficiency
- 50% ▼ -11.00%
- Median HH income
- $51,115
- Composite
- 35.36/100
- National rank
- #4958
- State rank
- #336 of 539 in PA
Livability — Lehighton
- Score
- 77/100
- State rank
- #321
- US rank
- #2848
Category grades
Schools grade is shown separately in the Schools card above.
Census & demographics
- Census place
- Lehighton, PA
- Population (ZIP)
- 19,121
Population outlook (Carbon County) Hauer SSP2
- Today (2025)
- 61,643 people
- By 2030
- 59,840 · -2.9%
- By 2040
- 55,413 · -10.1%
- By 2050
- 50,843 · -17.5%
- By 2075
- 43,326 · -29.7%
- By 2100
- 37,126 · -39.8%
Race, ethnicity, and origin ACS 2023
- Neighborhood character
- Predominantly White (94%)
- Race & ethnicity
- White 94% Two or more races 4% Hispanic / Latino 3%
- Common ancestry
- Romanian 6% Polish 5% Iranian 3%
- Foreign-born
- 2% · Canada, China
- Languages at home
- 96% English-only · Spanish 2% Russian/Polish/Slavic 1%
Political lean MEDSL · Carbon
- 2024 margin
- Solid R (+34.8) · D 32.2% · R 67.0%
- 2008→2024 swing
- -36.7pp toward R · 2008: 1.9pp · 2024: -34.8pp
- All cycles
- 2024: R+34.8 2020: R+32.0 2016: R+34.1 2012: R+6.9 2008: D+1.9
Not yet ingested
- Civics
- —
Market trends
- HPI YoY
- ▼ -69.77%
- Current HPI
- 187.4645
- Rent YoY
- —
- Metro
- —
- State GDP YoY
- ▲ 1.68%
- F500 in state
- 34
Industry mix (Fortune 500 HQ in PA)
| Industry | F500 HQs | Revenue |
|---|---|---|
| Healthcare | 2 | $309B |
|
||
| Insurance | 2 | $27B |
|
||
| Telecommunications / Media | 1 | $124B |
|
||
| Industrial Distribution | 1 | $22B |
|
||
| Financial Services | 1 | $20B |
|
||
| Chemicals / Materials | 1 | $18B |
|
||
Price history
1 event — show timeline
- 2026-06-18 Listed $49,900 PMAR
Property tax history
+2.0%/yrLatest (2026): $1,828 · +2.3% YoY. Source: county tax records.
Cash-flow waterfall
monthlySold comps — $/sqft
last 12 mo · ≤1 miLoading sold comps…