7591 NW 167th Pl · Fanning Springs, FL
Flood risk 4/10 · Minor
- FEMA flood zone
- X (unshaded)
- Chance of flooding over 30 yrs
- 0.2%
- Est. flood insurance / yr
- $507 – $1,088
Fire risk 5/10 · Moderate
- Est. fire insurance / yr
- $947 – $1,759
Heat risk 8/10 · Major
- Hot days now (above 107°F)
- 6 days/yr
- Hot days in 30 yrs
- 19 days/yr
Wind risk 9/10 · Severe
- Chance of severe wind over 30 yrs
- 99.0%
Air-quality risk 2/10 · Minimal
- Unhealthy air days now
- 2 days/yr
- Unhealthy air days in 30 yrs
- 2 days/yr
Risk factors via First Street. Map © Google.
Why this score? — see what drove the C+ grade
The composite is a weighted blend of 9 inputs, each scored 0–100. Each bar is that input's sub-score; the figure is the points it added to the 100-point composite (weight × sub-score).
- Cash flow +20.3/30.0
- Appreciation +10.0/10.0
- ARV discount +7.5/15.0
- DSCR +6.4/10.0
- 1% rule +5.0/10.0
- Schools +3.6/10.0
- Livability +3.2/5.0
- Rent growth +2.5/5.0
- Condition / age +2.5/5.0
$147,000
🖨 Deal sheet 📄 Offer letter ✓ Due diligence
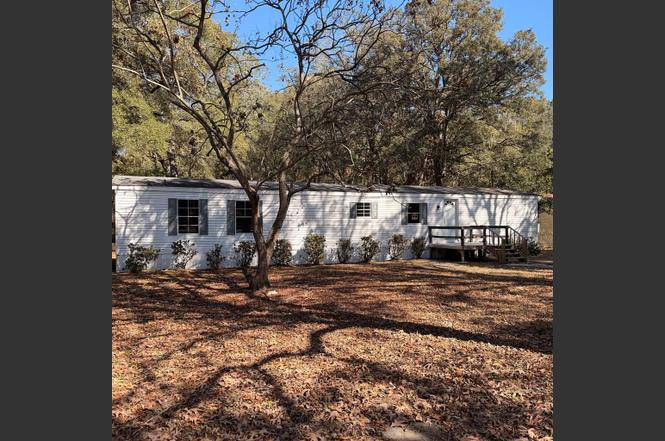
Listing remarks
Opportunity awaits in Trenton, Florida! This 2-bedroom, 2-bath manufactured single-wide sits on a spacious 0.7-acre lot, offering privacy, flexibility, and room to enjoy North Florida living. This home provides an open and inviting floor plan where the living room flows seamlessly into the kitchen. Once there, you can enjoy the views of the picture-perfect front yard while preparing your meals. The master bedroom includes a large closet, plenty of space for a king size bed, and two windows to enjoy the views the property has to offer. The master bathroom is complete with a tub/shower combo, a single sink, and plenty of additional room to add your own vanity or additional sink. On the other
Key facts
- Open floor plan
- Fresh paint
- Newer deck
Tags
Neighborhood map
What this means for you Summary
Snapshot
- This is a 2-bed/2.0-bath manufactured listed at $147k.
Deal economics
- At list price, monthly cash flow is $187 ($2k/yr) — positive.
- The deal already cash-flows at list — no discount required.
- Meets the 1% rule at list price ($1k rent vs $147k).
- Recommended offer: $143k (3.0% below list) — sets the bar for market timing.
- Cap rate 7.8% vs local median 3.7% in Fanning Springs — top-decile yield for the area; either an underpriced asset or a hidden risk that comps aren't pricing in. Stress-test before assuming the spread holds.
Location & tenants
- Location reads 63/100 on livability (#739 in FL) — a middle-class / working-renter tenant base. Strengths: crime A+, cost of living A+, housing A+; Watch: health & safety D, schools F, amenities F.
- Levy (rural): math 45% / reading 43% proficiency, ranked #54 of 73 in FL (top 74%) — families likely to look elsewhere, expect single-tenant / working-renter base with shorter leases; 62% free/reduced lunch — lower-income household profile, screen leases tightly.
- Market conditions: 199 active listings in the ZIP; 199 units permitted in Levy County in 2024 (0 in 5+ unit buildings).
Forward outlook
- In year one you build about $16k of equity ($1k loan paydown + $15k appreciation (10.0% local appreciation)).
- Levy County population projected at -28% by 2050 — secular population decline; favor cash flow + early exit over multi-decade hold.
- At projected returns (10.0% appreciation + 3.0% rent growth), your $41k cash investment doubles in ~3 years — after that, you're playing with house money.
- By year 3, paydown + projected appreciation supports a ~$40k cash-out refi (75% LTV) — recoverable capital for the next deal without selling this one.
Negotiation context
- It's been on market 48 days — a 3% lower offer ($143k) is reasonable based on typical stale-listing flexibility.
- 9 sale attempts since 4y ago with the ask held roughly flat each time — persistent listings suggest the price (not the market) is what's stuck; bring a comps-based counter.
- Current owner paid $36k; list at $147k implies a 313% gain — meaningful room to come down on a strong offer.
Risks & watch-outs
- Climate carrying-cost: severe wind risk, 99% chance of damaging wind over 30y; moderate wildfire risk; extreme-heat days projected 6→19/yr by 2055 (HVAC capex compounding) — expect insurance premiums to compound above CPI over the hold.
Questions for the listing agent
- It's been on market 48 days. Have you received any prior offers? Is the seller open to a 3% concession, seller financing, or rate buy-down credit?
- Is there a deadline driving the sale (1031 exchange, divorce, estate, relocation)? That informs how much negotiation room exists.
- Schools are F-rated, which usually means shorter tenancies and higher turnover. Who's the typical renter profile here, and what's been the actual vacancy rate?
- What's the average days-on-market for RENTAL listings here right now (not sales)? A rising rental-DOM trend means longer vacancies and softer asking-rent achievability than the comps imply.
- What's the recent tenant-quality profile in this submarket — average credit score on applications, eviction rate, late-payment / NSF rate, and stable-employment percentage? A property-management company in the area should have these aggregated.
- How much new for-sale + rental construction is in the pipeline within 1–3 miles? Heavy new supply typically softens prices + rents 12–24 months out; constrained supply supports both.
Investment metrics
- 1% rule
- 1.00% ✓
- Cap rate
- 7.82%
- Cash-on-cash
- 5.45%
- DSCR
- 1.24
- GRM
- 8.3
CMA / ARV
- ARV (on-the-fly)
- $71,288
- Comps found
- 7
Show comp detail 7 sales within ~0.75 mi
| Address | Dist | Beds/Ba | Sqft | Sold | Price | $/sf | Match |
|---|---|---|---|---|---|---|---|
| 7591 NW 167th Pl | 0.00mi | 2/2.0 | 938 (0%) | 1mo | $145,000 | $155 | 99 |
| 7950 NW 170th St | 0.41mi | 3/2.0 (+1) | 924 (-2%) | 3mo | $70,000 | $76 | 71 |
| 7311 NW 168th Ln | 0.29mi | 3/2.0 (+1) | 1,012 (+8%) | 4mo | $58,000 | $57 | 65 |
| 16690 NW 70th Ave | 0.57mi | 2/2.0 | 928 (-1%) | 13mo | $140,000 | $151 | 61 |
| 7171 NW 166th St | 0.44mi | 2/1.0 | 1,066 (+14%) | 5mo | $32,000 | $30 | 49 |
| 8271 NW 170th St | 0.74mi | 2/2.0 | 840 (-10%) | 5mo | $50,000 | $60 | 44 |
| 7070 NW 168th Ln | 0.52mi | 3/2.0 (+1) | 1,040 (+11%) | 20mo | $104,900 | $101 | 36 |
Match score weights: distance 35% · size 25% · config 20% · recency 20%. Top-matched comps best support the ARV.
Projected returns pro-forma
10.0% appreciation · 3.0% rent growth · sell at horizon
- IRR
- 28.2%
- Equity multiple
- 3.23×
- Total profit
- $91,972
- Equity at exit
- $132,429
- IRR
- 24.6%
- Equity multiple
- 7.35×
- Total profit
- $261,469
- Equity at exit
- $285,589
Cash invested: $41,160 (down + closing). Projections, not guarantees.
Landlord ↔ Tenant lean methodology
- Overall (STATE)
- 87 Strongly Landlord-Friendly
- State Florida
- 87 Strongly Landlord-Friendly · R+3
- County
- — inherits STATE
- City
- — inherits STATE
ZIP-level market 32693
- Home prices YoY
- 14.8%
- Active inventory
- 199
- Price-to-rent
- 8.3×
Monthly cashflow live
- Estimated rent
- $1,473 medium interval (Pro) →
- Mortgage (P&I)
- −$771
- Tax from tax record
- −$145 /mo · $1,737/yr
- Insurance
- −$61
- HOA
- −$0
- Vacancy / Maint / Mgmt
- −$309
- Net cashflow
- $187
Break-even live
UW: 25.0% down · 7.5% · 30yr · 1.5% tax · 5.0% vac · 8.0% maint · 8.0% mgmt
Financing live
Cash to close
- Down payment
- $36,750
- Closing costs
- $4,410
- Reserves months
- —
- Total cash needed
- —
Loan-product check · same deal, 3 products live
Conventional
25% down · 7.5% · 30yr
- Down + closing
- —
- Monthly P&I
- —
- Monthly cashflow
- —
- DSCR
- —
- Eligible?
- —
Personal DTI + credit; lowest rate.
DSCR
20% down · 8.5% · 30yr
- Down + closing
- —
- Monthly P&I
- —
- Monthly cashflow
- —
- DSCR
- —
- Eligible?
- —
No personal income docs; deal must DSCR.
Hard money
10% down · 12.0% · 12mo
- Down + closing
- —
- Monthly P&I
- —
- Monthly cashflow
- —
- DSCR
- —
- Eligible?
- —
Short-term bridge; refi at stabilization.
Listing history 26 events
-
2026-04-02status Pending
-
2026-02-13$147,000 Active
-
2026-02-12historical
-
2025-07-30status Active
-
2025-07-18status Pending
-
2025-06-21price $147,500
-
2025-05-18price $142,500
-
2025-05-02price $137,500
-
2024-08-19$142,500 Active
-
2024-01-22price $142,500
-
2023-11-20$149,900 Active
-
2023-06-08soldstatus $35,555 Closed
-
2023-05-08status Pending
-
2023-05-05price $35,000
-
2023-04-14$71,280 Active
-
2023-02-28historical
-
2023-01-03$71,280 Active
-
2022-11-30historical
-
2022-11-09status Active
-
2022-11-09price $71,280
-
2022-11-01status Active
-
2022-10-30historical
-
2022-06-30$79,200 Active
-
1999-11-01soldstatus $12,000
-
1995-03-01soldstatus $6,000
-
1993-04-01soldstatus $7,000
ⓘ Source: listings_history table (triggers on properties + properties_extension) + one-shot
backfill from property_details.listing_events for pre-trigger history.
Tax reassessment forecast FL · Resets to sale price
- Current annual tax
- $1,737 · $145/mo
- Projected year-2 tax
- $1,737 · $145/mo
- Expected delta
- $0/yr ($0/mo · 0.0%)
ⓘ Screening estimate from a state-policy table — verify with the county assessor before closing.
Climate risk First Street
- Flood 4/10 Moderate FEMA zone X (unshaded) · 20% chance over 30 yrs
- Wildfire 5/10 Major
- Heat 8/10 Severe 6 d/yr ≥107°F today · 19 d/yr by 30 yrs out
- Wind 9/10 Extreme 99% chance of damaging wind over 30 yrs
- Air quality 2/10 Low 2 unhealthy d/yr today · 2 by 30 yrs out
Nearby sold comps map
Loading sold comps map…
Walkable amenities ~0.75 mi
Loading nearby amenities…
Taxation est. · year 1
- Rental income
- $17,680
- − Mortgage interest
- −$8,234
- − Property taxes
- −$1,737
- − Insurance
- −$735
- − Repairs & maintenance
- −$1,414
- − Management
- −$1,414
- − Depreciation
- −$4,276
- Taxable loss
- −$131
- Est. tax savings @ 24.0%
- +$32
- After-tax cash flow
- $2,276/yr
For passive investors: Depreciation is non-cash, so a rental often shows a tax loss while cash-flowing — sheltering income. Rental losses are passive: they offset passive income freely, and up to $25,000/yr can offset ordinary (W-2) income if you actively participate and your MAGI is under $100k (phasing out to $0 by $150k); unused losses carry forward. On sale, claimed depreciation is recaptured at up to 25%, and gains may owe capital-gains tax (a 1031 exchange can defer both). Figures are a year-1 estimate at your 24.0% rate — not tax advice; consult a CPA.
Schools (NCES district)
- District
- Levy
- NCES district ID
- 1201140
- Math proficiency
- 45% ▼ -8.00%
- Reading proficiency
- 43% ▼ -3.00%
- Median HH income
- $35,254
- Composite
- 36.42/100
- National rank
- #4673
- State rank
- #54 of 73 in FL
Livability — Fanning Springs
- Score
- 63/100
- State rank
- #739
- US rank
- #15960
Category grades
Schools grade is shown separately in the Schools card above.
Census & demographics
- Population (ZIP)
- 11,692
Population outlook (Levy County) Hauer SSP2
- Today (2025)
- 36,536 people
- By 2030
- 34,498 · -5.6%
- By 2040
- 30,294 · -17.1%
- By 2050
- 26,368 · -27.8%
- By 2075
- 19,003 · -48.0%
- By 2100
- 13,169 · -64.0%
Race, ethnicity, and origin ACS 2023
- Neighborhood character
- Predominantly White (82%)
- Race & ethnicity
- White 82% Hispanic / Latino 8% Two or more races 7% Black 5%
- Hispanic origin (detail)
- Mexican 2% Puerto Rican 3%
- Common ancestry
- Lithuanian 4% Slovak 3% Romanian 1%
- Foreign-born
- 4% · Canada
- Languages at home
- 94% English-only · Spanish 5%
Political lean MEDSL · Levy
- 2024 margin
- Solid R (+50.3) · D 24.6% · R 74.8%
- 2008→2024 swing
- -23.3pp toward R · 2008: -26.9pp · 2024: -50.3pp
- All cycles
- 2024: R+50.3 2020: R+45.6 2016: R+44.8 2012: R+32.2 2008: R+26.9
Not yet ingested
- Civics
- —
Market trends
- HPI YoY
- ▲ 46.81%
- Current HPI
- 363.4299
- Rent YoY
- —
- Metro
- —
- State GDP YoY
- ▲ 3.28%
- F500 in state
- 36
Industry mix (Fortune 500 HQ in FL)
| Industry | F500 HQs | Revenue |
|---|---|---|
| Industrial Technology | 2 | $29B |
|
||
| Insurance | 2 | $17B |
|
||
| Retail | 1 | $60B |
|
||
| Technology Distribution | 1 | $58B |
|
||
| Homebuilding | 1 | $35B |
|
||
| Technology Manufacturing | 1 | $35B |
|
||
Price history
+2000.0% since first listed26 events — show timeline
- 2026-04-02 Pending — DGLMLS
- 2026-02-13 Listed $147,000 DGLMLS
- 2026-02-12 Listing Removed — Stellar MLS as Distributed by MLS Grid
- 2025-07-30 Relisted — Stellar MLS as Distributed by MLS Grid
- 2025-07-18 Pending — Stellar MLS as Distributed by MLS Grid
- 2025-06-21 Price Changed $147,500 Stellar MLS as Distributed by MLS Grid
- 2025-05-18 Price Changed $142,500 Stellar MLS as Distributed by MLS Grid
- 2025-05-02 Price Changed $137,500 Stellar MLS as Distributed by MLS Grid
- 2024-08-19 Listed $142,500 Stellar MLS as Distributed by MLS Grid
- 2024-01-22 Price Changed $142,500 DGLMLS
- 2023-11-20 Listed $149,900 DGLMLS
- 2023-06-08 Sold (MLS) $35,555 Stellar MLS as Distributed by MLS Grid
- 2023-05-08 Pending — Stellar MLS as Distributed by MLS Grid
- 2023-05-05 Price Changed $35,000 Stellar MLS as Distributed by MLS Grid
- 2023-04-14 Listed $71,280 Stellar MLS as Distributed by MLS Grid
- 2023-02-28 Listing Removed — Stellar MLS as Distributed by MLS Grid
- 2023-01-03 Listed $71,280 Stellar MLS as Distributed by MLS Grid
- 2022-11-30 Listing Removed — Stellar MLS as Distributed by MLS Grid
- 2022-11-09 Relisted — Stellar MLS as Distributed by MLS Grid
- 2022-11-09 Price Changed $71,280 Stellar MLS as Distributed by MLS Grid
- 2022-11-01 Relisted — Stellar MLS as Distributed by MLS Grid
- 2022-10-30 Listing Removed — Stellar MLS as Distributed by MLS Grid
- 2022-06-30 Listed $79,200 Stellar MLS as Distributed by MLS Grid
- 1999-11-01 Sold (Public Records) $12,000 Public Records
- 1995-03-01 Sold (Public Records) $6,000 Public Records
- 1993-04-01 Sold (Public Records) $7,000 Public Records
Property tax history
+19.6%/yrLatest (2025): $1,737 · +15.9% YoY. Source: county tax records.
Cash-flow waterfall
monthlySold comps — $/sqft
last 12 mo · ≤1 miLoading sold comps…