 🏷️ Likely Rental
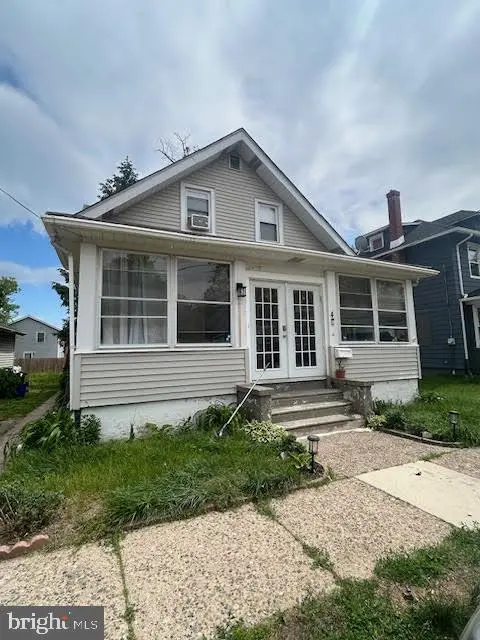
4 Russell Ave · Merchantville, NJ
Flood risk 1/10 · Minimal
- FEMA flood zone
- X (unshaded)
- Chance of flooding over 30 yrs
- 0.0%
- Est. flood insurance / yr
- $507 – $1,088
Fire risk 1/10 · Minimal
- Est. fire insurance / yr
- $526 – $976
Heat risk 6/10 · Moderate
- Hot days now (above 104°F)
- 7 days/yr
- Hot days in 30 yrs
- 15 days/yr
Wind risk 6/10 · Moderate
- Chance of severe wind over 30 yrs
- 40.0%
Air-quality risk 4/10 · Minor
- Unhealthy air days now
- 4 days/yr
- Unhealthy air days in 30 yrs
- 6 days/yr
Risk factors via First Street. Map © Google.
Why this score? — see what drove the C- grade
The composite is a weighted blend of 9 inputs, each scored 0–100. Each bar is that input's sub-score; the figure is the points it added to the 100-point composite (weight × sub-score).
- ARV discount +15.0/15.0
- Cash flow +14.4/30.0
- DSCR +4.4/10.0
- 1% rule +4.3/10.0
- Livability +4.2/5.0
- Schools +3.2/10.0
- Rent growth +2.5/5.0
- Condition / age +2.5/5.0
- Appreciation +0.0/10.0
$260,000
🖨 Deal sheet (PDF) 📄 Offer letter ✓ Due diligence
Listing remarks MLS
This property is being sold tenant occupied. Long term good paying tenant is paying $1870/mo through 3/31/2027. This is a 4 Bedroom (2 up and 2 down). - 1 Bedroom is being used as a dining room currently and has 2 full bathrooms (1 up and 1 down) Updated kitchen, hardwood floors, large basement , detached garage, front enclosed porch, and well cared for. Property being sold in as-is condition
Key facts
- Front enclosed porch
- Large basement
- Updated kitchen
Tags
Neighborhood map
What this means for you Summary
Snapshot
- This is a 4-bed/2.0-bath single-family listed at $260k.
Deal economics
- At list price, monthly cash flow is $55 ($655/yr) — positive.
- The deal already cash-flows at list — no discount required.
- To meet the 1% rule (rent ≥ 1% of price), the offer needs to be $241k (7.3% below list).
- Recommended offer: $241k (7.3% below list) — sets the bar for 1% rule.
- Cap rate 6.5% vs local median 4.2% in Merchantville — top-decile yield for the area; either an underpriced asset or a hidden risk that comps aren't pricing in. Stress-test before assuming the spread holds.
Location & tenants
- Location reads 84/100 on livability (#30 in NJ, #773 nationally) — a professional / high-income tenant draw. Strengths: employment A+, housing A+, crime A; Watch: cost of living D+.
- Merchantville School District (suburban): math 23% / reading 48% proficiency, ranked #272 of 472 in NJ (top 58%) — families likely to look elsewhere, expect single-tenant / working-renter base with shorter leases.
- Zoned schools: Merchantville Elementary School (math 23% / reading 48%, grade F, #579 of 1,303 statewide, top 44%, 377 students, 31% FRL).
- Market conditions: 77 active listings in the ZIP; 13 comparable units currently listed for rent nearby; rentals at typical pace (median 27d on market — plan ~3-4 weeks tenant-placement turnaround); solid renter incomes; 1,018 units permitted in Camden County in 2024 (509 in 5+ unit buildings).
- This rent runs 32% of the median local income ($90k/yr) — at the standard rent-burdened threshold; future hikes will face affordability resistance.
Forward outlook
- Local home prices are declining (-3.0%/yr); year-one equity from $2k of loan paydown is wiped out by about $8k of value loss. Plan a longer hold.
- Camden County population projected to shrink 8% by 2050 — rents likely to lag national; underwrite the cash flow, not the appreciation.
Negotiation context
- Only 13 days on market — expect competitive offers; lowballing is unlikely to land.
- 9 sale attempts since 27y ago with the ask held roughly flat each time — persistent listings suggest the price (not the market) is what's stuck; bring a comps-based counter.
- Current owner paid $82k; list at $260k implies a 215% gain — meaningful room to come down on a strong offer.
Risks & watch-outs
- Watch-outs: built in 1934 — expect roof / HVAC / electrical / plumbing capex.
- Climate carrying-cost: major wind risk, 40% chance of damaging wind over 30y; extreme-heat days projected 7→15/yr by 2055 (HVAC capex compounding) — expect insurance premiums to compound above CPI over the hold.
Questions for the listing agent
- Built in 1934 — when were the roof, HVAC, electrical panel, plumbing, and water heater last replaced?
- Is there a deadline driving the sale (1031 exchange, divorce, estate, relocation)? That informs how much negotiation room exists.
- What's the average days-on-market for RENTAL listings here right now (not sales)? A rising rental-DOM trend means longer vacancies and softer asking-rent achievability than the comps imply.
- What's the recent tenant-quality profile in this submarket — average credit score on applications, eviction rate, late-payment / NSF rate, and stable-employment percentage? A property-management company in the area should have these aggregated.
- How much new for-sale + rental construction is in the pipeline within 1–3 miles? Heavy new supply typically softens prices + rents 12–24 months out; constrained supply supports both.
Investment metrics
- 1% rule
- 0.93% ✗
- Cap rate
- 6.54%
- Cash-on-cash
- 0.90%
- DSCR
- 1.04
- GRM
- 9.0
CMA / ARV
- ARV (on-the-fly)
- $330,624
- Comps found
- 12
Show comp detail 12 sales within ~0.75 mi
| Address | Dist | Beds/Ba | Sqft | Sold | Price | $/sf | Match |
|---|---|---|---|---|---|---|---|
| 4766 Springfield Ave | 0.37mi | 3/1.5 (-1) | 1,200 (+4%) | 5mo | $260,000 | $217 | 65 |
| 322 Monroe Ave | 0.63mi | 4/2.0 | 1,220 (+6%) | 0mo | $430,000 | $352 | 60 |
| 217 Glenwood Ave | 0.63mi | 3/1.0 (-1) | 1,144 (-1%) | 5mo | $310,000 | $271 | 56 |
| 323 Saint James Ave | 0.52mi | 3/1.0 (-1) | 1,232 (+7%) | 7mo | $290,000 | $235 | 49 |
| 600 Jerome Ave | 0.69mi | 3/2.0 (-1) | 1,170 (+2%) | 14mo | $360,000 | $308 | 49 |
| 610 Helena Ave | 0.65mi | 4/2.0 | 1,292 (+12%) | 8mo | $371,100 | $287 | 43 |
| 513 Franklin Ave | 0.60mi | 3/1.0 (-1) | 1,058 (-8%) | 12mo | $315,000 | $298 | 40 |
| 305 Monroe Ave | 0.64mi | 3/1.0 (-1) | 1,060 (-8%) | 11mo | $305,000 | $288 | 39 |
| 5131 Elvena Ave | 0.69mi | 3/2.0 (-1) | 1,308 (+14%) | 4mo | $340,000 | $260 | 37 |
| 6722 Marion Ave | 0.66mi | 3/1.0 (-1) | 1,320 (+15%) | 2mo | $315,000 | $239 | 35 |
| 3257 N 49th St | 0.67mi | 3/1.5 (-1) | 1,274 (+11%) | 13mo | $387,000 | $304 | 33 |
| 4749 Poplar Ave | 0.73mi | 3/1.0 (-1) | 996 (-14%) | 5mo | $215,000 | $216 | 30 |
Match score weights: distance 35% · size 25% · config 20% · recency 20%. Top-matched comps best support the ARV.
Projected returns pro-forma
-3.0% appreciation · 3.0% rent growth · sell at horizon
- IRR
- -14.8%
- Equity multiple
- 0.47×
- Total profit
- $-38,587
- Equity at exit
- $38,767
- IRR
- -6.1%
- Equity multiple
- 0.60×
- Total profit
- $-28,845
- Equity at exit
- $22,480
Cash invested: $72,800 (down + closing). Projections, not guarantees.
Landlord ↔ Tenant lean methodology
- Overall (STATE)
- 21 Tenant-Leaning
- State New Jersey
- 21 Tenant-Leaning · D+6
- County
- — inherits STATE
- City
- — inherits STATE
ZIP-level market 08109
- Active inventory
- 77
- Price-to-rent
- 9.0×
Monthly cashflow live
- Estimated rent
- $2,411 high interval (Pro) →
- Mortgage (P&I)
- −$1,363
- Tax from tax record
- −$378 /mo · $4,539/yr
- Insurance
- −$108
- HOA
- −$0
- Vacancy / Maint / Mgmt
- −$506
- Net cashflow
- $55
Break-even live
Sensitivity live
| Price | -10% $202 | -5% $128 | +0% $55 | +5% $-19 | +10% $-93 |
|---|---|---|---|---|---|
| Rent | -10% $-136 | -5% $-41 | +0% $55 | +5% $150 | +10% $245 |
| Rate | -1.0pp $185 | -0.5pp $121 | base $55 | +0.5pp $-13 | +1.0pp $-81 |
UW: 25.0% down · 7.5% · 30yr · 1.5% tax · 5.0% vac · 8.0% maint · 8.0% mgmt
Financing live
Cash to close
- Down payment
- $65,000
- Closing costs
- $7,800
- Reserves months
- —
- Total cash needed
- —
Loan-product check · same deal, 3 products live
Conventional
25% down · 7.5% · 30yr
- Down + closing
- —
- Monthly P&I
- —
- Monthly cashflow
- —
- DSCR
- —
- Eligible?
- —
Personal DTI + credit; lowest rate.
DSCR
20% down · 8.5% · 30yr
- Down + closing
- —
- Monthly P&I
- —
- Monthly cashflow
- —
- DSCR
- —
- Eligible?
- —
No personal income docs; deal must DSCR.
Hard money
10% down · 12.0% · 12mo
- Down + closing
- —
- Monthly P&I
- —
- Monthly cashflow
- —
- DSCR
- —
- Eligible?
- —
Short-term bridge; refi at stabilization.
Rent comps 13 comps
| Address | Beds | Baths | Sqft | Rent | $/sqft | DOM | Units | Dist |
|---|---|---|---|---|---|---|---|---|
| 6366 Rogers Ave Unit 3 Pennsauken Township, NJ | 3.0 | 1.0 | 1100 | $2,100 | $1.91 | 26d | 1 | 0.59mi |
| 300 Monroe Ave Unit B Cherry Hill Township, NJ | 3.0 | 1.0 | 900 | $2,250 | $2.50 | 26d | 1 | 0.64mi |
| 5729 Irving Ave Pennsauken, NJ | 3.0 | 1.5 | 1200 | $2,150 | $1.79 | 18d | 1 | 0.72mi |
| 2323 Browning Rd Pennsauken, NJ | 3.0 | 1.0 | 923 | $2,500 | $2.71 | 26d | 1 | 0.88mi |
| 2277 Hollinshed Ave Pennsauken, NJ | 3.0 | 1.5 | 1164 | $2,400 | $2.06 | 26d | 1 | 0.88mi |
| 5122 Garfield Ave Pennsauken, NJ | 3.0 | 1.0 | 1308 | $2,500 | $1.91 | 26d | 1 | 0.91mi |
| 4621 Woodland Ave Pennsauken, NJ | 3.0 | 1.5 | 1148 | $2,200 | $1.92 | 26d | 1 | 1.04mi |
| 5454 Burwood Ave Pennsauken, NJ | 3.0 | 1.5 | 1419 | $2,650 | $1.87 | 7d | 1 | 1.11mi |
| 1535 Gross Ave Pennsauken, NJ | 3.0 | 1.0 | 1272 | $2,150 | $1.69 | 26d | 1 | 1.31mi |
| 106 N 34th St Unit B Camden, NJ | 3.0 | 2.0 | 900 | $1,950 | $2.17 | 26d | 1 | 1.34mi |
| 223 Breeders Cup Dr Cherry Hill, NJ | 3.0 | 2.0 | 1460 | $3,400 | $2.33 | 45d | 1 | 1.39mi |
| 2395 New Jersey Cherry Hill Township, NJ | 3.0 | 1.0–3.0 | 1050 | $3,100 | $2.95 | 1d | 15 | 1.42mi |
| 7406 Jackson Ave Pennsauken, NJ | 3.0 | 2.0 | 1344 | $2,900 | $2.16 | 19d | 1 | 1.49mi |
Listing history 32 events
-
2026-06-21status $260,000 Pending 13 DOM
-
2026-06-01statusdays on market $260,000 Active Under Contract 13 DOM
-
2026-05-31days on market $260,000 Active 12 DOM
-
2026-05-19$260,000 Active 395-char remark
Show marketing remark (395 chars)
This property is being sold tenant occupied. Long term good paying tenant is paying $1870/mo through 3/31/2027. This is a 4 Bedroom (2 up and 2 down). - 1 Bedroom is being used as a dining room currently and has 2 full bathrooms (1 up and 1 down) Updated kitchen, hardwood floors, large basement , detached garage, front enclosed porch, and well cared for. Property being sold in as-is condition
-
2014-08-28historical 762-char remark
Show marketing remark (762 chars)
Price reduced! Up to $1,000.00 Selling bonus may be available on this property! Eligibility restrictions apply. This is a Fannie Mae HomePath property. This Fannie Mae owned 4 bedroom, 2 full bath bungalow features an enclosed front porch, living room, kitchen, 2 bedrooms, & a full bath on the main level. The upper level features 2 bedrooms & a main bathroom. Other features of this property include a full basement, gas heat, rear deck, 1 car garage, gas heat, & more. Buyer is responsible for all repairs, certifications, & municipal requirements. Easy to show. Pre-qualification or proof-of-funds & Owner Occupant Certification (owner occupants only need complete) is a requirement for Seller's final acceptance. Bring offers!
-
2014-08-26soldstatus $82,500 Sold 762-char remark
Show marketing remark (762 chars)
Price reduced! Up to $1,000.00 Selling bonus may be available on this property! Eligibility restrictions apply. This is a Fannie Mae HomePath property. This Fannie Mae owned 4 bedroom, 2 full bath bungalow features an enclosed front porch, living room, kitchen, 2 bedrooms, & a full bath on the main level. The upper level features 2 bedrooms & a main bathroom. Other features of this property include a full basement, gas heat, rear deck, 1 car garage, gas heat, & more. Buyer is responsible for all repairs, certifications, & municipal requirements. Easy to show. Pre-qualification or proof-of-funds & Owner Occupant Certification (owner occupants only need complete) is a requirement for Seller's final acceptance. Bring offers!
-
2014-08-26soldstatus $82,500
Show marketing remark (762 chars)
Price reduced! Up to $1,000.00 Selling bonus may be available on this property! Eligibility restrictions apply. This is a Fannie Mae HomePath property. This Fannie Mae owned 4 bedroom, 2 full bath bungalow features an enclosed front porch, living room, kitchen, 2 bedrooms, & a full bath on the main level. The upper level features 2 bedrooms & a main bathroom. Other features of this property include a full basement, gas heat, rear deck, 1 car garage, gas heat, & more. Buyer is responsible for all repairs, certifications, & municipal requirements. Easy to show. Pre-qualification or proof-of-funds & Owner Occupant Certification (owner occupants only need complete) is a requirement for Seller's final acceptance. Bring offers!
-
2014-07-30status Under Contract 762-char remark
Show marketing remark (762 chars)
Price reduced! Up to $1,000.00 Selling bonus may be available on this property! Eligibility restrictions apply. This is a Fannie Mae HomePath property. This Fannie Mae owned 4 bedroom, 2 full bath bungalow features an enclosed front porch, living room, kitchen, 2 bedrooms, & a full bath on the main level. The upper level features 2 bedrooms & a main bathroom. Other features of this property include a full basement, gas heat, rear deck, 1 car garage, gas heat, & more. Buyer is responsible for all repairs, certifications, & municipal requirements. Easy to show. Pre-qualification or proof-of-funds & Owner Occupant Certification (owner occupants only need complete) is a requirement for Seller's final acceptance. Bring offers!
-
2014-07-29historical
-
2014-07-18price $89,900 762-char remark
Show marketing remark (762 chars)
Price reduced! Up to $1,000.00 Selling bonus may be available on this property! Eligibility restrictions apply. This is a Fannie Mae HomePath property. This Fannie Mae owned 4 bedroom, 2 full bath bungalow features an enclosed front porch, living room, kitchen, 2 bedrooms, & a full bath on the main level. The upper level features 2 bedrooms & a main bathroom. Other features of this property include a full basement, gas heat, rear deck, 1 car garage, gas heat, & more. Buyer is responsible for all repairs, certifications, & municipal requirements. Easy to show. Pre-qualification or proof-of-funds & Owner Occupant Certification (owner occupants only need complete) is a requirement for Seller's final acceptance. Bring offers!
-
2014-06-10$98,900 Active 762-char remark
Show marketing remark (762 chars)
Price reduced! Up to $1,000.00 Selling bonus may be available on this property! Eligibility restrictions apply. This is a Fannie Mae HomePath property. This Fannie Mae owned 4 bedroom, 2 full bath bungalow features an enclosed front porch, living room, kitchen, 2 bedrooms, & a full bath on the main level. The upper level features 2 bedrooms & a main bathroom. Other features of this property include a full basement, gas heat, rear deck, 1 car garage, gas heat, & more. Buyer is responsible for all repairs, certifications, & municipal requirements. Easy to show. Pre-qualification or proof-of-funds & Owner Occupant Certification (owner occupants only need complete) is a requirement for Seller's final acceptance. Bring offers!
-
2014-06-10$89,900
Show marketing remark (762 chars)
Price reduced! Up to $1,000.00 Selling bonus may be available on this property! Eligibility restrictions apply. This is a Fannie Mae HomePath property. This Fannie Mae owned 4 bedroom, 2 full bath bungalow features an enclosed front porch, living room, kitchen, 2 bedrooms, & a full bath on the main level. The upper level features 2 bedrooms & a main bathroom. Other features of this property include a full basement, gas heat, rear deck, 1 car garage, gas heat, & more. Buyer is responsible for all repairs, certifications, & municipal requirements. Easy to show. Pre-qualification or proof-of-funds & Owner Occupant Certification (owner occupants only need complete) is a requirement for Seller's final acceptance. Bring offers!
-
2014-05-31historical
-
2014-02-26$114,900
-
2013-05-24historical
-
2012-11-20$135,000
-
2006-11-30soldstatus $167,900
-
2006-10-27soldstatus $167,900
-
2006-10-02historical
-
2006-09-22$167,900
-
2002-08-22soldstatus $80,000
-
2002-07-31soldstatus $80,000
-
2002-03-12$80,000
-
2000-04-26soldstatus $74,500
-
2000-03-04soldstatus $74,500
-
2000-01-11historical
-
2000-01-06$74,500
-
1999-08-30soldstatus $32,000
-
1999-08-18historical
-
1999-08-13$32,000
-
1989-03-09soldstatus $52,400
-
1988-05-25soldstatus $49,900
ⓘ Source: listings_history table (triggers on properties + properties_extension) + one-shot
backfill from property_details.listing_events for pre-trigger history.
Tax reassessment forecast NJ · Partial reset (capped growth)
- Current annual tax
- $4,539 · $378/mo
- Projected year-2 tax
- $5,507 · $459/mo
- Expected delta
- +$967/yr (+$81/mo · 21.3%)
ⓘ Screening estimate from a state-policy table — verify with the county assessor before closing.
Climate risk First Street
- Flood 1/10 Low FEMA zone X (unshaded) · 0% chance over 30 yrs
- Wildfire 1/10 Low
- Heat 6/10 Major 7 d/yr ≥104°F today · 15 d/yr by 30 yrs out
- Wind 6/10 Major 40% chance of damaging wind over 30 yrs
- Air quality 4/10 Moderate 4 unhealthy d/yr today · 6 by 30 yrs out
Nearby sold comps map
Loading sold comps map…
Walkable amenities ~0.75 mi
Loading nearby amenities…
Taxation est. · year 1
- Rental income
- $28,931
- − Mortgage interest
- −$14,564
- − Property taxes
- −$4,539
- − Insurance
- −$1,300
- − Repairs & maintenance
- −$2,314
- − Management
- −$2,314
- − Depreciation
- −$7,564
- Taxable loss
- −$3,665
- Est. tax savings @ 24.0%
- +$880
- After-tax cash flow
- $1,534/yr
For passive investors: Depreciation is non-cash, so a rental often shows a tax loss while cash-flowing — sheltering income. Rental losses are passive: they offset passive income freely, and up to $25,000/yr can offset ordinary (W-2) income if you actively participate and your MAGI is under $100k (phasing out to $0 by $150k); unused losses carry forward. On sale, claimed depreciation is recaptured at up to 25%, and gains may owe capital-gains tax (a 1031 exchange can defer both). Figures are a year-1 estimate at your 24.0% rate — not tax advice; consult a CPA.
Schools (NCES district)
- District
- Merchantville School District
- NCES district ID
- 3409960
- Math proficiency
- 23% ▼ -24.00%
- Reading proficiency
- 48% ▼ -4.00%
- Median HH income
- $65,130
- Composite
- 32.11/100
- National rank
- #5802
- State rank
- #272 of 472 in NJ
Livability — Merchantville
- Score
- 84/100
- State rank
- #30
- US rank
- #773
Category grades
Schools grade is shown separately in the Schools card above.
Census & demographics
- Census place
- Merchantville, NJ
- County
- Camden County · 407,624 people
- City population
- 24,022
- Metro
- Philadelphia-Camden-Wilmington, PA-NJ-DE-MD
- Population (ZIP)
- 24,022
- Household income
- $90,242
- Rent vs Own
- Severe rent burden
- 874.0
Population outlook (Camden County) Hauer SSP2
- Today (2025)
- 507,964 people
- By 2030
- 502,182 · -1.1%
- By 2040
- 485,602 · -4.4%
- By 2050
- 465,630 · -8.3%
- By 2075
- 419,986 · -17.3%
- By 2100
- 369,492 · -27.3%
Race, ethnicity, and origin ACS 2023
- Neighborhood character
- Highly diverse neighborhood (Simpson 0.72)
- Race & ethnicity
- White 39% Hispanic / Latino 31% Black 18% Two or more races 11% Asian 9%
- Hispanic origin (detail)
- Puerto Rican 16% Dominican 6%
- Common ancestry
- Romanian 5% Lithuanian 1% Subsaharan African 1%
- Foreign-born
- 12% · Canada, Vietnam, China
- Languages at home
- 72% English-only · Spanish 20% Vietnamese 4% Other Indo-European 1%
Political lean MEDSL · Camden
- 2024 margin
- Strong D (+27.4) · D 63.0% · R 35.5% · Other 1.5%
- 2008→2024 swing
- -8.8pp toward R · 2008: 36.2pp · 2024: 27.4pp
- All cycles
- 2024: D+27.4 2020: D+33.5 2016: D+32.4 2012: D+36.6 2008: D+36.2
Not yet ingested
- Civics
- —
Market trends
- HPI YoY
- ▼ -197.50%
- Current HPI
- 331.3072
- Rent YoY
- —
- Metro
- Philadelphia-Camden-Wilmington, PA-NJ-DE-MD
- State GDP YoY
- ▲ 2.05%
- F500 in state
- 34
Industry mix (Fortune 500 HQ in NJ)
| Industry | F500 HQs | Revenue |
|---|---|---|
| Consumer Goods | 3 | $31B |
|
||
| Pharmaceuticals | 2 | $153B |
|
||
| Technology | 2 | $21B |
|
||
| Insurance | 2 | $20B |
|
||
| Healthcare | 2 | $19B |
|
||
| Financial Services | 1 | $70B |
|
||
Price history
+421.0% since first listed29 events — show timeline
- 2026-05-19 Listed $260,000 BRIGHT MLS
- 2014-08-28 Delisted — TREND
- 2014-08-26 Sold (MLS) $82,500 BRIGHT MLS
- 2014-08-26 Sold (MLS) $82,500 TREND
- 2014-07-30 Pending — TREND
- 2014-07-29 Listing Removed — BRIGHT MLS
- 2014-07-18 Price Changed $89,900 TREND
- 2014-06-10 Listed $89,900 BRIGHT MLS
- 2014-06-10 Listed $98,900 TREND
- 2014-05-31 Listing Removed — BRIGHT MLS
- 2014-02-26 Listed $114,900 BRIGHT MLS
- 2013-05-24 Listing Removed — BRIGHT MLS
- 2012-11-20 Listed $135,000 BRIGHT MLS
- 2006-11-30 Sold (Public Records) $167,900 Public Records
- 2006-10-27 Sold (MLS) $167,900 BRIGHT MLS
- 2006-10-02 Listing Removed — BRIGHT MLS
- 2006-09-22 Listed $167,900 BRIGHT MLS
- 2002-08-22 Sold (Public Records) $80,000 Public Records
- 2002-07-31 Sold (MLS) $80,000 BRIGHT MLS
- 2002-03-12 Listed $80,000 BRIGHT MLS
- 2000-04-26 Sold (Public Records) $74,500 Public Records
- 2000-03-04 Sold (MLS) $74,500 BRIGHT MLS
- 2000-01-11 Listing Removed — BRIGHT MLS
- 2000-01-06 Listed $74,500 BRIGHT MLS
- 1999-08-30 Sold (MLS) $32,000 BRIGHT MLS
- 1999-08-18 Listing Removed — BRIGHT MLS
- 1999-08-13 Listed $32,000 BRIGHT MLS
- 1989-03-09 Sold (Public Records) $52,400 Public Records
- 1988-05-25 Sold (Public Records) $49,900 Public Records
Property tax history
+0.9%/yrLatest (2025): $4,539 · +3.2% YoY. Source: county tax records.
Cash-flow waterfall
monthlySold comps — $/sqft
last 12 mo · ≤1 miLoading sold comps…