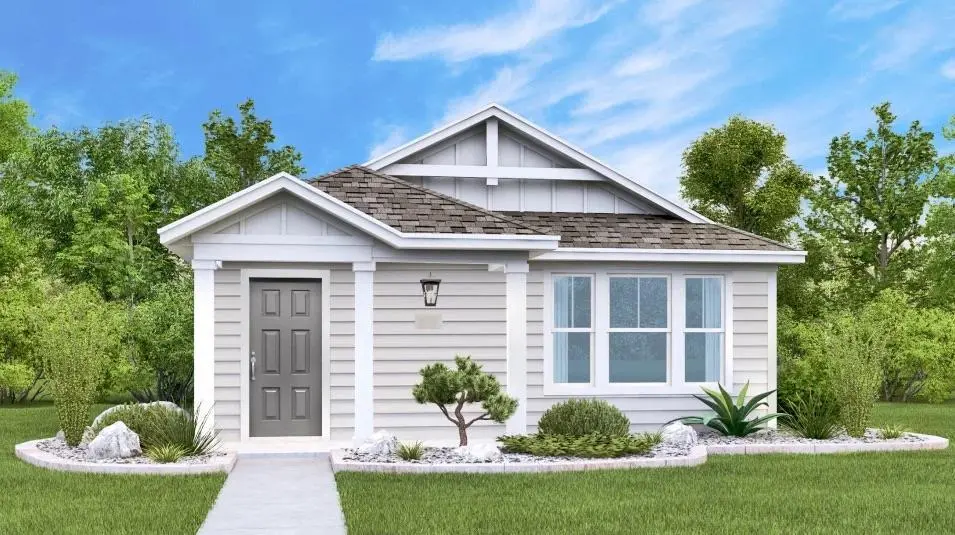
446 Sormonne Loop · Kyle, TX
Flood risk No data
- FEMA flood zone
- —
- Chance of flooding over 30 yrs
- —
- Est. flood insurance / yr
- —
Fire risk No data
- Est. fire insurance / yr
- —
Heat risk No data
- Hot days now (above threshold)
- —
- Hot days in 30 yrs
- —
Wind risk No data
- Chance of severe wind over 30 yrs
- —
Air-quality risk No data
- Unhealthy air days now
- —
- Unhealthy air days in 30 yrs
- —
Risk factors via First Street. Map © Google.
Why this score? — see what drove the C- grade
The composite is a weighted blend of 9 inputs, each scored 0–100. Each bar is that input's sub-score; the figure is the points it added to the 100-point composite (weight × sub-score).
- Cash flow +17.1/30.0
- ARV discount +11.3/15.0
- DSCR +5.3/10.0
- 1% rule +4.2/10.0
- Livability +3.8/5.0
- Schools +3.5/10.0
- Condition / age +2.5/5.0
- Rent growth +2.4/5.0
- Appreciation +0.0/10.0
$196,999
🖨 Deal sheet (PDF) 📄 Offer letter ✓ Due diligence
Listing remarks
The Montour - The family room, dining room and kitchen are arranged in a convenient open floorplan in this single-level home, offering seamless transition between spaces to help make multitasking simple. Three bedrooms complete this residence, including an owner’s suite with a private en-suite bathroom and generous walk-in closet. Prices, dimensions and features may vary and are subject to change. Photos are for illustrative purposes only. Estimated completion July 2026. The completion date, prices and features may vary and are subject to change. Please verify with Lennar directly.
Key facts
- 3,963 sq ft lot
- 2 parking spots
- Community pool
Property features AI
Finance
- HOA & community: Part of Waterstone HOA; HOA fee $60 monthly; HOA covers common area maintenance and grounds maintenance; Community amenities: clubhouse, community mailbox, fitness center, lake, playground, park, pool, trails/paths
Exterior
- Parking: 2 parking spaces
- Utilities: Electricity available; Public sewer; Public water; Sewer connected; Water connected
- Home design: Single-story home; New construction; Built by Lennar; Faces southwest
- Construction: HardiPlank type and masonry exterior; Composition roof; Slab foundation; New construction
- Exterior features: Private yard; Front porch; Privacy fencing; Community pool; Back yard; Front yard; Interior lot; Has view (southwest)
Interior
- Kitchen: Dishwasher; Range
- Bedrooms: 3 main-level bedrooms
- Flooring: Carpet; Vinyl
- Bathrooms: 2 full bathrooms
- Heating & cooling: Central heating; Central air conditioning
- Interior features: Kitchen island; Open floorplan; Main level primary suite; Walk-in closet(s); Blinds
- Laundry & utility: Dedicated laundry room
Neighborhood map
What this means for you Summary
Snapshot
- This is a 3-bed/2.0-bath land listed at $197k.
Deal economics
- At list price, monthly cash flow is $138 ($2k/yr) — positive.
- The deal already cash-flows at list — no discount required.
- To meet the 1% rule (rent ≥ 1% of price), the offer needs to be $180k (8.4% below list).
- Recommended offer: $180k (8.4% below list) — sets the bar for 1% rule.
- Cap rate 7.1% vs local median 3.3% in Kyle — top-decile yield for the area; either an underpriced asset or a hidden risk that comps aren't pricing in. Stress-test before assuming the spread holds.
Location & tenants
- Location reads 75/100 on livability (#138 in TX, #3,993 nationally) — a middle-class / working-renter tenant base. Strengths: housing A+, health & safety A+, employment A; Watch: amenities F, commute F.
- Hays CISD (rural): math 35% / reading 41% proficiency, ranked #390 of 826 in TX (top 47%) — families likely to look elsewhere, expect single-tenant / working-renter base with shorter leases.
- Zoned schools: Blanco Vista El (math 33% / reading 42%, grade F, #1,744 of 4,322 statewide, top 41%, 731 students, 58% FRL); Laura B Wallace Middle (math 31% / reading 34%, grade F, #947 of 1,662 statewide, top 58%, 789 students, 53% FRL); Lehman H S (math 20% / reading 32%, grade F, #1,234 of 1,632 statewide, top 76%, 2,120 students, 59% FRL).
- Market conditions: Rents soft (-0.3%/yr); 1820 active listings in the ZIP; 22 comparable units currently listed for rent nearby; rentals at typical pace (median 17d on market — plan ~3-4 weeks tenant-placement turnaround); solid renter incomes; 5,270 units permitted in Hays County in 2024 (1,464 in 5+ unit buildings).
Forward outlook
- Local home prices are declining (-3.0%/yr); year-one equity from $1k of loan paydown is wiped out by about $6k of value loss. Plan a longer hold.
- Hays County population projected at +93% by 2050 — long-run rental-demand tailwind backs the buy-and-hold thesis.
Negotiation context
- It's been on market 24 days — a 2% lower offer ($194k) is reasonable based on typical stale-listing flexibility.
Questions for the listing agent
- What does the HOA fee cover, when was the last increase, and are there any pending special assessments or reserve-fund shortfalls?
- Is there a deadline driving the sale (1031 exchange, divorce, estate, relocation)? That informs how much negotiation room exists.
- Schools are D-rated, which usually means shorter tenancies and higher turnover. Who's the typical renter profile here, and what's been the actual vacancy rate?
- What's the average days-on-market for RENTAL listings here right now (not sales)? A rising rental-DOM trend means longer vacancies and softer asking-rent achievability than the comps imply.
- What's the recent tenant-quality profile in this submarket — average credit score on applications, eviction rate, late-payment / NSF rate, and stable-employment percentage? A property-management company in the area should have these aggregated.
- How much new for-sale + rental construction is in the pipeline within 1–3 miles? Heavy new supply typically softens prices + rents 12–24 months out; constrained supply supports both.
Investment metrics
- 1% rule
- 0.92% ✗
- Cap rate
- 7.14%
- Cash-on-cash
- 3.01%
- DSCR
- 1.13
- GRM
- 9.1
CMA / ARV
- ARV (median comp)
- $214,990
- List price
- $196,999
- Delta
- -8.37%
- Verdict
- FAIR
- Comps
- 20 within 1.0 mi
Projected returns pro-forma
-3.0% appreciation · 0.0% rent growth · sell at horizon
- IRR
- -14.8%
- Equity multiple
- 0.48×
- Total profit
- $-28,415
- Equity at exit
- $29,373
- IRR
- -11.9%
- Equity multiple
- 0.39×
- Total profit
- $-33,903
- Equity at exit
- $17,033
Cash invested: $55,160 (down + closing). Projections, not guarantees.
Landlord ↔ Tenant lean methodology
- Overall (STATE)
- 87 Strongly Landlord-Friendly
- State Texas
- 87 Strongly Landlord-Friendly · R+5
- County
- — inherits STATE
- City
- — inherits STATE
ZIP-level market 78640
- Home prices YoY
- -33.8%
- Rents YoY
- -0.3%
- Active inventory
- 1820
- Price-to-rent
- 9.1×
Monthly cashflow live
- Estimated rent
- $1,804 high interval (Pro) →
- Mortgage (P&I)
- −$1,033
- Tax from tax record
- −$112 /mo · $1,339/yr
- Insurance
- −$82
- HOA
- −$60
- Vacancy / Maint / Mgmt
- −$379
- Net cashflow
- $138
Break-even live
Sensitivity live
| Price | -10% $250 | -5% $194 | +0% $138 | +5% $83 | +10% $27 |
|---|---|---|---|---|---|
| Rent | -10% $-4 | -5% $67 | +0% $138 | +5% $210 | +10% $281 |
| Rate | -1.0pp $238 | -0.5pp $188 | base $138 | +0.5pp $87 | +1.0pp $35 |
UW: 25.0% down · 7.5% · 30yr · 1.5% tax · 5.0% vac · 8.0% maint · 8.0% mgmt
Financing live
Cash to close
- Down payment
- $49,250
- Closing costs
- $5,910
- Reserves months
- —
- Total cash needed
- —
Loan-product check · same deal, 3 products live
Conventional
25% down · 7.5% · 30yr
- Down + closing
- —
- Monthly P&I
- —
- Monthly cashflow
- —
- DSCR
- —
- Eligible?
- —
Personal DTI + credit; lowest rate.
DSCR
20% down · 8.5% · 30yr
- Down + closing
- —
- Monthly P&I
- —
- Monthly cashflow
- —
- DSCR
- —
- Eligible?
- —
No personal income docs; deal must DSCR.
Hard money
10% down · 12.0% · 12mo
- Down + closing
- —
- Monthly P&I
- —
- Monthly cashflow
- —
- DSCR
- —
- Eligible?
- —
Short-term bridge; refi at stabilization.
Rent comps 22 comps
| Address | Beds | Baths | Sqft | Rent | $/sqft | DOM | Units | Dist |
|---|---|---|---|---|---|---|---|---|
| 190 Sormonne Loop Kyle, TX | 3.0 | 2.0 | 1450 | $1,650 | $1.14 | 25d | 1 | 0.17mi |
| 126 Avre Loop Kyle, TX | 3.0 | 2.0 | 1230 | $1,700 | $1.38 | 45d | 1 | 0.42mi |
| 149 Red Sun Dr Kyle, TX | 3.0 | 2.0 | 1421 | $1,850 | $1.30 | 12d | 1 | 0.46mi |
| 160 Night Sky Dr Kyle, TX | 3.0 | 2.0 | 1410 | $1,800 | $1.28 | 6d | 1 | 0.76mi |
| 185 Voss Kyle, TX | 3.0 | 2.0 | 1371 | $1,800 | $1.31 | 13d | 1 | 0.98mi |
| 232 Voss Kyle, TX | 3.0 | 2.0 | 1467 | $1,895 | $1.29 | 6d | 1 | 1.04mi |
| 261 New Bridge Dr Kyle, TX | 4.0 | 2.0 | 1368 | $1,849 | $1.35 | 45d | 1 | 1.11mi |
| 240 New Country Rd Kyle, TX | 3.0 | 2.0 | 1106 | $1,650 | $1.49 | 13d | 1 | 1.11mi |
| 240 New Country Rd Kyle, TX | 3.0 | 2.0 | 1106 | $1,650 | $1.49 | 3d | 1 | 1.11mi |
| 125 Voyager Cv Kyle, TX | 3.0 | 2.0 | 1476 | $1,800 | $1.22 | 45d | 1 | 1.12mi |
| 376 Musgrav Kyle, TX | 3.0 | 2.0 | 1476 | $1,890 | $1.28 | 0d | 1 | 1.17mi |
| 376 Musgrav Kyle, TX | 3.0 | 2.0 | 1476 | $1,988 | $1.35 | 18d | 1 | 1.17mi |
| 187 Rummel Dr Kyle, TX | 3.0 | 2.0 | 1240 | $1,795 | $1.45 | 45d | 1 | 1.17mi |
| 510 New Bridge Dr Kyle, TX | 4.0 | 2.0 | 1359 | $1,695 | $1.25 | 45d | 1 | 1.32mi |
| 185 Creekside Villa Dr Kyle, TX | 3.0 | 2.5 | 1463 | $1,700 | $1.16 | 16d | 1 | 1.33mi |
| 155 Creekside Villa Dr Kyle, TX | 3.0 | 2.0 | 1266 | $1,695 | $1.34 | 25d | 1 | 1.35mi |
| 155 Creekside Villa Dr Kyle, TX | 3.0 | 2.0 | 1266 | $1,695 | $1.34 | 6d | 1 | 1.35mi |
| 155 Creekside Villa Dr Kyle, TX | 3.0 | 2.0 | 1266 | $1,495 | $1.18 | 16d | 1 | 1.35mi |
| 149 Creekside Villa Dr Kyle, TX | 3.0 | 2.0 | 1266 | $1,495 | $1.18 | 16d | 1 | 1.35mi |
| 273 Tower Dr Kyle, TX | 3.0 | 2.0 | 1252 | $1,795 | $1.43 | 19d | 1 | 1.36mi |
| 141 Opal Ln Kyle, TX | 3.0 | 1.0–2.0 | 886 | $2,000 | $2.26 | 0d | 92 | 1.43mi |
| 526 Harvest Moon Pkwy Kyle, TX | 3.0–4.0 | 2.0–3.0 | 1624 | $1,399 | $0.86 | 3d | 1 | 1.44mi |
HOA detail
- Monthly dues
- $60 · $720/yr
Listing history 6 events
-
2026-05-16status Pending 594-char remark
-
2026-05-06price $196,999 594-char remark
-
2026-05-04price $203,999 594-char remark
-
2026-04-29price $207,999 594-char remark
-
2026-04-27price $205,999 594-char remark
-
2026-04-22$215,999 Active 594-char remark
ⓘ Source: listings_history table (triggers on properties + properties_extension) + one-shot
backfill from property_details.listing_events for pre-trigger history.
Tax reassessment forecast TX · Resets to sale price
- Current annual tax
- $1,339 · $112/mo
- Projected year-2 tax
- $3,605 · $300/mo
- Expected delta
- +$2,267/yr (+$189/mo · 169.3%)
ⓘ Screening estimate from a state-policy table — verify with the county assessor before closing.
Nearby sold comps map
Loading sold comps map…
Walkable amenities ~0.75 mi
Loading nearby amenities…
Taxation est. · year 1
- Rental income
- $21,647
- − Mortgage interest
- −$11,035
- − Property taxes
- −$1,339
- − Insurance
- −$985
- − Repairs & maintenance
- −$1,732
- − Management
- −$1,732
- − HOA
- −$720
- − Depreciation
- −$5,731
- Taxable loss
- −$1,626
- Est. tax savings @ 24.0%
- +$390
- After-tax cash flow
- $2,051/yr
For passive investors: Depreciation is non-cash, so a rental often shows a tax loss while cash-flowing — sheltering income. Rental losses are passive: they offset passive income freely, and up to $25,000/yr can offset ordinary (W-2) income if you actively participate and your MAGI is under $100k (phasing out to $0 by $150k); unused losses carry forward. On sale, claimed depreciation is recaptured at up to 25%, and gains may owe capital-gains tax (a 1031 exchange can defer both). Figures are a year-1 estimate at your 24.0% rate — not tax advice; consult a CPA.
Schools (NCES district)
- District
- Hays CISD
- NCES district ID
- 4800010
- Math proficiency
- 35% ▼ -15.00%
- Reading proficiency
- 41% ▼ -5.00%
- Median HH income
- $70,570
- Composite
- 34.78/100
- National rank
- #5118
- State rank
- #390 of 826 in TX
Livability — Kyle
- Score
- 75/100
- State rank
- #138
- US rank
- #3993
Category grades
Schools grade is shown separately in the Schools card above.
Census & demographics
- County
- Hays County · 280,138 people
- City population
- 77,531
- Metro
- Austin-Round Rock-Georgetown, TX
- Population (ZIP)
- 77,531
- Household income
- $90,075
- Rent vs Own
- Severe rent burden
- 2552.0
Population outlook (Hays County) Hauer SSP2
- Today (2025)
- 286,948 people
- By 2030
- 336,923 · +17.4%
- By 2040
- 441,894 · +54.0%
- By 2050
- 553,462 · +92.9%
- By 2075
- 838,261 · +192.1%
- By 2100
- 1,063,658 · +270.7%
Race, ethnicity, and origin ACS 2023
- Neighborhood character
- Diverse neighborhood (Simpson 0.56)
- Race & ethnicity
- Hispanic / Latino 55% White 36% Two or more races 29% Black 5% Native American 1%
- Hispanic origin (detail)
- Mexican 47% Puerto Rican 1%
- Common ancestry
- Italian 2% Slovak 2% Lithuanian 1%
- Foreign-born
- 13% · Canada
- Languages at home
- 63% English-only · Spanish 35%
Political lean MEDSL · Hays
- 2024 margin
- Lean D (+5.7) · D 52.1% · R 46.5% · Other 1.4%
- 2008→2024 swing
- +7.7pp toward D · 2008: -2.0pp · 2024: 5.7pp
- All cycles
- 2024: D+5.7 2020: D+10.8 2016: R+0.9 2012: R+10.4 2008: R+2.0
Not yet ingested
- Civics
- —
Market trends
- HPI YoY
- ▼ -92.64%
- Current HPI
- 181.7969
- Rent YoY
- ▼ -0.34%
- Metro
- Austin-Round Rock-Georgetown, TX
- State GDP YoY
- ▲ 3.95%
- F500 in state
- 110
Industry mix (Fortune 500 HQ in TX)
| Industry | F500 HQs | Revenue |
|---|---|---|
| Energy | 16 | $1,198B |
|
||
| Technology | 5 | $198B |
|
||
| Engineering / Construction | 4 | $72B |
|
||
| Energy Services | 3 | $60B |
|
||
| Utilities | 3 | $41B |
|
||
| Healthcare | 2 | $330B |
|
||
Price history
-8.8% since first listed6 events — show timeline
- 2026-05-16 Pending — Unlock MLS
- 2026-05-06 Price Changed $196,999 Unlock MLS
- 2026-05-04 Price Changed $203,999 Unlock MLS
- 2026-04-29 Price Changed $207,999 Unlock MLS
- 2026-04-27 Price Changed $205,999 Unlock MLS
- 2026-04-22 Listed $215,999 Unlock MLS
Property tax history
+41.1%/yrLatest (2025): $1,339 · +41.1% YoY. Source: county tax records.
Cash-flow waterfall
monthlySold comps — $/sqft
last 12 mo · ≤1 miLoading sold comps…