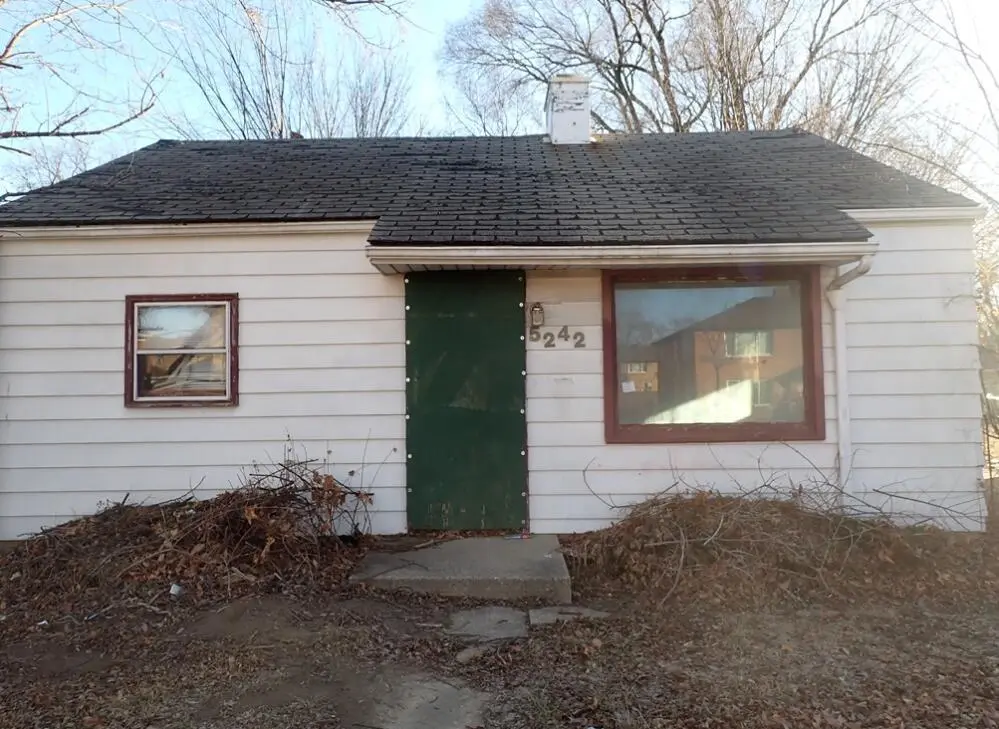
5242 N 29th St · Milwaukee, WI
Flood risk 5/10 · Moderate
- FEMA flood zone
- X (unshaded)
- Chance of flooding over 30 yrs
- 0.6%
- Est. flood insurance / yr
- $507 – $1,088
Fire risk 1/10 · Minimal
- Est. fire insurance / yr
- $636 – $1,182
Heat risk 2/10 · Minimal
- Hot days now (above 98°F)
- 7 days/yr
- Hot days in 30 yrs
- 13 days/yr
Wind risk 2/10 · Minimal
- Chance of severe wind over 30 yrs
- —
Air-quality risk 3/10 · Minor
- Unhealthy air days now
- 3 days/yr
- Unhealthy air days in 30 yrs
- 4 days/yr
Risk factors via First Street. Map © Google.
Why this score? — see what drove the D grade
The composite is a weighted blend of 9 inputs, each scored 0–100. Each bar is that input's sub-score; the figure is the points it added to the 100-point composite (weight × sub-score).
- Cash flow +15.0/30.0
- ARV discount +7.5/15.0
- 1% rule +5.0/10.0
- DSCR +5.0/10.0
- Rent growth +4.7/5.0
- Livability +4.0/5.0
- Condition / age +2.5/5.0
- Schools +1.2/10.0
- Appreciation +0.0/10.0
$23,750
🖨 Deal sheet 📄 Offer letter ✓ Due diligence
Listing remarks MLS
This is a tax foreclosed property. For the first 30-days of the listing period, no offers below the listing price will be considered per Wisconsin Foreclosure Law. Owner Occupants ONLY. BIDS DUE May 18th, 2026 AT 10:00am
Key facts
- 5,662 sq ft lot
- Built 1951
- Listed 8 days
Property features AI
Exterior
- Utilities: Municipal water; Municipal sewer
- Home design: Single-family, one-story home; Zoned RS6; Property located in Milwaukee city
- Construction: Less than 1/2 acre lot (approximately 0.13 acre); Year built from assessor/public record
- Exterior features: Aluminum and vinyl exterior
Interior
- Kitchen: Main-level kitchen (10 x 10)
- Bedrooms: Main-level master bedroom (10 x 10); Main-level additional living area (living room 10 x 10)
- Bathrooms: 1 full bathroom
- Heating & cooling: Forced air heating (natural gas)
- Interior features: Full basement
- Laundry & utility: Natural gas forced air heating
Neighborhood map
What this means for you Summary
Snapshot
- This is a 3-bed/1.0-bath single-family listed at $24k.
Deal economics
- At list price, monthly cash flow is $1k ($12k/yr) — positive.
- The deal already cash-flows at list — no discount required.
- Meets the 1% rule at list price ($1k rent vs $24k).
- Cap rate 57.0% vs local median 5.1% in Milwaukee — top-decile yield for the area; either an underpriced asset or a hidden risk that comps aren't pricing in. Stress-test before assuming the spread holds.
Location & tenants
- Location reads 81/100 on livability (#55 in WI, #1,534 nationally) — a professional / high-income tenant draw. Strengths: amenities A+, commute A+, cost of living A+; Watch: employment D+, schools F, crime F.
- Milwaukee School District (urban): math 10% / reading 18% proficiency, ranked #337 of 342 in WI (top 98%) — low school quality limits family demand, transient renter base, plan for 1-2y turnover; 77% free/reduced lunch — lower-income household profile, screen leases tightly.
- Market conditions: Rents rising fast (+8.6%/yr); 168 active listings in the ZIP; 25 comparable units currently listed for rent nearby; rentals at typical pace (median 24d on market — plan ~3-4 weeks tenant-placement turnaround); 1,017 units permitted in Milwaukee County in 2024 (803 in 5+ unit buildings).
- This rent runs 37% of the median local income ($48k/yr) — at the standard rent-burdened threshold; future hikes will face affordability resistance.
Forward outlook
- Local home prices are declining (-3.0%/yr); year-one equity from $164 of loan paydown is wiped out by about $712 of value loss. Plan a longer hold.
- Milwaukee County population projected at +4% by 2050 — modest demand growth; plan on rents tracking national, not racing it.
- At projected returns (-3.0% appreciation + 8.0% rent growth), your $7k cash investment doubles in ~1 year — after that, you're playing with house money.
Negotiation context
- Only 8 days on market — expect competitive offers; lowballing is unlikely to land.
- 3 sale attempts since 12y ago with the ask held roughly flat each time — persistent listings suggest the price (not the market) is what's stuck; bring a comps-based counter.
Risks & watch-outs
- Watch-outs: built in 1951 — expect roof / HVAC / electrical / plumbing capex.
- Climate carrying-cost: moderate flood risk — expect insurance premiums to compound above CPI over the hold.
Questions for the listing agent
- Built in 1951 — when were the roof, HVAC, electrical panel, plumbing, and water heater last replaced?
- Is there a deadline driving the sale (1031 exchange, divorce, estate, relocation)? That informs how much negotiation room exists.
- Schools are F-rated, which usually means shorter tenancies and higher turnover. Who's the typical renter profile here, and what's been the actual vacancy rate?
- Crime grade is F in this area — have there been break-ins, vandalism, or insurance claims at this property in the last 3 years? What carrier currently insures it and at what premium?
- The area grade is low — what's the realistic commute time and amenity access for the typical tenant pool here? Any planned neighborhood developments (good or bad) we should know about?
- What's the average days-on-market for RENTAL listings here right now (not sales)? A rising rental-DOM trend means longer vacancies and softer asking-rent achievability than the comps imply.
- What's the recent tenant-quality profile in this submarket — average credit score on applications, eviction rate, late-payment / NSF rate, and stable-employment percentage? A property-management company in the area should have these aggregated.
- How much new for-sale + rental construction is in the pipeline within 1–3 miles? Heavy new supply typically softens prices + rents 12–24 months out; constrained supply supports both.
Investment metrics
- 1% rule
- 6.22% ✓
- Cap rate
- 57.00%
- Cash-on-cash
- 181.09%
- DSCR
- 9.06
- GRM
- 1.3
CMA / ARV
- ARV (median comp)
- $123,494
- List price
- $23,750
- Delta
- -74.98%
- Verdict
- UNDERPRICED
- Comps
- 20 within 1.0 mi
Show comp detail 12 sales within ~0.75 mi
| Address | Dist | Beds/Ba | Sqft | Sold | Price | $/sf | Match |
|---|---|---|---|---|---|---|---|
| 2709 W Villard Ave | 0.12mi | 2/1.0 (-1) | 1,059 (-2%) | 0mo | $143,000 | $135 | 86 |
| 5281 N Teutonia Ave | 0.11mi | 3/1.0 | 1,012 (-6%) | 2mo | $60,000 | $59 | 83 |
| 2240 W Lawn Ave | 0.45mi | 3/1.5 | 1,082 (+0%) | 3mo | $215,000 | $199 | 75 |
| 5062 N 20th St | 0.66mi | 3/1.0 | 1,082 (+0%) | 1mo | $181,300 | $168 | 68 |
| 4946 N 26th St | 0.40mi | 3/1.0 | 982 (-9%) | 3mo | $164,000 | $167 | 64 |
| 4858 N 26th St | 0.52mi | 3/1.5 | 972 (-10%) | 1mo | $120,000 | $123 | 56 |
| 5565 N 32nd St | 0.46mi | 2/1.0 (-1) | 966 (-11%) | 3mo | $100,000 | $104 | 54 |
| 5525 N Long Island Dr | 0.59mi | 3/1.0 | 963 (-11%) | 3mo | $140,000 | $145 | 52 |
| 3733 W Fairmount Ave | 0.66mi | 2/1.0 (-1) | 1,000 (-7%) | 1mo | $100,000 | $100 | 51 |
| 4825 N 25th St | 0.57mi | 3/1.0 | 936 (-13%) | 2mo | $188,000 | $201 | 49 |
| 5549 N 33rd St | 0.48mi | 3/2.5 | 1,241 (+15%) | 3mo | $176,000 | $142 | 44 |
| 5730 N 35th St | 0.74mi | 2/1.0 (-1) | 1,216 (+13%) | 4mo | $162,000 | $133 | 36 |
Match score weights: distance 35% · size 25% · config 20% · recency 20%. Top-matched comps best support the ARV.
Projected returns pro-forma
-3.0% appreciation · 8.0% rent growth · sell at horizon
- IRR
- —
- Equity multiple
- 11.21×
- Total profit
- $67,901
- Equity at exit
- $3,541
- IRR
- —
- Equity multiple
- 27.63×
- Total profit
- $177,071
- Equity at exit
- $2,053
Cash invested: $6,650 (down + closing). Projections, not guarantees.
Landlord ↔ Tenant lean methodology
- Overall (STATE)
- 73 Landlord-Friendly
- State Wisconsin
- 73 Landlord-Friendly · R+2
- County
- — inherits STATE
- City
- — inherits STATE
ZIP-level market 53209
- Rents YoY
- 8.6%
- Active inventory
- 168
- Price-to-rent
- 1.3×
Monthly cashflow live
- Estimated rent
- $1,478 high interval (Pro) →
- Mortgage (P&I)
- −$125
- Tax est. 1.5%
- −$30 /mo · $356/yr
- Insurance
- −$10
- HOA
- −$0
- Vacancy / Maint / Mgmt
- −$310
- Net cashflow
- $1,004
Break-even live
UW: 25.0% down · 7.5% · 30yr · 1.5% tax · 5.0% vac · 8.0% maint · 8.0% mgmt
Financing live
Cash to close
- Down payment
- $5,938
- Closing costs
- $712
- Reserves months
- —
- Total cash needed
- —
Loan-product check · same deal, 3 products live
Conventional
25% down · 7.5% · 30yr
- Down + closing
- —
- Monthly P&I
- —
- Monthly cashflow
- —
- DSCR
- —
- Eligible?
- —
Personal DTI + credit; lowest rate.
DSCR
20% down · 8.5% · 30yr
- Down + closing
- —
- Monthly P&I
- —
- Monthly cashflow
- —
- DSCR
- —
- Eligible?
- —
No personal income docs; deal must DSCR.
Hard money
10% down · 12.0% · 12mo
- Down + closing
- —
- Monthly P&I
- —
- Monthly cashflow
- —
- DSCR
- —
- Eligible?
- —
Short-term bridge; refi at stabilization.
Rent comps 25 comps
| Address | Beds | Baths | Sqft | Rent | $/sqft | DOM | Units | Dist |
|---|---|---|---|---|---|---|---|---|
| 5237 N 34th St Unit 5237 Lower Milwaukee, WI | 2.0 | 1.0 | 956 | $1,350 | $1.41 | 23d | 1 | 0.33mi |
| 5032 N 32nd St Milwaukee, WI | 3.0 | 2.0 | 1089 | $1,750 | $1.61 | 12d | 1 | 0.33mi |
| 5541 N 35th St #5543 Milwaukee, WI | 3.0 | 1.0 | 1130 | $1,195 | $1.06 | 4d | 1 | 0.54mi |
| 5435 N 40th St Milwaukee, WI | 2.0 | 1.0 | 850 | $1,150 | $1.35 | 17d | 1 | 0.73mi |
| 5884 N 35th St Milwaukee, WI | 2.0 | 1.0 | 1200 | $1,500 | $1.25 | 43d | 1 | 0.88mi |
| 4651 N 36th St #4 Milwaukee, WI | 2.0 | 1.0 | 747 | $945 | $1.27 | 23d | 1 | 0.89mi |
| 4334 W Eggert Pl Milwaukee, WI | 4.0 | 1.0 | 1077 | $1,695 | $1.57 | 23d | 1 | 0.95mi |
| 4661 N 38th St Unit 4661 Milwaukee, WI | 2.0 | 1.0 | 1000 | $845 | $0.84 | 14d | 1 | 0.95mi |
| 4340 W Eggert Pl Milwaukee, WI | 4.0 | 1.0 | 1066 | $1,695 | $1.59 | 23d | 1 | 0.96mi |
| 5696 N 42nd St Milwaukee, WI | 4.0 | 1.0 | 1023 | $1,495 | $1.46 | 23d | 1 | 0.97mi |
| 5165-5167 N 45th St Unit 5165 Milwaukee, WI | 3.0 | 1.0 | 1020 | $1,200 | $1.18 | 17d | 1 | 1.03mi |
| 4610 W Eggert Pl #4612 Milwaukee, WI | 3.0 | 1.0 | 852 | $1,095 | $1.29 | 23d | 1 | 1.10mi |
| 5050 N 47th St Milwaukee, WI | 2.0 | 1.0 | 1092 | $1,700 | $1.56 | 43d | 1 | 1.14mi |
| 4355 N 28th St Milwaukee, WI | 2.0 | 1.0 | 1118 | $975 | $0.87 | 21d | 1 | 1.14mi |
| 4702 N 44th St Milwaukee, WI | 3.0 | 2.0 | 1050 | $1,850 | $1.76 | 43d | 1 | 1.19mi |
| 5073 N 48th St Milwaukee, WI | 4.0 | 1.0 | 1152 | $1,595 | $1.38 | 14d | 1 | 1.23mi |
| 4703 N 45th St Milwaukee, WI | 3.0 | 1.0 | 1031 | $1,695 | $1.64 | 23d | 1 | 1.26mi |
| 6110 N 39th St Milwaukee, WI | 2.0 | 1.0 | 703 | $1,395 | $1.98 | 4d | 1 | 1.27mi |
| 3931 W Kaul Ave Milwaukee, WI | 3.0 | 1.0 | 1400 | $1,695 | $1.21 | 43d | 1 | 1.27mi |
| 4852 N 48th St Unit 4852 Milwaukee, WI | 2.0 | 1.0 | 830 | $995 | $1.20 | 2d | 1 | 1.28mi |
| 4727 N 46th St Milwaukee, WI | 3.0 | 1.0 | 936 | $1,700 | $1.82 | 43d | 1 | 1.29mi |
| 6148 N 39th St Milwaukee, WI | 2.0 | 1.0 | 792 | $1,175 | $1.48 | 43d | 1 | 1.31mi |
| 4227 N 26th St Milwaukee, WI | 2.0 | 1.0 | 950 | $1,000 | $1.05 | 17d | 1 | 1.36mi |
| 4479A N 44th St Milwaukee, WI | 2.0 | 1.0 | 1000 | $895 | $0.90 | 43d | 1 | 1.39mi |
| 1633 W Bender Rd Apt 11C Glendale, WI | 2.0 | 2.0 | 1000 | $1,725 | $1.73 | 23d | 1 | 1.43mi |
Listing history 11 events
-
2026-06-18days on market $23,750 Active 8 DOM
-
2026-06-17days on market $23,750 Active 7 DOM
-
2026-06-16days on market $23,750 Active 6 DOM
-
2026-06-15days on market $23,750 Active 5 DOM
-
2026-06-13days on market $23,750 Active 3 DOM
-
2026-06-13pricestatusdays on market $23,750 Active 2 DOM
-
2026-04-13$30,900 Active 220-char remark
Show marketing remark (220 chars)
This is a tax foreclosed property. For the first 30-days of the listing period, no offers below the listing price will be considered per Wisconsin Foreclosure Law. Owner Occupants ONLY. BIDS DUE May 18th, 2026 AT 10:00am
-
2014-09-25historical 227-char remark
Show marketing remark (227 chars)
Wow! What a great value! Come on in an see this HomePath stairless ranch. You will be invited on in by the simple layout and natural lighting throughout the home. Home has large 2 car detached garage for all your storage needs.
-
2014-09-04$19,900 Active 227-char remark
Show marketing remark (227 chars)
Wow! What a great value! Come on in an see this HomePath stairless ranch. You will be invited on in by the simple layout and natural lighting throughout the home. Home has large 2 car detached garage for all your storage needs.
-
2007-07-12soldstatus $78,000
-
1996-02-01soldstatus $33,000
ⓘ Source: listings_history table (triggers on properties + properties_extension) + one-shot
backfill from property_details.listing_events for pre-trigger history.
Climate risk First Street
- Flood 5/10 Major FEMA zone X (unshaded) · 60% chance over 30 yrs
- Wildfire 1/10 Low
- Heat 2/10 Low 7 d/yr ≥98°F today · 13 d/yr by 30 yrs out
- Wind 2/10 Low
- Air quality 3/10 Moderate 3 unhealthy d/yr today · 4 by 30 yrs out
Nearby sold comps map
Loading sold comps map…
Walkable amenities ~0.75 mi
Loading nearby amenities…
Taxation est. · year 1
- Rental income
- $17,737
- − Mortgage interest
- −$1,330
- − Property taxes
- −$356
- − Insurance
- −$119
- − Repairs & maintenance
- −$1,419
- − Management
- −$1,419
- − Depreciation
- −$691
- Taxable income
- $12,403
- Est. tax owed @ 24.0%
- −$2,977
- After-tax cash flow
- $9,066/yr
For passive investors: Depreciation is non-cash, so a rental often shows a tax loss while cash-flowing — sheltering income. Rental losses are passive: they offset passive income freely, and up to $25,000/yr can offset ordinary (W-2) income if you actively participate and your MAGI is under $100k (phasing out to $0 by $150k); unused losses carry forward. On sale, claimed depreciation is recaptured at up to 25%, and gains may owe capital-gains tax (a 1031 exchange can defer both). Figures are a year-1 estimate at your 24.0% rate — not tax advice; consult a CPA.
Schools (NCES district)
- District
- Milwaukee School District
- NCES district ID
- 5509600
- Math proficiency
- 10% ▼ -5.00%
- Reading proficiency
- 18% ▬ 0.00%
- Median HH income
- $36,339
- Composite
- 11.61/100
- National rank
- #9696
- State rank
- #337 of 342 in WI
Livability — Milwaukee
- Score
- 81/100
- State rank
- #55
- US rank
- #1534
Category grades
Schools grade is shown separately in the Schools card above.
Census & demographics
- Census place
- Milwaukee, WI
- County
- Milwaukee County · 926,379 people
- City population
- 573,768
- Metro
- Milwaukee-Waukesha, WI
- Population (ZIP)
- 45,170
- Household income
- $48,486
- Rent vs Own
- Severe rent burden
- 3390.0
Population outlook (Milwaukee County) Hauer SSP2
- Today (2025)
- 995,758 people
- By 2030
- 1,009,124 · +1.3%
- By 2040
- 1,028,128 · +3.3%
- By 2050
- 1,040,066 · +4.4%
- By 2075
- 1,057,849 · +6.2%
- By 2100
- 1,039,774 · +4.4%
Race, ethnicity, and origin ACS 2023
- Neighborhood character
- Predominantly Black (66%)
- Race & ethnicity
- Black 66% White 22% Hispanic / Latino 5% Two or more races 5% Asian 2%
- Hispanic origin (detail)
- Mexican 2% Puerto Rican 3%
- Common ancestry
- Romanian 3% Portuguese 1% Iranian 1%
- Foreign-born
- 3% · Canada
- Languages at home
- 92% English-only · Spanish 4% Other Asian/Pacific 1% Russian/Polish/Slavic 1%
Political lean MEDSL · Milwaukee
- 2024 margin
- Solid D (+38.5) · D 68.3% · R 29.8% · Other 1.8%
- 2008→2024 swing
- +2.7pp toward D · 2008: 35.9pp · 2024: 38.5pp
- All cycles
- 2024: D+38.5 2020: D+39.9 2016: D+37.5 2012: D+34.6 2008: D+35.9
Not yet ingested
- Civics
- —
Market trends
- HPI YoY
- ▼ -194.98%
- Current HPI
- 172.4275
- Rent YoY
- ▲ 8.61%
- Metro
- Milwaukee-Waukesha, WI
- State GDP YoY
- ▲ 2.10%
- F500 in state
- 20
Industry mix (Fortune 500 HQ in WI)
| Industry | F500 HQs | Revenue |
|---|---|---|
| Industrial Machinery | 4 | $23B |
|
||
| Industrial Technology | 2 | $36B |
|
||
| Insurance | 1 | $36B |
|
||
| Professional Services | 1 | $19B |
|
||
| Utilities | 1 | $9B |
|
||
| Consumer Goods | 1 | $3B |
|
||
Price history
-28.0% since first listed7 events — show timeline
- 2026-06-10 Listed $23,750 METROMLS
- 2026-05-20 Listing Removed — METROMLS
- 2026-04-13 Listed $30,900 METROMLS
- 2014-09-25 Listing Removed — METROMLS
- 2014-09-04 Listed $19,900 METROMLS
- 2007-07-12 Sold (Public Records) $78,000 Public Records
- 1996-02-01 Sold (Public Records) $33,000 Public Records
Property tax history
+7.9%/yrLatest (2024): $6,009 · -0.5% YoY. Source: county tax records.
Cash-flow waterfall
monthlySold comps — $/sqft
last 12 mo · ≤1 miLoading sold comps…