 Duplex
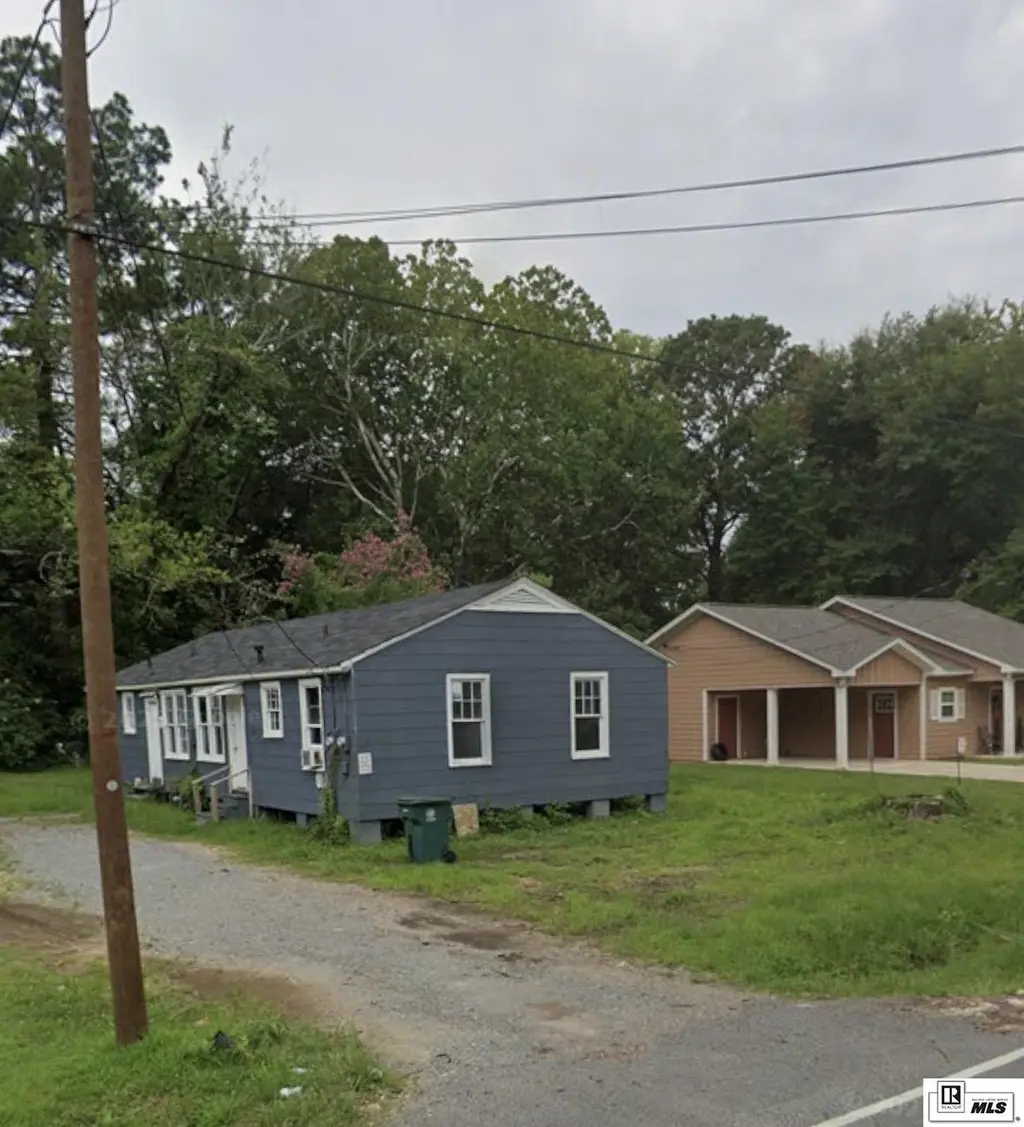
1008 S 4th St · Monroe, LA
Flood risk 1/10 · Minimal
- FEMA flood zone
- X (shaded)
- Chance of flooding over 30 yrs
- 0.0%
- Est. flood insurance / yr
- $507 – $1,088
Fire risk 1/10 · Minimal
- Est. fire insurance / yr
- $1,269 – $2,357
Heat risk 7/10 · Major
- Hot days now (above 112°F)
- 7 days/yr
- Hot days in 30 yrs
- 20 days/yr
Wind risk 7/10 · Major
- Chance of severe wind over 30 yrs
- 78.0%
Air-quality risk 1/10 · Minimal
- Unhealthy air days now
- 0 days/yr
- Unhealthy air days in 30 yrs
- 0 days/yr
Risk factors via First Street. Map © Google.
Why this score? — see what drove the B- grade
The composite is a weighted blend of 9 inputs, each scored 0–100. Each bar is that input's sub-score; the figure is the points it added to the 100-point composite (weight × sub-score).
- Cash flow +30.0/30.0
- 1% rule +10.0/10.0
- DSCR +10.0/10.0
- ARV discount +7.5/15.0
- Livability +3.3/5.0
- Rent growth +2.5/5.0
- Condition / age +2.5/5.0
- Schools +2.1/10.0
- Appreciation +0.0/10.0
$75,000
🖨 Deal sheet 📄 Offer letter ✓ Due diligence
Multi-family units
County records classify this as Multi-Family (5+ Unit). Listing-text estimate: 2 units. estimate disagrees with records
5+ unit building — per-unit beds/baths from public records are typically unavailable; the breakdown below (if shown) is an estimate from the listing text.
Listing remarks
Looking for an investment with immediate cash flow? This rental duplex offers stable monthly income and flexible purchasing options. And there are options!!!! Buy individually or mix & match packages to fit your portfolio. Call For details!
Key facts
- Listed 69 days
Property features AI
Finance
- Other: Property located at 1008 S 4th St, Monroe, LA 71201
Exterior
- Utilities: Public water; Public sewer; Natural gas available and connected
- Home design: Residential income property; Duplex
- Construction: Frame construction; Other construction materials; Pillar/post/pier foundation; Crawl space
- Exterior features: No patio or porch; Asphalt roof
Interior
- Kitchen: Electric water heater; Gas water heater
- Heating & cooling: Natural gas heating; Wall furnace; Wall/window air conditioning units; Has heating and cooling
- Interior features: Other interior features
- Laundry & utility: Laundry details: see remarks
Neighborhood map
What this means for you Summary
Snapshot
- This is a 2 × 2-bed/?-bath units multifamily listed at $75k.
Deal economics
- At list price, monthly cash flow is $1k ($14k/yr) — positive. Per door: $582/mo.
- The deal already cash-flows at list — no discount required.
- Meets the 1% rule at list price ($2k rent vs $75k).
- Recommended offer: $70k (6.0% below list) — sets the bar for market timing.
- Cap rate 24.9% vs local median 5.7% in Monroe — top-decile yield for the area; either an underpriced asset or a hidden risk that comps aren't pricing in. Stress-test before assuming the spread holds.
Location & tenants
- Location reads 66/100 on livability (#128 in LA) — a middle-class / working-renter tenant base. Strengths: cost of living A+, health & safety A+; Watch: crime F, amenities F, commute F.
- City Of Monroe School District (urban): math 21% / reading 31% proficiency, ranked #60 of 98 in LA (top 61%) — low school quality limits family demand, transient renter base, plan for 1-2y turnover; 82% free/reduced lunch — lower-income household profile, screen leases tightly.
- Market conditions: 142 active listings in the ZIP; 1 comparable units currently listed for rent nearby; 345 units permitted in Ouachita Parish in 2024 (0 in 5+ unit buildings).
- This rent runs 37% of the median local income ($65k/yr) — at the standard rent-burdened threshold; future hikes will face affordability resistance.
Forward outlook
- Local home prices are declining (-3.0%/yr); year-one equity from $519 of loan paydown is wiped out by about $2k of value loss. Plan a longer hold.
- At projected returns (-3.0% appreciation + 3.0% rent growth), your $21k cash investment doubles in ~2 years — after that, you're playing with house money.
Negotiation context
- It's been on market 70 days — a 6% lower offer ($70k) is reasonable based on typical stale-listing flexibility.
- 7 sale attempts since 15y ago with the ask held roughly flat each time — persistent listings suggest the price (not the market) is what's stuck; bring a comps-based counter.
Risks & watch-outs
- Climate carrying-cost: major wind risk, 78% chance of damaging wind over 30y; extreme-heat days projected 7→20/yr by 2055 (HVAC capex compounding) — expect insurance premiums to compound above CPI over the hold.
Questions for the listing agent
- It's been on market 70 days. Have you received any prior offers? Is the seller open to a 6% concession, seller financing, or rate buy-down credit?
- Can we see the unit-by-unit rent roll, current vacancy, and any below-market leases? What's the average tenancy length?
- What capital expenditures (roof, boiler, parking lot, exteriors) have been made in the last 5 years, and what's planned in the next 2?
- Why hasn't it sold? Are there any deal-killer items the seller is aware of (foundation, flood, title, zoning, code violations)?
- Is there a deadline driving the sale (1031 exchange, divorce, estate, relocation)? That informs how much negotiation room exists.
- Crime grade is F in this area — have there been break-ins, vandalism, or insurance claims at this property in the last 3 years? What carrier currently insures it and at what premium?
- What's the average days-on-market for RENTAL listings here right now (not sales)? A rising rental-DOM trend means longer vacancies and softer asking-rent achievability than the comps imply.
- What's the recent tenant-quality profile in this submarket — average credit score on applications, eviction rate, late-payment / NSF rate, and stable-employment percentage? A property-management company in the area should have these aggregated.
- How much new apartment / multifamily construction is in the pipeline within 1–3 miles? Heavy new supply (>2% of stock underway) typically softens rents 12–24 months out; light construction supports rent growth.
Investment metrics
- 1% rule
- 2.71% ✓
- Cap rate
- 24.90%
- Cash-on-cash
- 66.47%
- DSCR
- 3.96
- GRM
- 3.1
CMA / ARV
No comps found within radius.
Projected returns pro-forma
-3.0% appreciation · 3.0% rent growth · sell at horizon
- IRR
- 65.7%
- Equity multiple
- 3.95×
- Total profit
- $61,915
- Equity at exit
- $11,183
- IRR
- 70.0%
- Equity multiple
- 8.11×
- Total profit
- $149,246
- Equity at exit
- $6,485
Cash invested: $21,000 (down + closing). Projections, not guarantees.
Landlord ↔ Tenant lean methodology
- Overall (STATE)
- 90 Strongly Landlord-Friendly
- State Louisiana
- 90 Strongly Landlord-Friendly · R+12
- County
- — inherits STATE
- City
- — inherits STATE
ZIP-level market 71201
- Home prices YoY
- -31.9%
- Active inventory
- 142
- Price-to-rent
- 6.1×
Monthly cashflow live
- Estimated rent
- $2,034 medium interval (Pro) →
- Mortgage (P&I)
- −$393
- Tax from tax record
- −$19 /mo · $230/yr
- Insurance
- −$31
- HOA
- −$0
- Vacancy / Maint / Mgmt
- −$427
- Net cashflow
- $1,163
Break-even live
2-unit breakdown (identical units grouped — click to expand)
| Units | Beds | Baths | Est. rent |
|---|---|---|---|
| 2× units | 2 | — | $2,034 |
| #1 | 2 | — | $1,017 |
| #2 | 2 | — | $1,017 |
| Total (2 units) | $2,034 | ||
UW: 25.0% down · 7.5% · 30yr · 1.5% tax · 5.0% vac · 8.0% maint · 8.0% mgmt
Financing live
Cash to close
- Down payment
- $18,750
- Closing costs
- $2,250
- Reserves months
- —
- Total cash needed
- —
Loan-product check · same deal, 3 products live
Conventional
25% down · 7.5% · 30yr
- Down + closing
- —
- Monthly P&I
- —
- Monthly cashflow
- —
- DSCR
- —
- Eligible?
- —
Personal DTI + credit; lowest rate.
DSCR
20% down · 8.5% · 30yr
- Down + closing
- —
- Monthly P&I
- —
- Monthly cashflow
- —
- DSCR
- —
- Eligible?
- —
No personal income docs; deal must DSCR.
Hard money
10% down · 12.0% · 12mo
- Down + closing
- —
- Monthly P&I
- —
- Monthly cashflow
- —
- DSCR
- —
- Eligible?
- —
Short-term bridge; refi at stabilization.
Rent comps 1 comps
| Address | Beds | Baths | Sqft | Rent | $/sqft | DOM | Units | Dist |
|---|---|---|---|---|---|---|---|---|
| 1006 S 2nd St Monroe, LA | 3.0 | 1.0 | 1200 | $625 | $0.52 | 21d | 1 | 0.14mi |
Listing history 27 events
-
2026-06-19days on market $75,000 Active 70 DOM
-
2026-06-18days on market $75,000 Active 69 DOM
-
2026-06-17days on market $75,000 Active 68 DOM
-
2026-06-16days on market $75,000 Active 67 DOM
-
2026-06-15days on market $75,000 Active 66 DOM
-
2026-06-14days on market $75,000 Active 64 DOM
-
2026-06-13days on market $75,000 Active 63 DOM
-
2026-06-10days on market $75,000 Active 61 DOM
-
2026-06-09days on market $75,000 Active 60 DOM
-
2026-06-08days on market $75,000 Active 59 DOM
-
2026-06-07days on market $75,000 Active 58 DOM
-
2026-06-05days on market $75,000 Active 55 DOM
-
2026-06-02days on market $75,000 Active 53 DOM
-
2026-06-01days on market $75,000 Active 52 DOM
-
2026-05-31days on market $75,000 Active 51 DOM
-
2026-05-30days on market $75,000 Active 50 DOM
-
2026-04-10$75,000 Active
-
2024-05-05historical
-
2024-02-15
-
2023-09-21historical
-
2023-09-03
-
2023-08-30historical
-
2023-07-27
-
2012-03-01soldstatus
-
2011-12-13$15,900
-
2011-12-13$34,900
-
2011-05-12$19,900
ⓘ Source: listings_history table (triggers on properties + properties_extension) + one-shot
backfill from property_details.listing_events for pre-trigger history.
Tax reassessment forecast LA · Resets to sale price
- Current annual tax
- $230 · $19/mo
- Projected year-2 tax
- $412 · $34/mo
- Expected delta
- +$183/yr (+$15/mo · 79.7%)
ⓘ Screening estimate from a state-policy table — verify with the county assessor before closing.
Climate risk First Street
- Flood 1/10 Low FEMA zone X (shaded) · 0% chance over 30 yrs
- Wildfire 1/10 Low
- Heat 7/10 Severe 7 d/yr ≥112°F today · 20 d/yr by 30 yrs out
- Wind 7/10 Severe 78% chance of damaging wind over 30 yrs
- Air quality 1/10 Low 0 unhealthy d/yr today · 0 by 30 yrs out
Nearby sold comps map
Loading sold comps map…
Walkable amenities ~0.75 mi
Loading nearby amenities…
Taxation est. · year 1
- Rental income
- $24,408
- − Mortgage interest
- −$4,201
- − Property taxes
- −$230
- − Insurance
- −$375
- − Repairs & maintenance
- −$1,953
- − Management
- −$1,953
- − Depreciation
- −$2,182
- Taxable income
- $13,515
- Est. tax owed @ 24.0%
- −$3,244
- After-tax cash flow
- $10,714/yr
For passive investors: Depreciation is non-cash, so a rental often shows a tax loss while cash-flowing — sheltering income. Rental losses are passive: they offset passive income freely, and up to $25,000/yr can offset ordinary (W-2) income if you actively participate and your MAGI is under $100k (phasing out to $0 by $150k); unused losses carry forward. On sale, claimed depreciation is recaptured at up to 25%, and gains may owe capital-gains tax (a 1031 exchange can defer both). Figures are a year-1 estimate at your 24.0% rate — not tax advice; consult a CPA.
Schools (NCES district)
- District
- City Of Monroe School District
- NCES district ID
- 2201080
- Math proficiency
- 21% ▼ -36.00%
- Reading proficiency
- 31% ▼ -34.00%
- Median HH income
- $28,751
- Composite
- 20.82/100
- National rank
- #8505
- State rank
- #60 of 98 in LA
Livability — Monroe
- Score
- 66/100
- State rank
- #128
- US rank
- #11948
Category grades
Schools grade is shown separately in the Schools card above.
Census & demographics
- Census place
- Monroe, LA
- County
- Ouachita Parish · 118,340 people
- City population
- 60,136
- Metro
- Monroe, LA
- Population (ZIP)
- 21,782
- Household income
- $65,446
- Rent vs Own
- Severe rent burden
- 1466.0
Population outlook (Ouachita County) Hauer SSP2
- Today (2025)
- 163,370 people
- By 2030
- 165,520 · +1.3%
- By 2040
- 167,652 · +2.6%
- By 2050
- 166,699 · +2.0%
- By 2075
- 156,348 · -4.3%
- By 2100
- 134,102 · -17.9%
Race, ethnicity, and origin ACS 2023
- Neighborhood character
- Diverse neighborhood (Simpson 0.55)
- Race & ethnicity
- White 57% Black 35% Two or more races 3% Hispanic / Latino 3% Asian 2%
- Common ancestry
- Lithuanian 3% Slovak 2% Italian 1%
- Foreign-born
- 3% · Vietnam
- Languages at home
- 95% English-only · Spanish 3% Other Indo-European 1% Arabic 1%
Political lean MEDSL · Ouachita
- 2024 margin
- Strong R (+27.9) · D 35.5% · R 63.3% · Other 1.2%
- 2008→2024 swing
- -2.7pp toward R · 2008: -25.2pp · 2024: -27.9pp
- All cycles
- 2024: R+27.9 2020: R+23.6 2016: R+25.4 2012: R+20.9 2008: R+25.2
Not yet ingested
- Civics
- —
Market trends
- HPI YoY
- ▼ -92.35%
- Current HPI
- 196.7468
- Rent YoY
- —
- Metro
- Monroe, LA
- State GDP YoY
- ▲ 3.29%
- F500 in state
- 10
Industry mix (Fortune 500 HQ in LA)
| Industry | F500 HQs | Revenue |
|---|---|---|
| Telecommunications | 2 | $23B |
|
||
| Utilities | 1 | $12B |
|
||
| Wholesale / Distribution | 1 | $5B |
|
||
| Advertising | 1 | $2B |
|
||
Price history
+276.9% since first listed11 events — show timeline
- 2026-04-10 Listed $75,000 NELABOR
- 2024-05-05 Rental Removed — BUILDIUM
- 2024-02-15 Listed for Rent — BUILDIUM
- 2023-09-21 Rental Removed — BUILDIUM
- 2023-09-03 Listed for Rent — BUILDIUM
- 2023-08-30 Rental Removed — BUILDIUM
- 2023-07-27 Listed for Rent — BUILDIUM
- 2012-03-01 Sold (Public Records) — Public Records
- 2011-12-13 Listed $34,900 NELABOR
- 2011-12-13 Listed $15,900 NELABOR
- 2011-05-12 Listed $19,900 NELABOR
Property tax history
-0.3%/yrLatest (2025): $230 · -0.1% YoY. Source: county tax records.
Cash-flow waterfall
monthlySold comps — $/sqft
last 12 mo · ≤1 miLoading sold comps…