1031 College Ave · Nashville-Davidson metropolitan government (balance), TN
Flood risk 9/10 · Severe
- FEMA flood zone
- AE
- Chance of flooding over 30 yrs
- 0.99%
- Est. flood insurance / yr
- $2,026 – $9,024
Fire risk 1/10 · Minimal
- Est. fire insurance / yr
- $949 – $1,763
Heat risk 6/10 · Moderate
- Hot days now (above 106°F)
- 7 days/yr
- Hot days in 30 yrs
- 19 days/yr
Wind risk 4/10 · Minor
- Chance of severe wind over 30 yrs
- 10.0%
Air-quality risk 2/10 · Minimal
- Unhealthy air days now
- 1 days/yr
- Unhealthy air days in 30 yrs
- 2 days/yr
Risk factors via First Street. Map © Google.
Why this score? — see what drove the C+ grade
The composite is a weighted blend of 9 inputs, each scored 0–100. Each bar is that input's sub-score; the figure is the points it added to the 100-point composite (weight × sub-score).
- Cash flow +30.0/30.0
- DSCR +10.0/10.0
- 1% rule +8.2/10.0
- ARV discount +7.5/15.0
- Livability +2.5/5.0
- Condition / age +2.5/5.0
- Rent growth +2.4/5.0
- Schools +1.4/10.0
- Appreciation +0.0/10.0
$329,900
🖨 Deal sheet 📄 Offer letter ✓ Due diligence
Listing remarks
Located within walking distance to Tennessee State University! This property has a lot of potential~a large home with a floorplan that allows for flexibility within the usage for each room~a basement that has been finished where it makes it easy for large families or gatherings to occur~hardwood floors~park-like corner lot~great for investment property~sqft includes basement and sunroom~parking is ideal because the road actually ends next to the house and there is a perfect area for extra spacing~detached buildings that will be great for a separate office or just use for storage~property to be sold as-is~seller makes no representations or warranties
Key facts
- 0.3 acre lot
- Built 1960
- Listed 76 days
Property features AI
Finance
- Other: Living area reported as 2,989 square feet (per appraiser)
Exterior
- Parking: No covered parking listed; No parking total listed
- Utilities: Public water; Public sewer; Electricity available; Natural gas available
- Home design: Single-family residence; Two levels; Residential property
- Construction: Brick and vinyl siding exterior; Shingle roof; Block foundation; Existing year built (per record)
- Exterior features: Level lot; Lot dimensions approximately 35 x 220; Other exterior structure: storage
Interior
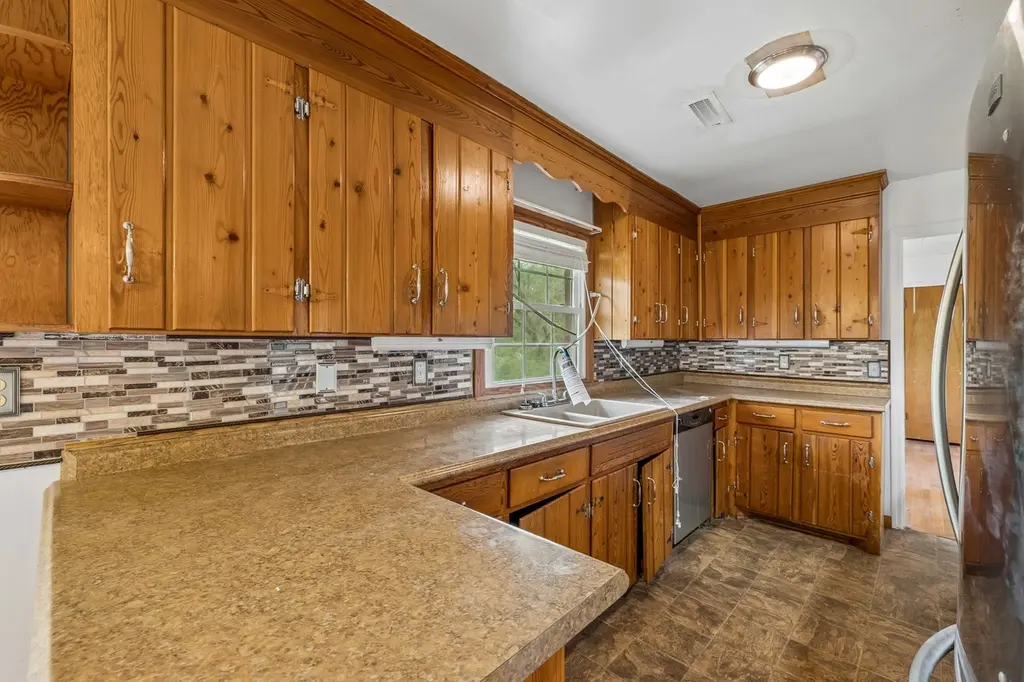
- Kitchen: Oven; Range; Eat-in kitchen
- Bedrooms: 5 bedrooms total (3 on the main level); Bedroom dimensions include 12x12, 12x11, 11x11
- Flooring: Carpet; Wood; Tile
- Bathrooms: 3 full bathrooms
- Heating & cooling: Central heating (natural gas); Central air (electric)
- Interior features: Finished basement; Formal living room; Eat-in kitchen; Sewing room; Utility room; Storage
- Laundry & utility: Washer hookup; Electric dryer hookup; Utility room
Neighborhood map
What this means for you Summary
Snapshot
- This is a 5-bed/3.5-bath single-family listed at $330k.
Deal economics
- At list price, monthly cash flow is $888 ($11k/yr) — positive.
- The deal already cash-flows at list — no discount required.
- Meets the 1% rule at list price ($4k rent vs $330k).
- Recommended offer: $310k (6.0% below list) — sets the bar for market timing.
- Cap rate 11.2% vs local median 2.9% in Nashville-Davidson metropolitan government (balance) — top-decile yield for the area; either an underpriced asset or a hidden risk that comps aren't pricing in. Stress-test before assuming the spread holds.
Location & tenants
- Location reads: area grade C — affects rentability + tenant quality, not the cash-flow math above.
- Davidson County (urban): math 12% / reading 19% proficiency, ranked #126 of 139 in TN (top 91%) — low school quality limits family demand, transient renter base, plan for 1-2y turnover; 66% free/reduced lunch — lower-income household profile, screen leases tightly.
- Zoned schools: Pearl-Cohn High (math 2% / reading 12%, grade F, #294 of 332 statewide, top 91%, 604 students, 0% FRL) — zoned schools average 0% FRL vs 66% district-wide (66 pts lower); this property's tenant base skews higher-income than the district average.
- Market conditions: Rents soft (-0.6%/yr); 554 active listings in the ZIP; 21 comparable units currently listed for rent nearby; rentals at typical pace (median 24d on market — plan ~3-4 weeks tenant-placement turnaround); solid renter incomes; 6,873 units permitted in Davidson County in 2024 (4,138 in 5+ unit buildings).
- At $4,355/mo this rent would consume 64% of the median local household income ($81k/yr) (locally 2402% of renters already pay >50% of income on rent) — very limited rent-growth headroom before tenants either downsize or default.
Forward outlook
- Local home prices are declining (-3.0%/yr); year-one equity from $2k of loan paydown is wiped out by about $10k of value loss. Plan a longer hold.
- Davidson County population projected at +42% by 2050 — long-run rental-demand tailwind backs the buy-and-hold thesis.
Negotiation context
- It's been on market 76 days — a 6% lower offer ($310k) is reasonable based on typical stale-listing flexibility.
- 2 sale attempts; this cycle's ask has dropped $35k (10%) from the opening price — seller is motivated, your offer sets the floor, not the list.
- Current owner paid $17k; list at $330k implies a 1841% gain — meaningful room to come down on a strong offer.
Risks & watch-outs
- Watch-outs: flood insurance adds $460/mo.
- Climate carrying-cost: in FEMA flood zone AE (mandatory federal flood insurance); extreme-heat days projected 7→19/yr by 2055 (HVAC capex compounding) — expect insurance premiums to compound above CPI over the hold.
Questions for the listing agent
- It's been on market 76 days. Have you received any prior offers? Is the seller open to a 6% concession, seller financing, or rate buy-down credit?
- Built in 1960 — when were the roof, HVAC, electrical panel, plumbing, and water heater last replaced?
- What's the actual annual flood-insurance premium (NFIP or private), and is the property in a SFHA with mandatory coverage?
- Why hasn't it sold? Are there any deal-killer items the seller is aware of (foundation, flood, title, zoning, code violations)?
- Is there a deadline driving the sale (1031 exchange, divorce, estate, relocation)? That informs how much negotiation room exists.
- What's the average days-on-market for RENTAL listings here right now (not sales)? A rising rental-DOM trend means longer vacancies and softer asking-rent achievability than the comps imply.
- What's the recent tenant-quality profile in this submarket — average credit score on applications, eviction rate, late-payment / NSF rate, and stable-employment percentage? A property-management company in the area should have these aggregated.
- How much new for-sale + rental construction is in the pipeline within 1–3 miles? Heavy new supply typically softens prices + rents 12–24 months out; constrained supply supports both.
Investment metrics
- 1% rule
- 1.32% ✓
- Cap rate
- 11.20%
- Cash-on-cash
- 17.51%
- DSCR
- 1.78
- GRM
- 6.3
CMA / ARV
- ARV (on-the-fly)
- $732,648
- Comps found
- 12
Show comp detail 12 sales within ~0.75 mi
| Address | Dist | Beds/Ba | Sqft | Sold | Price | $/sf | Match |
|---|---|---|---|---|---|---|---|
| 718 41st Ave N | 0.53mi | 4/4.0 (-1) | 2,101 (-2%) | 2mo | $597,000 | $284 | 64 |
| 1015 42nd Ave N | 0.27mi | 4/3.0 (-1) | 2,273 (+6%) | 14mo | $737,500 | $324 | 58 |
| 4407 Illinois Ave | 0.59mi | 5/3.0 | 2,262 (+6%) | 6mo | $785,000 | $347 | 56 |
| 4005A Indiana Ave | 0.57mi | 4/3.5 (-1) | 2,108 (-1%) | 14mo | $700,000 | $332 | 55 |
| 4021 Indiana Ave | 0.56mi | 4/3.0 (-1) | 2,118 (-1%) | 14mo | $785,000 | $371 | 54 |
| 914A 32nd Ave N | 0.68mi | 4/3.0 (-1) | 2,000 (-6%) | 9mo | $540,000 | $270 | 43 |
| 4806 Michigan Ave | 0.71mi | 4/3.0 (-1) | 2,262 (+6%) | 14mo | $775,000 | $343 | 38 |
| 4708A Illinois Ave | 0.71mi | 4/3.0 (-1) | 2,410 (+13%) | 1mo | $900,000 | $373 | 37 |
| 4604 Indiana Ave | 0.71mi | 4/4.5 (-1) | 2,348 (+10%) | 6mo | $830,000 | $353 | 37 |
| 4710B Illinois Ave | 0.72mi | 4/3.0 (-1) | 2,356 (+10%) | 10mo | $700,000 | $297 | 34 |
| 4812 Kentucky Ave | 0.70mi | 4/3.5 (-1) | 2,396 (+12%) | 11mo | $725,000 | $303 | 33 |
| 4705B Illinois Ave | 0.73mi | 4/3.0 (-1) | 2,451 (+15%) | 10mo | $860,000 | $351 | 26 |
Match score weights: distance 35% · size 25% · config 20% · recency 20%. Top-matched comps best support the ARV.
Projected returns pro-forma
-3.0% appreciation · 0.0% rent growth · sell at horizon
- IRR
- -2.8%
- Equity multiple
- 0.90×
- Total profit
- $-9,453
- Equity at exit
- $49,189
- IRR
- 2.9%
- Equity multiple
- 1.18×
- Total profit
- $16,194
- Equity at exit
- $28,524
Cash invested: $92,372 (down + closing). Projections, not guarantees.
Landlord ↔ Tenant lean methodology
- Overall (STATE)
- 87 Strongly Landlord-Friendly
- State Tennessee
- 87 Strongly Landlord-Friendly · R+13
- County
- — inherits STATE
- City
- — inherits STATE
ZIP-level market 37209
- Rents YoY
- -0.6%
- Active inventory
- 554
- Price-to-rent
- 6.3×
Monthly cashflow live
- Estimated rent
- $4,355 high interval (Pro) →
- Mortgage (P&I)
- −$1,730
- Tax from tax record
- −$225 /mo · $2,695/yr
- Insurance
- −$137
- Flood insurance flood zone
- −$460 /mo · $5,525/yr
- HOA
- −$0
- Vacancy / Maint / Mgmt
- −$914
- Net cashflow
- $888
Break-even live
UW: 25.0% down · 7.5% · 30yr · 1.5% tax · 5.0% vac · 8.0% maint · 8.0% mgmt
Financing live
Cash to close
- Down payment
- $82,475
- Closing costs
- $9,897
- Reserves months
- —
- Total cash needed
- —
Loan-product check · same deal, 3 products live
Conventional
25% down · 7.5% · 30yr
- Down + closing
- —
- Monthly P&I
- —
- Monthly cashflow
- —
- DSCR
- —
- Eligible?
- —
Personal DTI + credit; lowest rate.
DSCR
20% down · 8.5% · 30yr
- Down + closing
- —
- Monthly P&I
- —
- Monthly cashflow
- —
- DSCR
- —
- Eligible?
- —
No personal income docs; deal must DSCR.
Hard money
10% down · 12.0% · 12mo
- Down + closing
- —
- Monthly P&I
- —
- Monthly cashflow
- —
- DSCR
- —
- Eligible?
- —
Short-term bridge; refi at stabilization.
Rent comps 21 comps
| Address | Beds | Baths | Sqft | Rent | $/sqft | DOM | Units | Dist |
|---|---|---|---|---|---|---|---|---|
| 4021 Indiana Ave Unit 1312371P Nashville, TN | 4.0 | 3.0 | 2594 | $9,337 | $3.60 | 23d | 1 | 0.55mi |
| 2726 Scovel St Nashville, TN | 4.0 | 2.5 | 2400 | $4,500 | $1.88 | 23d | 1 | 0.84mi |
| 409B 35th Ave N Nashville, TN | 4.0 | 3.5 | 2909 | $4,750 | $1.63 | 23d | 1 | 0.90mi |
| 2826 Clifton Ave Nashville, TN | 4.0 | 3.5 | 2256 | $3,500 | $1.55 | 23d | 1 | 0.90mi |
| 5011 Illinois Ave Nashville, TN | 4.0 | 4.5 | 2200 | $5,400 | $2.45 | 21d | 1 | 0.91mi |
| 5204A Kentucky Ave Nashville, TN | 4.0 | 3.0 | 2172 | $4,500 | $2.07 | 23d | 1 | 0.95mi |
| 525 31st Ave N Nashville, TN | 4.0 | 3.5 | 2800 | $5,000 | $1.79 | 23d | 1 | 0.96mi |
| 5301 Centennial Blvd Unit B Nashville, TN | 4.0 | 4.0 | 2039 | $4,200 | $2.06 | 14d | 1 | 0.97mi |
| 515 31st Ave N Nashville, TN | 4.0 | 3.0 | 2725 | $5,000 | $1.83 | 21d | 1 | 0.99mi |
| 3009 Delaware Ave Nashville, TN | 4.0 | 3.5 | 2038 | $4,100 | $2.01 | 2d | 1 | 1.04mi |
| 2601 Batavia St Nashville, TN | 4.0 | 3.0 | 1944 | $2,950 | $1.52 | 23d | 1 | 1.08mi |
| 2807 Delaware Ave Unit 1051682P Nashville, TN | 4.0 | 4.0 | 2701 | $7,514 | $2.78 | 12d | 1 | 1.08mi |
| 2704 Clifton Ave #402 Nashville, TN | 4.0 | 3.5 | 1740 | $6,995 | $4.02 | 23d | 1 | 1.11mi |
| 2420 Albion St Nashville, TN | 4.0 | 3.0 | 2985 | $3,595 | $1.20 | 23d | 1 | 1.16mi |
| 5816 Morrow Rd Unit 1051667P Nashville, TN | 4.0 | 4.5 | 2852 | $15,823 | $5.55 | 21d | 1 | 1.38mi |
| 1006 Trice Dr Nashville, TN | 4.0 | 3.0 | 1981 | $3,795 | $1.92 | 7d | 1 | 1.38mi |
| 1526 23rd Ave N Unit b Nashville, TN | 4.0 | 3.0 | 3000 | $3,600 | $1.20 | 23d | 1 | 1.39mi |
| 1613 23rd Ave N Nashville, TN | 4.0 | 3.0 | 2702 | $3,000 | $1.11 | 4d | 1 | 1.40mi |
| 1612 23rd Ave N Nashville, TN | 4.0 | 3.0 | 1906 | $2,623 | $1.38 | 23d | 1 | 1.42mi |
| 1202 60th Ave N Nashville, TN | 4.0 | 3.5 | 1832 | $2,850 | $1.56 | 2d | 1 | 1.46mi |
| 1202 60th Ave N Nashville, TN | 4.0 | 3.5 | 1832 | $2,850 | $1.56 | 21d | 1 | 1.46mi |
Listing history 18 events
-
2026-06-18days on market $329,900 Active 76 DOM
-
2026-06-17days on market $329,900 Active 75 DOM
-
2026-06-16days on market $329,900 Active 74 DOM
-
2026-06-15days on market $329,900 Active 73 DOM
-
2026-06-13days on market $329,900 Active 71 DOM
-
2026-06-13days on market $329,900 Active 70 DOM
-
2026-06-09days on market $329,900 Active 67 DOM
-
2026-06-08days on market $329,900 Active 66 DOM
-
2026-06-07days on market $329,900 Active 65 DOM
-
2026-06-05pricedays on market $329,900 Active 62 DOM
-
2026-06-03days on market $346,750 Active 61 DOM
-
2026-06-02days on market $346,750 Active 60 DOM
-
2026-06-01days on market $346,750 Active 59 DOM
-
2026-05-31days on market $346,750 Active 58 DOM
-
2026-05-01price $346,750
-
2026-04-03status Active
-
2026-04-03$365,000 Active
-
1982-04-01soldstatus $17,000
ⓘ Source: listings_history table (triggers on properties + properties_extension) + one-shot
backfill from property_details.listing_events for pre-trigger history.
Tax reassessment forecast TN · Resets to sale price
- Current annual tax
- $2,695 · $225/mo
- Projected year-2 tax
- $2,695 · $225/mo
- Expected delta
- $0/yr ($0/mo · 0.0%)
ⓘ Screening estimate from a state-policy table — verify with the county assessor before closing.
Climate risk First Street
- Flood 9/10 Extreme FEMA zone AE · 99% chance over 30 yrs
- Wildfire 1/10 Low
- Heat 6/10 Major 7 d/yr ≥106°F today · 19 d/yr by 30 yrs out
- Wind 4/10 Moderate 10% chance of damaging wind over 30 yrs
- Air quality 2/10 Low 1 unhealthy d/yr today · 2 by 30 yrs out
Nearby sold comps map
Loading sold comps map…
Walkable amenities ~0.75 mi
Loading nearby amenities…
Taxation est. · year 1
- Rental income
- $52,255
- − Mortgage interest
- −$18,480
- − Property taxes
- −$2,695
- − Insurance
- −$7,174
- − Repairs & maintenance
- −$4,180
- − Management
- −$4,180
- − Depreciation
- −$9,597
- Taxable income
- $5,948
- Est. tax owed @ 24.0%
- −$1,428
- After-tax cash flow
- $9,224/yr
For passive investors: Depreciation is non-cash, so a rental often shows a tax loss while cash-flowing — sheltering income. Rental losses are passive: they offset passive income freely, and up to $25,000/yr can offset ordinary (W-2) income if you actively participate and your MAGI is under $100k (phasing out to $0 by $150k); unused losses carry forward. On sale, claimed depreciation is recaptured at up to 25%, and gains may owe capital-gains tax (a 1031 exchange can defer both). Figures are a year-1 estimate at your 24.0% rate — not tax advice; consult a CPA.
Schools (NCES district)
- District
- Davidson County
- NCES district ID
- 4703180
- Math proficiency
- 12% ▼ -17.00%
- Reading proficiency
- 19% ▼ -7.00%
- Median HH income
- $48,667
- Composite
- 14.03/100
- National rank
- #9472
- State rank
- #126 of 139 in TN
Livability — Nashville-Davidson metropolitan government (balance)
No livability data for this city. (Only ~50 U.S. cities are tracked.)
Census & demographics
- Census place
- Nashville-Davidson metropolitan government (balance), TN
- County
- Davidson County · 680,067 people
- City population
- 677,595
- Metro
- Nashville-Davidson--Murfreesboro--Franklin, TN
- Population (ZIP)
- 37,817
- Household income
- $81,423
- Rent vs Own
- Severe rent burden
- 2402.0
Population outlook (Davidson County) Hauer SSP2
- Today (2025)
- 808,568 people
- By 2030
- 874,489 · +8.2%
- By 2040
- 1,009,046 · +24.8%
- By 2050
- 1,147,294 · +41.9%
- By 2075
- 1,475,439 · +82.5%
- By 2100
- 1,714,101 · +112.0%
Race, ethnicity, and origin ACS 2023
- Neighborhood character
- Majority White (65%)
- Race & ethnicity
- White 65% Black 18% Hispanic / Latino 8% Two or more races 6% Asian 5%
- Hispanic origin (detail)
- Mexican 4%
- Common ancestry
- Italian 3% Lithuanian 3% Slovak 3%
- Foreign-born
- 10% · Canada, Vietnam, China
- Languages at home
- 88% English-only · Spanish 7% Other Indo-European 1% Vietnamese 1%
Political lean MEDSL · Davidson
- 2024 margin
- Strong D (+27.4) · D 62.7% · R 35.3% · Other 2.0%
- 2008→2024 swing
- +6.5pp toward D · 2008: 21.0pp · 2024: 27.4pp
- All cycles
- 2024: D+27.4 2020: D+32.1 2016: D+26.0 2012: D+18.7 2008: D+21.0
Not yet ingested
- Civics
- —
Market trends
- HPI YoY
- ▼ -580.87%
- Current HPI
- 372.4026
- Rent YoY
- ▼ -0.58%
- Metro
- Nashville-Davidson--Murfreesboro--Franklin, TN
- State GDP YoY
- ▲ 2.78%
- F500 in state
- 22
Industry mix (Fortune 500 HQ in TN)
| Industry | F500 HQs | Revenue |
|---|---|---|
| Healthcare | 3 | $91B |
|
||
| Retail | 3 | $72B |
|
||
| Transportation / Logistics | 1 | $88B |
|
||
| Paper / Packaging | 1 | $19B |
|
||
| Insurance | 1 | $13B |
|
||
| Energy | 1 | $12B |
|
||
Price history
+1939.7% since first listed4 events — show timeline
- 2026-05-01 Price Changed $346,750 REALTRACS as Distributed by MLS Grid
- 2026-04-03 Relisted — REALTRACS as Distributed by MLS Grid
- 2026-04-03 Listed $365,000 REALTRACS as Distributed by MLS Grid
- 1982-04-01 Sold (Public Records) $17,000 Public Records
Property tax history
+10.7%/yrLatest (2025): $2,695 · +9.9% YoY. Source: county tax records.
Cash-flow waterfall
monthlySold comps — $/sqft
last 12 mo · ≤1 miLoading sold comps…