709 Mendez St · Harlingen, TX
Flood risk 1/10 · Minimal
- FEMA flood zone
- X (unshaded)
- Chance of flooding over 30 yrs
- 0.0%
- Est. flood insurance / yr
- $507 – $1,088
Fire risk 1/10 · Minimal
- Est. fire insurance / yr
- $1,222 – $2,270
Heat risk 9/10 · Severe
- Hot days now (above 110°F)
- 7 days/yr
- Hot days in 30 yrs
- 24 days/yr
Wind risk 8/10 · Major
- Chance of severe wind over 30 yrs
- 99.0%
Air-quality risk 1/10 · Minimal
- Unhealthy air days now
- 0 days/yr
- Unhealthy air days in 30 yrs
- 0 days/yr
Risk factors via First Street. Map © Google.
Why this score? — see what drove the B- grade
The composite is a weighted blend of 9 inputs, each scored 0–100. Each bar is that input's sub-score; the figure is the points it added to the 100-point composite (weight × sub-score).
- Cash flow +30.0/30.0
- DSCR +10.0/10.0
- 1% rule +9.1/10.0
- ARV discount +7.5/15.0
- Livability +3.7/5.0
- Rent growth +3.4/5.0
- Schools +2.5/10.0
- Condition / age +2.5/5.0
- Appreciation +0.0/10.0
$79,700
🖨 Deal sheet (PDF) 📄 Offer letter ✓ Due diligence
Listing remarks
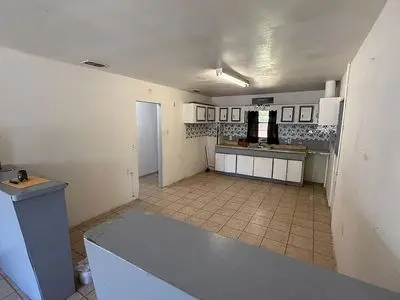
INVESTOR SPECIAL! Block-built. Huge backyard. Floorplan that flows. Open-concept kitchen and living, generous bedrooms, oversized bath. Carport handles 2 to 3 vehicles on top of the driveway and street parking. Newer HVAC already in. The 7,000 sq ft lot gives you room to actually live, or to build what comes next. Solid bones, smart layout, real value in a tightening Harlingen market. Don& apos; t sleep on this one.
Key facts
- Smart layout
- Open-concept kitchen
- Huge backyard
Tags
Neighborhood map
What this means for you Summary
Snapshot
- This is a 3-bed/2.0-bath single-family listed at $80k.
Deal economics
- At list price, monthly cash flow is $304 ($4k/yr) — positive.
- The deal already cash-flows at list — no discount required.
- Meets the 1% rule at list price ($1k rent vs $80k).
- Recommended offer: $77k (3.0% below list) — sets the bar for market timing.
- Cap rate 10.9% vs local median 3.8% in Harlingen — top-decile yield for the area; either an underpriced asset or a hidden risk that comps aren't pricing in. Stress-test before assuming the spread holds.
Location & tenants
- Location reads 73/100 on livability (#217 in TX) — a middle-class / working-renter tenant base. Strengths: amenities A+, cost of living A+, housing A+; Watch: crime C-, schools D+, commute F.
- Harlingen CISD (urban): math 25% / reading 35% proficiency, ranked #647 of 826 in TX (top 78%) — families likely to look elsewhere, expect single-tenant / working-renter base with shorter leases; 74% free/reduced lunch — lower-income household profile, screen leases tightly.
- Market conditions: Rents rising (+3.5%/yr); 465 active listings in the ZIP; 24 comparable units currently listed for rent nearby; rentals lingering (median 45d on market — plan ~5-8 weeks vacancy on turnover, expect pricing pressure); 58% of comp listings sitting > 30 days — soft ceiling on asking rent; 2,326 units permitted in Cameron County in 2024 (503 in 5+ unit buildings).
Forward outlook
- Local home prices are declining (-3.0%/yr); year-one equity from $551 of loan paydown is wiped out by about $2k of value loss. Plan a longer hold.
- Cameron County population projected at +3% by 2050 — modest demand growth; plan on rents tracking national, not racing it.
- At projected returns (-3.0% appreciation + 3.5% rent growth), your $22k cash investment doubles in ~8 years — after that, you're playing with house money.
Negotiation context
- It's been on market 31 days — a 3% lower offer ($77k) is reasonable based on typical stale-listing flexibility.
Risks & watch-outs
- Climate carrying-cost: severe wind risk, 99% chance of damaging wind over 30y; extreme-heat days projected 7→24/yr by 2055 (HVAC capex compounding) — expect insurance premiums to compound above CPI over the hold.
Questions for the listing agent
- It's been on market 31 days. Have you received any prior offers? Is the seller open to a 3% concession, seller financing, or rate buy-down credit?
- Built in 1963 — when were the roof, HVAC, electrical panel, plumbing, and water heater last replaced?
- Is there a deadline driving the sale (1031 exchange, divorce, estate, relocation)? That informs how much negotiation room exists.
- Schools are D-rated, which usually means shorter tenancies and higher turnover. Who's the typical renter profile here, and what's been the actual vacancy rate?
- What's the average days-on-market for RENTAL listings here right now (not sales)? A rising rental-DOM trend means longer vacancies and softer asking-rent achievability than the comps imply.
- What's the recent tenant-quality profile in this submarket — average credit score on applications, eviction rate, late-payment / NSF rate, and stable-employment percentage? A property-management company in the area should have these aggregated.
- How much new for-sale + rental construction is in the pipeline within 1–3 miles? Heavy new supply typically softens prices + rents 12–24 months out; constrained supply supports both.
Investment metrics
- 1% rule
- 1.41% ✓
- Cap rate
- 10.87%
- Cash-on-cash
- 16.34%
- DSCR
- 1.73
- GRM
- 5.9
CMA / ARV
- ARV (on-the-fly)
- $162,288
- Comps found
- 8
Show comp detail 8 sales within ~0.75 mi
| Address | Dist | Beds/Ba | Sqft | Sold | Price | $/sf | Match |
|---|---|---|---|---|---|---|---|
| 718 Pittman St | 0.11mi | 2/2.0 (-1) | 1,042 (+3%) | 8mo | $155,300 | $149 | 78 |
| 810 Pittman St | 0.11mi | 3/2.0 | 1,140 (+13%) | 17mo | $45,000 | $39 | 59 |
| 1014 Beaumont St | 0.40mi | 3/1.0 | 880 (-13%) | 2mo | $165,000 | $188 | 54 |
| 205 W Beck St | 0.41mi | 3/2.0 | 1,144 (+14%) | 9mo | $130,000 | $114 | 51 |
| 1008 Beaumont St | 0.39mi | 3/2.0 | 1,150 (+14%) | 15mo | $184,900 | $161 | 46 |
| 518 W Davis St | 0.47mi | 3/2.0 | 1,150 (+14%) | 18mo | $189,900 | $165 | 39 |
| 522 N J St | 0.68mi | 3/2.0 | 1,098 (+9%) | 18mo | $161,000 | $147 | 39 |
| 521 W Marjory Ave | 0.49mi | 3/2.0 | 1,150 (+14%) | 21mo | $192,500 | $167 | 36 |
Match score weights: distance 35% · size 25% · config 20% · recency 20%. Top-matched comps best support the ARV.
Projected returns pro-forma
-3.0% appreciation · 3.45% rent growth · sell at horizon
- IRR
- 8.0%
- Equity multiple
- 1.31×
- Total profit
- $6,992
- Equity at exit
- $11,884
- IRR
- 17.6%
- Equity multiple
- 2.49×
- Total profit
- $33,284
- Equity at exit
- $6,891
Cash invested: $22,316 (down + closing). Projections, not guarantees.
Landlord ↔ Tenant lean methodology
- Overall (STATE)
- 87 Strongly Landlord-Friendly
- State Texas
- 87 Strongly Landlord-Friendly · R+5
- County
- — inherits STATE
- City
- — inherits STATE
ZIP-level market 78550
- Rents YoY
- 3.5%
- Active inventory
- 465
- Price-to-rent
- 5.9×
Monthly cashflow live
- Estimated rent
- $1,124 high interval (Pro) →
- Mortgage (P&I)
- −$418
- Tax from tax record
- −$133 /mo · $1,591/yr
- Insurance
- −$33
- HOA
- −$0
- Vacancy / Maint / Mgmt
- −$236
- Net cashflow
- $304
Break-even live
Sensitivity live
| Price | -10% $349 | -5% $327 | +0% $304 | +5% $281 | +10% $259 |
|---|---|---|---|---|---|
| Rent | -10% $215 | -5% $260 | +0% $304 | +5% $348 | +10% $393 |
| Rate | -1.0pp $344 | -0.5pp $324 | base $304 | +0.5pp $283 | +1.0pp $262 |
UW: 25.0% down · 7.5% · 30yr · 1.5% tax · 5.0% vac · 8.0% maint · 8.0% mgmt
Financing live
Cash to close
- Down payment
- $19,925
- Closing costs
- $2,391
- Reserves months
- —
- Total cash needed
- —
Loan-product check · same deal, 3 products live
Conventional
25% down · 7.5% · 30yr
- Down + closing
- —
- Monthly P&I
- —
- Monthly cashflow
- —
- DSCR
- —
- Eligible?
- —
Personal DTI + credit; lowest rate.
DSCR
20% down · 8.5% · 30yr
- Down + closing
- —
- Monthly P&I
- —
- Monthly cashflow
- —
- DSCR
- —
- Eligible?
- —
No personal income docs; deal must DSCR.
Hard money
10% down · 12.0% · 12mo
- Down + closing
- —
- Monthly P&I
- —
- Monthly cashflow
- —
- DSCR
- —
- Eligible?
- —
Short-term bridge; refi at stabilization.
Rent comps 24 comps
| Address | Beds | Baths | Sqft | Rent | $/sqft | DOM | Units | Dist |
|---|---|---|---|---|---|---|---|---|
| 1917 New Combes Hwy Unit H Harlingen, TX | 3.0 | 2.0 | 1098 | $975 | $0.89 | 22d | 1 | 0.40mi |
| 902 N D St Unit A Harlingen, TX | 3.0 | 2.0 | 850 | $825 | $0.97 | 44d | 1 | 0.43mi |
| 2101 N G St Unit B Harlingen, TX | 2.0 | 2.0 | 1004 | $950 | $0.95 | 22d | 1 | 0.47mi |
| 821 W Matz Ave Unit B Harlingen, TX | 3.0 | 2.0 | 1190 | $1,300 | $1.09 | 14d | 1 | 0.55mi |
| 917 N 1st St Unit 917 Harlingen, TX | 2.0 | 1.0 | 700 | $770 | $1.10 | 44d | 1 | 0.56mi |
| 226 W Darrell Wayne Shipp St Harlingen, TX | 3.0 | 2.0 | 1400 | $1,700 | $1.21 | 44d | 1 | 0.74mi |
| 121 W Ebano Ct Harlingen, TX | 2.0 | 2.0 | 1174 | $1,200 | $1.02 | 44d | 1 | 0.99mi |
| 1421 W Madison Ave Unit A Harlingen, TX | 2.0 | 1.0 | 1160 | $925 | $0.80 | 44d | 1 | 0.99mi |
| 717 E Jim Hogg Ave Harlingen, TX | 3.0 | 1.0 | 1039 | $1,200 | $1.15 | 14d | 1 | 1.01mi |
| 409 E Madison Ave Unit 4 Harlingen, TX | 2.0 | 1.0 | 770 | $750 | $0.97 | 44d | 1 | 1.07mi |
| 106 S A St Harlingen, TX | 1.0–2.0 | 1.0–2.0 | 877 | $850 | $0.97 | 14d | 3 | 1.07mi |
| 2005 Southridge Ave Unit A Harlingen, TX | 2.0 | 2.0 | 848 | $1,250 | $1.47 | 44d | 1 | 1.18mi |
| 2104 Multi National Harlingen, TX | 2.0 | 2.0 | 830 | $1,100 | $1.33 | 44d | 1 | 1.31mi |
| 709 E Jackson St Harlingen, TX | 2.0 | 1.0 | 1100 | $1,050 | $0.95 | 14d | 1 | 1.32mi |
| 2205 Multi National Unit A Harlingen, TX | 2.0 | 2.0 | 876 | $1,100 | $1.26 | 44d | 1 | 1.37mi |
| 204 S 7th St Harlingen, TX | 2.0 | 1.0 | 713 | $725 | $1.02 | 22d | 1 | 1.38mi |
| 2209 Multi National Unit D Harlingen, TX | 2.0 | 2.0 | 876 | $1,100 | $1.26 | 44d | 1 | 1.38mi |
| 2204 Northridge Ave Unit 23 Harlingen, TX | 2.0 | 2.0 | 955 | $1,250 | $1.31 | 22d | 1 | 1.43mi |
| 2204 Northridge Ave Unit 2 Harlingen, TX | 2.0 | 2.0 | 955 | $1,250 | $1.31 | 44d | 1 | 1.43mi |
| 2218 Multi National Unit B Harlingen, TX | 2.0 | 2.0 | 877 | $1,100 | $1.25 | 14d | 1 | 1.44mi |
| 2211 Northridge Ave Unit C Harlingen, TX | 2.0 | 2.0 | 877 | $1,150 | $1.31 | 44d | 1 | 1.44mi |
| 20558 Alta Vista Ct Unit C Harlingen, TX | 2.0 | 2.0 | 970 | $1,125 | $1.16 | 44d | 1 | 1.44mi |
| 2219 Northridge Ave Harlingen, TX | 2.0 | 2.0 | 830 | $1,000 | $1.20 | 14d | 1 | 1.46mi |
| 20550 Alta Vista Ct Unit C Harlingen, TX | 2.0 | 2.0 | 970 | $1,125 | $1.16 | 44d | 1 | 1.46mi |
Listing history 13 events
-
2026-06-16status $79,700 Under Contract 31 DOM
-
2026-06-15days on market $79,700 Active 31 DOM
-
2026-06-14days on market $79,700 Active 29 DOM
-
2026-06-10days on market $79,700 Active 26 DOM
-
2026-06-09days on market $79,700 Active 25 DOM
-
2026-06-09days on market $79,700 Active 24 DOM
-
2026-06-07days on market $79,700 Active 23 DOM
-
2026-06-03days on market $79,700 Active 19 DOM
-
2026-06-02days on market $79,700 Active 18 DOM
-
2026-06-01days on market $79,700 Active 17 DOM
-
2026-05-31days on market $79,700 Active 16 DOM
-
2026-05-30days on market $79,700 Active 15 DOM
-
2026-05-16$79,700 Active
ⓘ Source: listings_history table (triggers on properties + properties_extension) + one-shot
backfill from property_details.listing_events for pre-trigger history.
Tax reassessment forecast TX · Resets to sale price
- Current annual tax
- $1,591 · $133/mo
- Projected year-2 tax
- $1,591 · $133/mo
- Expected delta
- $0/yr ($0/mo · 0.0%)
ⓘ Screening estimate from a state-policy table — verify with the county assessor before closing.
Climate risk First Street
- Flood 1/10 Low FEMA zone X (unshaded) · 0% chance over 30 yrs
- Wildfire 1/10 Low
- Heat 9/10 Extreme 7 d/yr ≥110°F today · 24 d/yr by 30 yrs out
- Wind 8/10 Severe 99% chance of damaging wind over 30 yrs
- Air quality 1/10 Low 0 unhealthy d/yr today · 0 by 30 yrs out
Nearby sold comps map
Loading sold comps map…
Walkable amenities ~0.75 mi
Loading nearby amenities…
Taxation est. · year 1
- Rental income
- $13,484
- − Mortgage interest
- −$4,464
- − Property taxes
- −$1,591
- − Insurance
- −$398
- − Repairs & maintenance
- −$1,079
- − Management
- −$1,079
- − Depreciation
- −$2,319
- Taxable income
- $2,554
- Est. tax owed @ 24.0%
- −$613
- After-tax cash flow
- $3,034/yr
For passive investors: Depreciation is non-cash, so a rental often shows a tax loss while cash-flowing — sheltering income. Rental losses are passive: they offset passive income freely, and up to $25,000/yr can offset ordinary (W-2) income if you actively participate and your MAGI is under $100k (phasing out to $0 by $150k); unused losses carry forward. On sale, claimed depreciation is recaptured at up to 25%, and gains may owe capital-gains tax (a 1031 exchange can defer both). Figures are a year-1 estimate at your 24.0% rate — not tax advice; consult a CPA.
Schools (NCES district)
- District
- Harlingen CISD
- NCES district ID
- 4822530
- Math proficiency
- 25% ▼ -28.00%
- Reading proficiency
- 35% ▼ -11.00%
- Median HH income
- $37,182
- Composite
- 24.94/100
- National rank
- #7566
- State rank
- #647 of 826 in TX
Livability — Harlingen
- Score
- 73/100
- State rank
- #217
- US rank
- #5347
Category grades
Schools grade is shown separately in the Schools card above.
Census & demographics
- Census place
- Harlingen, TX
- County
- Cameron County · 310,734 people
- City population
- 95,667
- Metro
- Brownsville-Harlingen, TX
- Population (ZIP)
- 53,335
- Household income
- $49,007
- Rent vs Own
- Severe rent burden
- 2251.0
Population outlook (Cameron County) Hauer SSP2
- Today (2025)
- 441,603 people
- By 2030
- 448,113 · +1.5%
- By 2040
- 456,385 · +3.3%
- By 2050
- 456,294 · +3.3%
- By 2075
- 423,851 · -4.0%
- By 2100
- 342,787 · -22.4%
Race, ethnicity, and origin ACS 2023
- Neighborhood character
- Predominantly Hispanic (83%)
- Race & ethnicity
- Hispanic / Latino 83% Two or more races 29% White 14% Black 1%
- Hispanic origin (detail)
- Mexican 76%
- Common ancestry
- Italian 1% Lithuanian 1%
- Foreign-born
- 14% · Canada
- Languages at home
- 51% English-only · Spanish 48%
Political lean MEDSL · Cameron
- 2024 margin
- Lean R (+5.8) · D 46.7% · R 52.5%
- 2008→2024 swing
- -34.6pp toward R · 2008: 28.8pp · 2024: -5.8pp
- All cycles
- 2024: R+5.8 2020: D+13.2 2016: D+32.5 2012: D+32.4 2008: D+28.8
Not yet ingested
- Civics
- —
Market trends
- HPI YoY
- ▼ -142.60%
- Current HPI
- 167.7038
- Rent YoY
- ▲ 3.45%
- Metro
- Brownsville-Harlingen, TX
- State GDP YoY
- ▲ 3.95%
- F500 in state
- 110
Industry mix (Fortune 500 HQ in TX)
| Industry | F500 HQs | Revenue |
|---|---|---|
| Energy | 16 | $1,198B |
|
||
| Technology | 5 | $198B |
|
||
| Engineering / Construction | 4 | $72B |
|
||
| Energy Services | 3 | $60B |
|
||
| Utilities | 3 | $41B |
|
||
| Healthcare | 2 | $330B |
|
||
Price history
1 event — show timeline
- 2026-05-16 Listed $79,700 FSBO.com
Property tax history
+9.9%/yrLatest (2025): $1,591 · +1.1% YoY. Source: county tax records.
Cash-flow waterfall
monthlySold comps — $/sqft
last 12 mo · ≤1 miLoading sold comps…