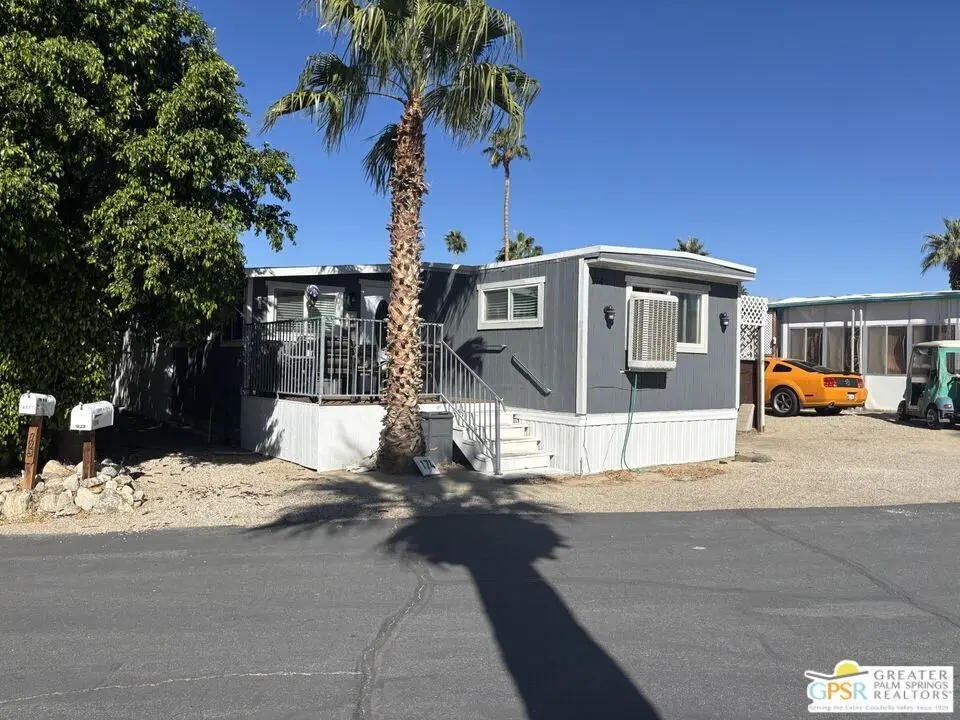
18801 Roberts Rd #174 · Desert Edge, CA
Flood risk 1/10 · Minimal
- FEMA flood zone
- X (unshaded)
- Chance of flooding over 30 yrs
- 0.0%
- Est. flood insurance / yr
- $507 – $1,088
Fire risk 5/10 · Moderate
- Est. fire insurance / yr
- $659 – $1,223
Heat risk 8/10 · Major
- Hot days now (above 109°F)
- 3 days/yr
- Hot days in 30 yrs
- 9 days/yr
Wind risk 1/10 · Minimal
- Chance of severe wind over 30 yrs
- —
Air-quality risk 5/10 · Moderate
- Unhealthy air days now
- 6 days/yr
- Unhealthy air days in 30 yrs
- 8 days/yr
Risk factors via First Street. Map © Google.
Why this score? — see what drove the B- grade
The composite is a weighted blend of 9 inputs, each scored 0–100. Each bar is that input's sub-score; the figure is the points it added to the 100-point composite (weight × sub-score).
- Cash flow +30.0/30.0
- 1% rule +10.0/10.0
- DSCR +10.0/10.0
- ARV discount +7.5/15.0
- Livability +3.4/5.0
- Schools +2.7/10.0
- Rent growth +2.5/5.0
- Condition / age +2.5/5.0
- Appreciation +0.0/10.0
$85,000
🖨 Deal sheet 📄 Offer letter ✓ Due diligence
Listing remarks MLS
Welcome to the peace and tranquility of desert living in Wagner Mobile Home Park, a 55+ senior community with hot and cold mineral pools. This 2 bedroom, 1 bath expanded beauty will win you over with it's open concept living space. There is so much room to entertain friends and family. The more than spacious kitchen boasts updated appliances, counter tops, and cabinets, plus you can enjoy mealtime at the cozy corner nook or the convenient breakfast bar. Relaxing is easy in the light and bright living room. The outdoor patio is perfect to enjoy the desert ambiance while sipping your morning coffee or an evening glass of wine. There is a large shed for storage, that includes a washer/dryer, and can be accessed from inside our outside. Don't miss checking this one out!
Key facts
- 2 parking spots
- Community pool
- Built 1971
Neighborhood map
What this means for you Summary
Snapshot
- This is a 2-bed/1.0-bath manufactured listed at $85k.
Deal economics
- At list price, monthly cash flow is $611 ($7k/yr) — positive.
- The deal already cash-flows at list — no discount required.
- Meets the 1% rule at list price ($2k rent vs $85k).
- Recommended offer: $75k (12.0% below list) — sets the bar for market timing.
Location & tenants
- Location reads 68/100 on livability (#297 in CA) — a middle-class / working-renter tenant base. Strengths: cost of living A+, housing A+; Watch: crime C-, schools F, commute D-.
- Palm Springs Unified (suburban): math 21% / reading 42% proficiency, ranked #328 of 517 in CA (top 63%) — families likely to look elsewhere, expect single-tenant / working-renter base with shorter leases; 73% free/reduced lunch — lower-income household profile, screen leases tightly.
- Market conditions: 216 active listings in the ZIP; 1 comparable units currently listed for rent nearby; 9,195 units permitted in Riverside County in 2024 (1,512 in 5+ unit buildings).
Forward outlook
- Local home prices are declining (-3.0%/yr); year-one equity from $588 of loan paydown is wiped out by about $3k of value loss. Plan a longer hold.
- Riverside County population projected at +22% by 2050 — long-run rental-demand tailwind backs the buy-and-hold thesis.
- At projected returns (-3.0% appreciation + 3.0% rent growth), your $24k cash investment doubles in ~4 years — after that, you're playing with house money.
Negotiation context
- It's been on market 586 days — a 12% lower offer ($75k) is reasonable based on typical stale-listing flexibility.
Risks & watch-outs
- Watch-outs: HOA is 25% of rent.
- Climate carrying-cost: moderate wildfire risk; extreme-heat days projected 3→9/yr by 2055 (HVAC capex compounding) — expect insurance premiums to compound above CPI over the hold.
Questions for the listing agent
- It's been on market 586 days. Have you received any prior offers? Is the seller open to a 12% concession, seller financing, or rate buy-down credit?
- Built in 1971 — when were the roof, HVAC, electrical panel, plumbing, and water heater last replaced?
- What does the HOA fee cover, when was the last increase, and are there any pending special assessments or reserve-fund shortfalls?
- Why hasn't it sold? Are there any deal-killer items the seller is aware of (foundation, flood, title, zoning, code violations)?
- Is there a deadline driving the sale (1031 exchange, divorce, estate, relocation)? That informs how much negotiation room exists.
- Schools are F-rated, which usually means shorter tenancies and higher turnover. Who's the typical renter profile here, and what's been the actual vacancy rate?
- What's the average days-on-market for RENTAL listings here right now (not sales)? A rising rental-DOM trend means longer vacancies and softer asking-rent achievability than the comps imply.
- What's the recent tenant-quality profile in this submarket — average credit score on applications, eviction rate, late-payment / NSF rate, and stable-employment percentage? A property-management company in the area should have these aggregated.
- How much new for-sale + rental construction is in the pipeline within 1–3 miles? Heavy new supply typically softens prices + rents 12–24 months out; constrained supply supports both.
Investment metrics
- 1% rule
- 2.59% ✓
- Cap rate
- 14.91%
- Cash-on-cash
- 30.79%
- DSCR
- 2.37
- GRM
- 3.2
CMA / ARV
- ARV (median comp)
- $33,497
- List price
- $85,000
- Delta
- 153.75%
- Verdict
- OVERPRICED
- Comps
- 9 within 1.0 mi
Show comp detail 8 sales within ~0.75 mi
| Address | Dist | Beds/Ba | Sqft | Sold | Price | $/sf | Match |
|---|---|---|---|---|---|---|---|
| 18801 Roberts Rd #86 | 0.09mi | 2/1.0 | 720 (0%) | 8mo | $30,000 | $42 | 89 |
| 18801 Roberts Rd #171 | 0.09mi | 2/1.0 | 724 (+1%) | 11mo | $35,000 | $48 | 86 |
| 18555 Roberts Rd #84 | 0.12mi | 2/1.0 | 720 (0%) | 17mo | $40,000 | $56 | 81 |
| 18801 Roberts Rd #83 | 0.09mi | 2/1.0 | 700 (-3%) | 17mo | $12,500 | $18 | 78 |
| 18801 Roberts Rd #51 | 0.09mi | 2/2.0 | 672 (-7%) | 8mo | $55,000 | $82 | 74 |
| 17625 Langlois #9 | 0.67mi | 2/1.0 | 700 (-3%) | 3mo | $15,000 | $21 | 62 |
| 18131 Langlois Rd Unit S15 | 0.35mi | 2/1.0 | 820 (+14%) | 2mo | $75,000 | $91 | 59 |
| 18801 Roberts Rd #99 | 0.09mi | 1/1.0 (-1) | 648 (-10%) | 20mo | $31,000 | $48 | 58 |
Match score weights: distance 35% · size 25% · config 20% · recency 20%. Top-matched comps best support the ARV.
Projected returns pro-forma
-3.0% appreciation · 3.0% rent growth · sell at horizon
- IRR
- 25.8%
- Equity multiple
- 2.07×
- Total profit
- $25,480
- Equity at exit
- $12,674
- IRR
- 33.6%
- Equity multiple
- 4.10×
- Total profit
- $73,745
- Equity at exit
- $7,349
Cash invested: $23,800 (down + closing). Projections, not guarantees.
Landlord ↔ Tenant lean methodology
- Overall (STATE)
- 18 Strongly Tenant-Friendly
- State California
- 18 Strongly Tenant-Friendly · D+13
- County
- — inherits STATE
- City
- — inherits STATE
ZIP-level market 92241
- Home prices YoY
- -22.8%
- Active inventory
- 216
- Price-to-rent
- 3.2×
Monthly cashflow live
- Estimated rent
- $2,200 medium interval (Pro) →
- Mortgage (P&I)
- −$446
- Tax est. 1.5%
- −$106 /mo · $1,275/yr
- Insurance
- −$35
- HOA
- −$540
- Vacancy / Maint / Mgmt
- −$462
- Net cashflow
- $611
Break-even live
UW: 25.0% down · 7.5% · 30yr · 1.5% tax · 5.0% vac · 8.0% maint · 8.0% mgmt
Financing live
Cash to close
- Down payment
- $21,250
- Closing costs
- $2,550
- Reserves months
- —
- Total cash needed
- —
Loan-product check · same deal, 3 products live
Conventional
25% down · 7.5% · 30yr
- Down + closing
- —
- Monthly P&I
- —
- Monthly cashflow
- —
- DSCR
- —
- Eligible?
- —
Personal DTI + credit; lowest rate.
DSCR
20% down · 8.5% · 30yr
- Down + closing
- —
- Monthly P&I
- —
- Monthly cashflow
- —
- DSCR
- —
- Eligible?
- —
No personal income docs; deal must DSCR.
Hard money
10% down · 12.0% · 12mo
- Down + closing
- —
- Monthly P&I
- —
- Monthly cashflow
- —
- DSCR
- —
- Eligible?
- —
Short-term bridge; refi at stabilization.
Rent comps 1 comps
| Address | Beds | Baths | Sqft | Rent | $/sqft | DOM | Units | Dist |
|---|---|---|---|---|---|---|---|---|
| 70875 Dillon Rd Desert Hot Springs, CA | 2.0 | 2.0 | 720 | $2,200 | $3.06 | 43d | 1 | 0.87mi |
HOA detail
- Monthly dues
- $540 · $6,480/yr
- Likely covers
- pool
Listing history 15 events
-
2026-06-18days on market $85,000 Active 586 DOM
-
2026-06-17days on market $85,000 Active 585 DOM
-
2026-06-16days on market $85,000 Active 584 DOM
-
2026-06-15days on market $85,000 Active 583 DOM
-
2026-06-13days on market $85,000 Active 581 DOM
-
2026-06-13days on market $85,000 Active 580 DOM
-
2026-06-09days on market $85,000 Active 577 DOM
-
2026-06-08days on market $85,000 Active 576 DOM
-
2026-06-07days on market $85,000 Active 575 DOM
-
2026-06-04days on market $85,000 Active 572 DOM
-
2026-06-03days on market $85,000 Active 571 DOM
-
2026-06-02days on market $85,000 Active 570 DOM
-
2026-06-01days on market $85,000 Active 569 DOM
-
2026-05-31days on market $85,000 Active 568 DOM
-
2024-11-08$85,000 Active 776-char remark
Show marketing remark (776 chars)
Welcome to the peace and tranquility of desert living in Wagner Mobile Home Park, a 55+ senior community with hot and cold mineral pools. This 2 bedroom, 1 bath expanded beauty will win you over with it's open concept living space. There is so much room to entertain friends and family. The more than spacious kitchen boasts updated appliances, counter tops, and cabinets, plus you can enjoy mealtime at the cozy corner nook or the convenient breakfast bar. Relaxing is easy in the light and bright living room. The outdoor patio is perfect to enjoy the desert ambiance while sipping your morning coffee or an evening glass of wine. There is a large shed for storage, that includes a washer/dryer, and can be accessed from inside our outside. Don't miss checking this one out!
ⓘ Source: listings_history table (triggers on properties + properties_extension) + one-shot
backfill from property_details.listing_events for pre-trigger history.
Climate risk First Street
- Flood 1/10 Low FEMA zone X (unshaded) · 0% chance over 30 yrs
- Wildfire 5/10 Major
- Heat 8/10 Severe 3 d/yr ≥109°F today · 9 d/yr by 30 yrs out
- Wind 1/10 Low
- Air quality 5/10 Major 6 unhealthy d/yr today · 8 by 30 yrs out
Nearby sold comps map
Loading sold comps map…
Walkable amenities ~0.75 mi
Loading nearby amenities…
Taxation est. · year 1
- Rental income
- $26,400
- − Mortgage interest
- −$4,761
- − Property taxes
- −$1,275
- − Insurance
- −$425
- − Repairs & maintenance
- −$2,112
- − Management
- −$2,112
- − HOA
- −$6,480
- − Depreciation
- −$2,473
- Taxable income
- $6,762
- Est. tax owed @ 24.0%
- −$1,623
- After-tax cash flow
- $5,704/yr
For passive investors: Depreciation is non-cash, so a rental often shows a tax loss while cash-flowing — sheltering income. Rental losses are passive: they offset passive income freely, and up to $25,000/yr can offset ordinary (W-2) income if you actively participate and your MAGI is under $100k (phasing out to $0 by $150k); unused losses carry forward. On sale, claimed depreciation is recaptured at up to 25%, and gains may owe capital-gains tax (a 1031 exchange can defer both). Figures are a year-1 estimate at your 24.0% rate — not tax advice; consult a CPA.
Schools (NCES district)
- District
- Palm Springs Unified
- NCES district ID
- 0629550
- Math proficiency
- 21% ▼ -7.00%
- Reading proficiency
- 42% ▬ 0.00%
- Median HH income
- $43,638
- Composite
- 26.76/100
- National rank
- #7131
- State rank
- #328 of 517 in CA
Livability — Desert Edge
- Score
- 68/100
- State rank
- #297
- US rank
- #9953
Category grades
Schools grade is shown separately in the Schools card above.
Census & demographics
- Census place
- Desert Edge, CA
- Population (ZIP)
- 8,624
Population outlook (Riverside County) Hauer SSP2
- Today (2025)
- 2,664,475 people
- By 2030
- 2,802,692 · +5.2%
- By 2040
- 3,050,904 · +14.5%
- By 2050
- 3,256,783 · +22.2%
- By 2075
- 3,655,058 · +37.2%
- By 2100
- 3,766,594 · +41.4%
Race, ethnicity, and origin ACS 2023
- Race & ethnicity
- White 50% Hispanic / Latino 46% Two or more races 16% Asian 2% Native American 1%
- Hispanic origin (detail)
- Mexican 36%
- Common ancestry
- Lithuanian 3% Slovak 2% Portuguese 2%
- Foreign-born
- 28% · Canada, South Korea
- Languages at home
- 57% English-only · Spanish 38% Chinese 1% Russian/Polish/Slavic 1%
Political lean MEDSL · Riverside
- 2024 margin
- Toss-up / Even · D 48.0% · R 49.3% · Other 2.6%
- 2008→2024 swing
- -3.6pp toward R · 2008: 2.3pp · 2024: -1.3pp
- All cycles
- 2024: R+1.3 2020: D+8.0 2016: D+4.3 2012: R+0.4 2008: D+2.3
Not yet ingested
- Civics
- —
Market trends
- HPI YoY
- ▼ -118.23%
- Current HPI
- 400.5663
- Rent YoY
- —
- Metro
- —
- State GDP YoY
- ▲ 3.21%
- F500 in state
- 116
Industry mix (Fortune 500 HQ in CA)
| Industry | F500 HQs | Revenue |
|---|---|---|
| Technology | 27 | $1,492B |
|
||
| Financial Services | 3 | $174B |
|
||
| Retail | 3 | $44B |
|
||
| Insurance | 3 | $26B |
|
||
| Media / Entertainment | 2 | $115B |
|
||
| Pharmaceuticals / Biotech | 2 | $62B |
|
||
Price history
1 event — show timeline
- 2024-11-08 Listed $85,000 TheMLS
Property tax history
+84.9%/yrLatest (2025): $88 · -2.1% YoY. Source: county tax records.
Cash-flow waterfall
monthlySold comps — $/sqft
last 12 mo · ≤1 miLoading sold comps…