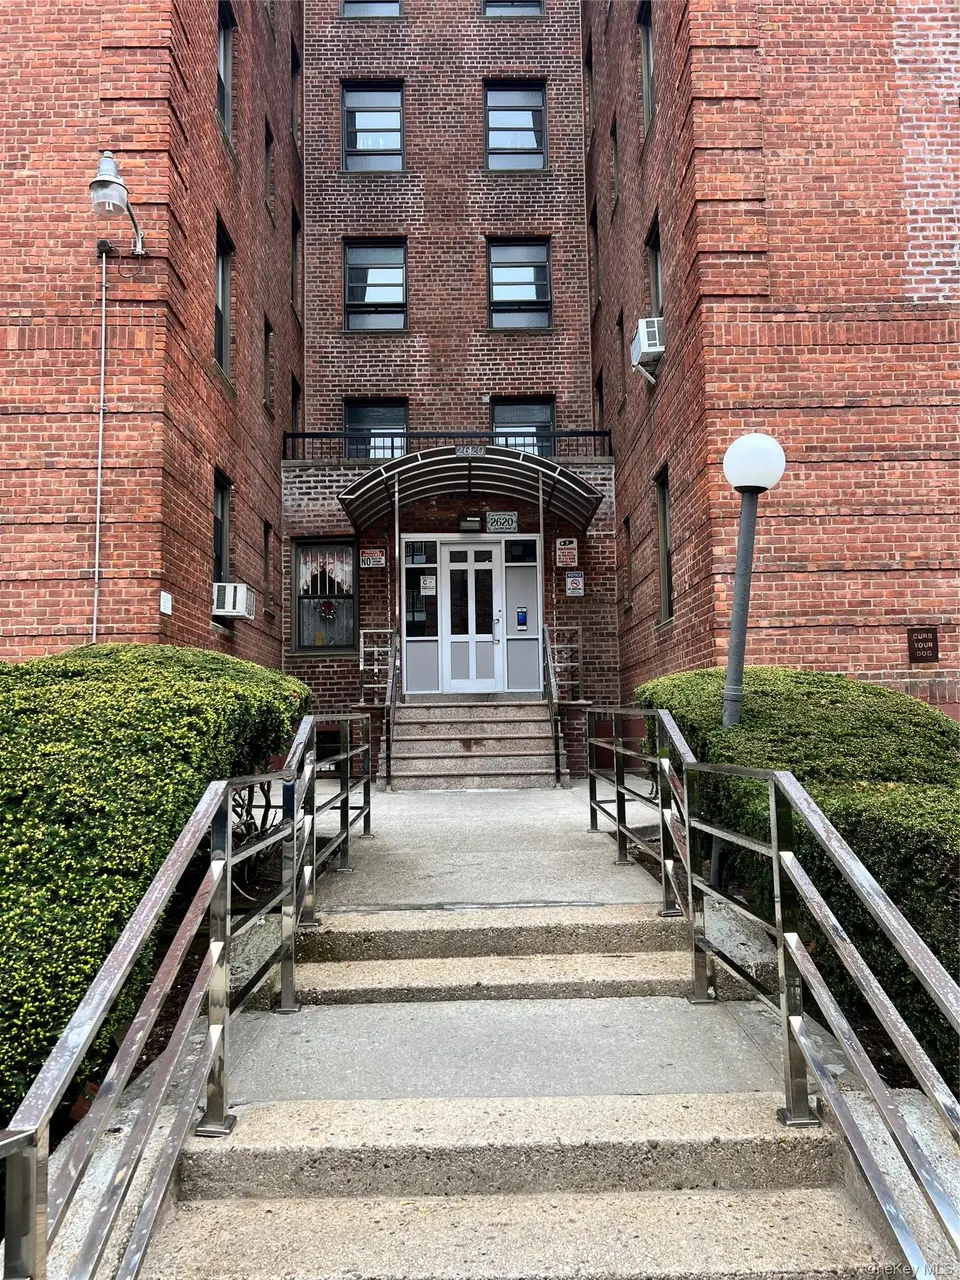
2620 E 13th St Unit 3A · New York, NY
Flood risk 6/10 · Moderate
- FEMA flood zone
- X (shaded)
- Chance of flooding over 30 yrs
- 0.58%
- Est. flood insurance / yr
- $507 – $1,088
Fire risk 1/10 · Minimal
- Est. fire insurance / yr
- $691 – $1,283
Heat risk 7/10 · Major
- Hot days now (above 97°F)
- 7 days/yr
- Hot days in 30 yrs
- 15 days/yr
Wind risk 6/10 · Moderate
- Chance of severe wind over 30 yrs
- 72.0%
Air-quality risk 4/10 · Minor
- Unhealthy air days now
- 5 days/yr
- Unhealthy air days in 30 yrs
- 7 days/yr
Risk factors via First Street. Map © Google.
Why this score? — see what drove the C+ grade
The composite is a weighted blend of 9 inputs, each scored 0–100. Each bar is that input's sub-score; the figure is the points it added to the 100-point composite (weight × sub-score).
- Cash flow +26.6/30.0
- DSCR +9.1/10.0
- ARV discount +7.5/15.0
- 1% rule +7.2/10.0
- Schools +5.0/10.0
- Rent growth +3.8/5.0
- Livability +3.8/5.0
- Condition / age +1.0/5.0
- Appreciation +0.0/10.0
$329,000
🖨 Deal sheet 📄 Offer letter ✓ Due diligence
Listing remarks
Welcome home to this spacious 3-bedroom, 1-bathroom top-floor co-op in the heart of Sheepshead Bay. Situated in a well-maintained building, this home offers a fantastic opportunity to create your ideal living space. With generous room sizes and great potential, it's ready for your personal touch and updates. Conveniently located near the B and Q subway lines, local bus routes, shopping, supermarkets, restaurants, and all that the Bay and nearby waterfront have to offer. Enjoy the best of this vibrant neighborhood with easy access to everyday essentials and transportation. Bring your vision and make this home your own!
Key facts
- Garage
- Built 1960
- Listed 5 days
Property features AI
Exterior
- Parking: 1-car garage; No carport; Parking features: Waitlist
- Utilities: Public sewer; Electricity available
- Home design: Stock cooperative; 3 stories total; Entry on level 1
- Construction: Brick construction
- Exterior features: Brick exterior; Not waterfront
Interior
- Kitchen: No appliances included
- Bathrooms: 1 full bathroom
- Heating & cooling: Wall/Window air conditioning; Natural gas heating; Steam heating; Other heating
- Interior features: Other interior features
Neighborhood map
What this means for you Summary
Snapshot
- This is a 3-bed/1.0-bath condo listed at $329k. Condition is rated poor.
Deal economics
- At list price, monthly cash flow is $885 ($11k/yr) — positive.
- The deal already cash-flows at list — no discount required.
- Meets the 1% rule at list price ($4k rent vs $329k).
- Cap rate 9.5% vs local median 2.6% in New York — top-decile yield for the area; either an underpriced asset or a hidden risk that comps aren't pricing in. Stress-test before assuming the spread holds.
Location & tenants
- Location reads 75/100 on livability (#268 in NY, #4,188 nationally) — a middle-class / working-renter tenant base. Strengths: amenities A+, commute A+, health & safety A; Watch: crime F, cost of living F.
- Market conditions: Rents rising fast (+5.0%/yr); 521 active listings in the ZIP; 13 comparable units currently listed for rent nearby; rentals at typical pace (median 25d on market — plan ~3-4 weeks tenant-placement turnaround); 10,063 units permitted in Kings County in 2024 (9,789 in 5+ unit buildings).
- At $3,998/mo this rent would consume 80% of the median local household income ($60k/yr) (locally 7823% of renters already pay >50% of income on rent) — very limited rent-growth headroom before tenants either downsize or default.
Forward outlook
- Local home prices are declining (-3.0%/yr); year-one equity from $2k of loan paydown is wiped out by about $10k of value loss. Plan a longer hold.
- Kings County population projected at +13% by 2050 — modest demand growth; plan on rents tracking national, not racing it.
- At projected returns (-3.0% appreciation + 5.0% rent growth), your $92k cash investment doubles in ~8 years — after that, you're playing with house money.
Negotiation context
- Only 6 days on market — expect competitive offers; lowballing is unlikely to land.
Risks & watch-outs
- Climate carrying-cost: major flood risk; major wind risk, 72% chance of damaging wind over 30y; extreme-heat days projected 7→15/yr by 2055 (HVAC capex compounding) — expect insurance premiums to compound above CPI over the hold.
Questions for the listing agent
- Have any recent inspections been done? Can we get a copy of the seller's disclosures and any deferred-maintenance estimates?
- Built in 1960 — when were the roof, HVAC, electrical panel, plumbing, and water heater last replaced?
- Any open or pending special assessments — roof, HVAC, plumbing, elevator, façade? What's the per-unit balance and payoff schedule, and is the seller paying it off at close or rolling it to the buyer?
- Is there a deadline driving the sale (1031 exchange, divorce, estate, relocation)? That informs how much negotiation room exists.
- Schools are B-rated — typically a magnet for longer-tenancy family renters. What's the average tenant stay here, and is there a school-zone premium baked into asking?
- Crime grade is F in this area — have there been break-ins, vandalism, or insurance claims at this property in the last 3 years? What carrier currently insures it and at what premium?
- What's the average days-on-market for RENTAL listings here right now (not sales)? A rising rental-DOM trend means longer vacancies and softer asking-rent achievability than the comps imply.
- What's the recent tenant-quality profile in this submarket — average credit score on applications, eviction rate, late-payment / NSF rate, and stable-employment percentage? A property-management company in the area should have these aggregated.
- How much new apartment / multifamily construction is in the pipeline within 1–3 miles? Heavy new supply (>2% of stock underway) typically softens rents 12–24 months out; light construction supports rent growth.
Investment metrics
- 1% rule
- 1.22% ✓
- Cap rate
- 9.52%
- Cash-on-cash
- 11.53%
- DSCR
- 1.51
- GRM
- 6.9
CMA / ARV
No comps found within radius.
Projected returns pro-forma
-3.0% appreciation · 5.04% rent growth · sell at horizon
- IRR
- 3.2%
- Equity multiple
- 1.12×
- Total profit
- $11,477
- Equity at exit
- $49,055
- IRR
- 14.6%
- Equity multiple
- 2.29×
- Total profit
- $118,629
- Equity at exit
- $28,446
Cash invested: $92,120 (down + closing). Projections, not guarantees.
Landlord ↔ Tenant lean methodology
- Overall (CITY)
- 0 Strongly Tenant-Friendly
- State New York
- 15 Strongly Tenant-Friendly · D+10
- County
- — inherits STATE
- City New York
- 0 Strongly Tenant-Friendly · D+34
ZIP-level market 11235
- Rents YoY
- 5.0%
- Active inventory
- 521
- Price-to-rent
- 6.9×
Monthly cashflow live
- Estimated rent
- $3,998 high interval (Pro) →
- Mortgage (P&I)
- −$1,725
- Tax est. 1.5%
- −$411 /mo · $4,935/yr
- Insurance
- −$137
- HOA
- −$0
- Vacancy / Maint / Mgmt
- −$840
- Net cashflow
- $885
Break-even live
UW: 25.0% down · 7.5% · 30yr · 1.5% tax · 5.0% vac · 8.0% maint · 8.0% mgmt
Financing live
Cash to close
- Down payment
- $82,250
- Closing costs
- $9,870
- Reserves months
- —
- Total cash needed
- —
Loan-product check · same deal, 3 products live
Conventional
25% down · 7.5% · 30yr
- Down + closing
- —
- Monthly P&I
- —
- Monthly cashflow
- —
- DSCR
- —
- Eligible?
- —
Personal DTI + credit; lowest rate.
DSCR
20% down · 8.5% · 30yr
- Down + closing
- —
- Monthly P&I
- —
- Monthly cashflow
- —
- DSCR
- —
- Eligible?
- —
No personal income docs; deal must DSCR.
Hard money
10% down · 12.0% · 12mo
- Down + closing
- —
- Monthly P&I
- —
- Monthly cashflow
- —
- DSCR
- —
- Eligible?
- —
Short-term bridge; refi at stabilization.
Rent comps 13 comps
| Address | Beds | Baths | Sqft | Rent | $/sqft | DOM | Units | Dist |
|---|---|---|---|---|---|---|---|---|
| 2538 E 2nd St Unit 2 Brooklyn, NY | 3.0 | 1.0 | 1100 | $2,600 | $2.36 | 24d | 1 | 0.64mi |
| 3000 Ocean Pkwy Brooklyn, NY | 2.0 | 2.0 | 1130 | $3,775 | $3.34 | 18d | 2 | 0.93mi |
| 3000 Emmons Ave Unit 5 Brooklyn, NY | 2.0 | 2.0 | 840 | $4,085 | $4.86 | 24d | 1 | 0.97mi |
| 532 Neptune Ave Brooklyn, NY | 1.0–3.0 | 1.0–2.0 | 948 | $5,725 | $6.04 | 7d | 8 | 1.10mi |
| 2957 Shell Rd Brooklyn, NY | 3.0 | 2.0 | 1292 | $5,550 | $4.30 | 24d | 1 | 1.12mi |
| 2971 Shell Rd Unit 720 Brooklyn, NY | 2.0 | 2.0 | 920 | $4,100 | $4.46 | 24d | 1 | 1.13mi |
| 2971 Shell Rd Unit 704 Brooklyn, NY | 2.0 | 1.0 | 826 | $3,950 | $4.78 | 24d | 1 | 1.13mi |
| 2971 Shell Rd Unit 612 Brooklyn, NY | 2.0 | 2.0 | 907 | $4,150 | $4.58 | 24d | 1 | 1.13mi |
| 2971 Shell Rd Unit 508 Brooklyn, NY | 2.0 | 2.0 | 930 | $4,099 | $4.41 | 24d | 1 | 1.13mi |
| 2971 Shell Rd Unit 406 Brooklyn, NY | 2.0 | 2.0 | 920 | $3,550 | $3.86 | 24d | 1 | 1.13mi |
| 2971 Shell Rd Unit 602 Brooklyn, NY | 3.0 | 2.0 | 1301 | $5,299 | $4.07 | 24d | 1 | 1.13mi |
| 2971 Shell Rd Unit 711 Brooklyn, NY | 2.0 | 2.0 | 907 | $4,200 | $4.63 | 24d | 1 | 1.13mi |
| 2002 E 29th St Unit 2F Brooklyn, NY | 4.0 | 1.5 | 1500 | $3,600 | $2.40 | 24d | 1 | 1.25mi |
HOA detail condo
- Monthly dues
- $0 · $0/yr
- Likely covers
- water
- Assessments
- None detected in remarks — confirm with the listing agent.
Listing history 9 events
-
2026-06-18days on market $329,000 Active 6 DOM
-
2026-06-17days on market $329,000 Active 5 DOM
-
2026-06-16days on market $329,000 Active 4 DOM
-
2026-06-15days on market $329,000 Active 3 DOM
-
2026-06-13statusdays on market $329,000 Active 1 DOM
-
2026-06-09days on market $329,000 Coming Soon 2 DOM
-
2026-06-08remarks 625-char remark
-
2026-06-08remarks 243-char remark
-
2026-06-08$329,000 Coming Soon 1 DOM
ⓘ Source: listings_history table (triggers on properties + properties_extension) + one-shot
backfill from property_details.listing_events for pre-trigger history.
Climate risk First Street
- Flood 6/10 Major FEMA zone X (shaded) · 58% chance over 30 yrs
- Wildfire 1/10 Low
- Heat 7/10 Severe 7 d/yr ≥97°F today · 15 d/yr by 30 yrs out
- Wind 6/10 Major 72% chance of damaging wind over 30 yrs
- Air quality 4/10 Moderate 5 unhealthy d/yr today · 7 by 30 yrs out
Nearby sold comps map
Loading sold comps map…
Walkable amenities ~0.75 mi
Loading nearby amenities…
Taxation est. · year 1
- Rental income
- $47,977
- − Mortgage interest
- −$18,429
- − Property taxes
- −$4,935
- − Insurance
- −$1,645
- − Repairs & maintenance
- −$3,838
- − Management
- −$3,838
- − Depreciation
- −$9,571
- Taxable income
- $5,721
- Est. tax owed @ 24.0%
- −$1,373
- After-tax cash flow
- $9,245/yr
For passive investors: Depreciation is non-cash, so a rental often shows a tax loss while cash-flowing — sheltering income. Rental losses are passive: they offset passive income freely, and up to $25,000/yr can offset ordinary (W-2) income if you actively participate and your MAGI is under $100k (phasing out to $0 by $150k); unused losses carry forward. On sale, claimed depreciation is recaptured at up to 25%, and gains may owe capital-gains tax (a 1031 exchange can defer both). Figures are a year-1 estimate at your 24.0% rate — not tax advice; consult a CPA.
Condition & rehab AI · 2 photos
This property requires extensive repairs and improvements to its roof, exterior siding, HVAC system, and landscaping. Significant investment is needed to bring the property up to a livable condition.
Repairs flagged
- Major roof — The roof appears to be old and possibly leaking.
- Major exterior siding — The siding appears to be in poor condition with visible wear and tear.
- Major HVAC/mechanicals — The overall condition suggests they may be outdated or in need of repair.
- Major landscaping — The landscaping appears to be minimal and in poor condition, with some overgrown areas and lack of maintenance.
Value-add opportunities
- Both new roof — A new roof would significantly improve the property's appearance and functionality.
- Both exterior siding repair — Repairing the exterior siding would improve the property's appearance and increase its value.
- Both HVAC upgrade — Upgrading the HVAC system would improve the comfort and energy efficiency of the property.
- Both landscaping and curb appeal — Improving the landscaping and curb appeal would enhance the property's overall appearance and increase its value.
Renovation cost estimate screening
| Repair item | Severity | Est. cost |
|---|---|---|
| roof · The roof appears to be old and possibly leaking. | Major | $15,000–50,000 |
| exterior siding · The siding appears to be in poor condition with visible wear and tear. | Major | $15,000–50,000 |
| HVAC/mechanicals · The overall condition suggests they may be outdated or in need of repair. | Major | $15,000–50,000 |
| landscaping · The landscaping appears to be minimal and in poor condition, with some overgrown areas and lack of maintenance. | Major | $15,000–50,000 |
| Total estimated repair cost · 4 items | $60,000–200,000 |
Value-add ROI direction
- Both new roof — A new roof would significantly improve the property's appearance and functionality. ↑
- Both exterior siding repair — Repairing the exterior siding would improve the property's appearance and increase its value. ↑
- Both HVAC upgrade — Upgrading the HVAC system would improve the comfort and energy efficiency of the property. ↑
- Both landscaping and curb appeal — Improving the landscaping and curb appeal would enhance the property's overall appearance and increase its value. ↑
ⓘ Cost ranges are severity-bucket heuristics (US national rule-of-thumb). Get contractor quotes + a written scope before underwriting a rehab budget.
Schools (NCES district)
No district data.
Livability — New York
- Score
- 75/100
- State rank
- #268
- US rank
- #4188
Category grades
Schools grade is shown separately in the Schools card above.
Census & demographics
- Census place
- New York, NY
- County
- Kings County · 2,614,986 people
- City population
- 7,731,280
- Metro
- New York-Newark-Jersey City, NY-NJ-PA
- Population (ZIP)
- 78,558
- Household income
- $59,661
- Rent vs Own
- Severe rent burden
- 7823.0
Population outlook (Kings County) Hauer SSP2
- Today (2025)
- 2,847,441 people
- By 2030
- 2,937,006 · +3.1%
- By 2040
- 3,095,491 · +8.7%
- By 2050
- 3,228,968 · +13.4%
- By 2075
- 3,321,723 · +16.7%
- By 2100
- 3,111,387 · +9.3%
Race, ethnicity, and origin ACS 2023
- Neighborhood character
- Predominantly White (67%)
- Race & ethnicity
- White 67% Asian 15% Two or more races 9% Hispanic / Latino 9% Black 3%
- Hispanic origin (detail)
- Mexican 3% Puerto Rican 3%
- Common ancestry
- Scotch-Irish 15% Subsaharan African 12% Romanian 2%
- Foreign-born
- 63% · China, Canada, Vietnam
- Languages at home
- 24% English-only · Russian/Polish/Slavic 48% Chinese 7% Spanish 7%
Political lean MEDSL · Kings
- 2024 margin
- Solid D (+44.0) · D 72.0% · R 28.0%
- 2008→2024 swing
- -15.5pp toward R · 2008: 59.4pp · 2024: 44.0pp
- All cycles
- 2024: D+44.0 2020: D+54.8 2016: D+61.8 2012: D+63.9 2008: D+59.4
Not yet ingested
- Civics
- —
Market trends
- HPI YoY
- ▼ -181.73%
- Current HPI
- 303.6714
- Rent YoY
- ▲ 5.04%
- Metro
- New York-Newark-Jersey City, NY-NJ-PA
- State GDP YoY
- ▲ 2.60%
- F500 in state
- 92
Industry mix (Fortune 500 HQ in NY)
| Industry | F500 HQs | Revenue |
|---|---|---|
| Financial Services | 10 | $950B |
|
||
| Consumer Goods | 9 | $162B |
|
||
| Insurance | 4 | $225B |
|
||
| Telecommunications | 2 | $144B |
|
||
| Pharmaceuticals | 2 | $112B |
|
||
| Media / Entertainment | 2 | $69B |
|
||
Price history
1 event — show timeline
- 2026-06-07 Coming Soon $329,000 OneKey® MLS as Distributed by MLS Grid
Cash-flow waterfall
monthlySold comps — $/sqft
last 12 mo · ≤1 miLoading sold comps…