 🏷️ Likely Rental
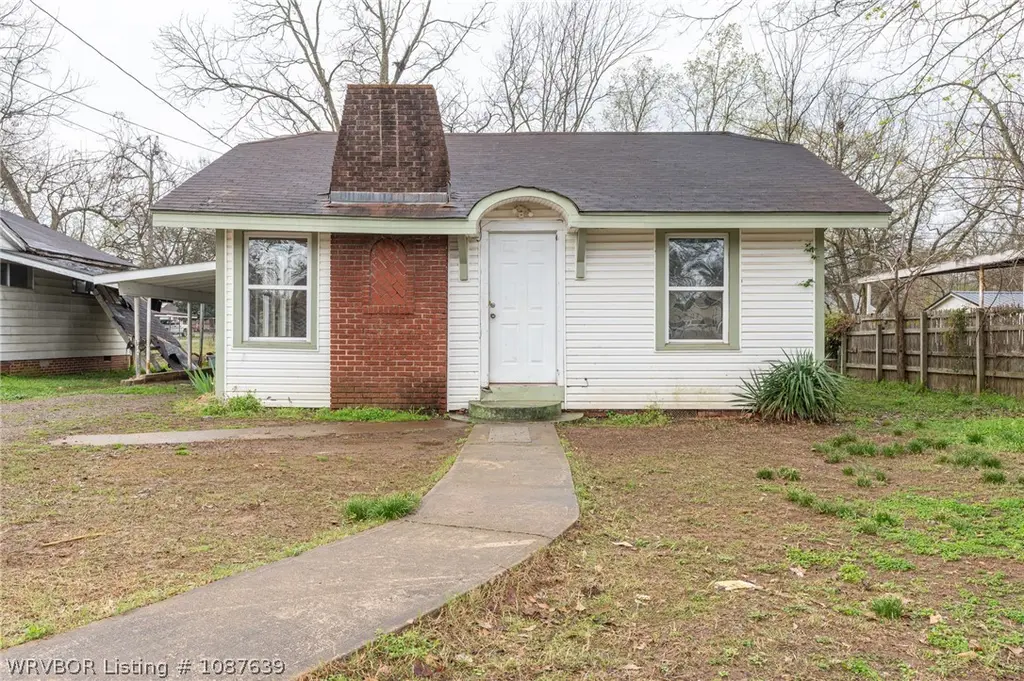
706 E Short Mountain St · Paris, AR
Flood risk No data
- FEMA flood zone
- —
- Chance of flooding over 30 yrs
- —
- Est. flood insurance / yr
- —
Fire risk No data
- Est. fire insurance / yr
- —
Heat risk No data
- Hot days now (above threshold)
- —
- Hot days in 30 yrs
- —
Wind risk No data
- Chance of severe wind over 30 yrs
- —
Air-quality risk No data
- Unhealthy air days now
- —
- Unhealthy air days in 30 yrs
- —
Risk factors via First Street. Map © Google.
Why this score? — see what drove the B+ grade
The composite is a weighted blend of 9 inputs, each scored 0–100. Each bar is that input's sub-score; the figure is the points it added to the 100-point composite (weight × sub-score).
- Cash flow +30.0/30.0
- ARV discount +15.0/15.0
- DSCR +10.0/10.0
- 1% rule +9.7/10.0
- Livability +3.5/5.0
- Schools +3.2/10.0
- Rent growth +2.5/5.0
- Condition / age +2.5/5.0
- Appreciation +0.0/10.0
$59,900
🖨 Deal sheet (PDF) 📄 Offer letter ✓ Due diligence
Listing remarks MLS
This home offers great potential for the right buyer. With charming curb appeal and a few updates already in place, this property is ready for someone to step in and make it their own. After a long-term tenant recently moved out, the home will need some TLC, but the possibilities here are endless. Whether you're looking for a renovation project, investment property, or a home you can customize to your own style, this property offers a great opportunity to build equity. With a little vision and some updates, this home could truly shine again. Property is being sold As-Is.
Key facts
- 5,227 sq ft lot
- Listed 97 days
Neighborhood map
What this means for you Summary
Snapshot
- This is a 2-bed/1.0-bath single-family listed at $60k.
Deal economics
- At list price, monthly cash flow is $329 ($4k/yr) — positive.
- The deal already cash-flows at list — no discount required.
- Meets the 1% rule at list price ($880 rent vs $60k).
- Recommended offer: $55k (9.0% below list) — sets the bar for market timing.
- Cap rate 12.9% vs local median 5.6% in Paris — top-decile yield for the area; either an underpriced asset or a hidden risk that comps aren't pricing in. Stress-test before assuming the spread holds.
Location & tenants
- Location reads 69/100 on livability (#68 in AR) — a middle-class / working-renter tenant base. Strengths: cost of living A+, housing A+, health & safety A+; Watch: schools D, crime F, amenities F.
- Paris School District (town): math 41% / reading 37% proficiency, ranked #83 of 238 in AR (top 35%) — families likely to look elsewhere, expect single-tenant / working-renter base with shorter leases.
- Market conditions: 78 active listings in the ZIP; 11 units permitted in Logan County in 2024 (0 in 5+ unit buildings).
Forward outlook
- Local home prices are declining (-3.0%/yr); year-one equity from $414 of loan paydown is wiped out by about $2k of value loss. Plan a longer hold.
- Logan County population projected at -13% by 2050 — secular population decline; favor cash flow + early exit over multi-decade hold.
- At projected returns (-3.0% appreciation + 3.0% rent growth), your $17k cash investment doubles in ~6 years — after that, you're playing with house money.
Negotiation context
- It's been on market 98 days — a 9% lower offer ($55k) is reasonable based on typical stale-listing flexibility.
- 3 sale attempts since 7y ago; this cycle's ask has dropped $22k (27%) from the opening price — seller is motivated, your offer sets the floor, not the list.
- Current owner paid $40k; 50% above their basis — modest negotiation headroom, anchor on the comps not their cost.
Questions for the listing agent
- It's been on market 98 days. Have you received any prior offers? Is the seller open to a 9% concession, seller financing, or rate buy-down credit?
- Why hasn't it sold? Are there any deal-killer items the seller is aware of (foundation, flood, title, zoning, code violations)?
- Is there a deadline driving the sale (1031 exchange, divorce, estate, relocation)? That informs how much negotiation room exists.
- Schools are D-rated, which usually means shorter tenancies and higher turnover. Who's the typical renter profile here, and what's been the actual vacancy rate?
- Crime grade is F in this area — have there been break-ins, vandalism, or insurance claims at this property in the last 3 years? What carrier currently insures it and at what premium?
- What's the average days-on-market for RENTAL listings here right now (not sales)? A rising rental-DOM trend means longer vacancies and softer asking-rent achievability than the comps imply.
- What's the recent tenant-quality profile in this submarket — average credit score on applications, eviction rate, late-payment / NSF rate, and stable-employment percentage? A property-management company in the area should have these aggregated.
- How much new for-sale + rental construction is in the pipeline within 1–3 miles? Heavy new supply typically softens prices + rents 12–24 months out; constrained supply supports both.
Investment metrics
- 1% rule
- 1.47% ✓
- Cap rate
- 12.88%
- Cash-on-cash
- 23.51%
- DSCR
- 2.05
- GRM
- 5.7
CMA / ARV
- ARV (median comp)
- $92,385
- List price
- $59,900
- Delta
- -35.16%
- Verdict
- UNDERPRICED
- Comps
- 20 within 1.0 mi
Show comp detail 12 sales within ~0.75 mi
| Address | Dist | Beds/Ba | Sqft | Sold | Price | $/sf | Match |
|---|---|---|---|---|---|---|---|
| 804 E Academy St | 0.26mi | 2/1.0 | 974 (-2%) | 1mo | $114,000 | $117 | 83 |
| 903 Main St | 0.08mi | 2/1.0 | 966 (-3%) | 17mo | $89,400 | $93 | 77 |
| 714 E Academy St | 0.26mi | 2/1.0 | 980 (-2%) | 12mo | $105,000 | $107 | 75 |
| 519 S 10th St | 0.35mi | 2/1.0 | 1,004 (+1%) | 10mo | $62,000 | $62 | 74 |
| 723 Short Mountain St | 0.03mi | 2/1.0 | 952 (-5%) | 22mo | $79,500 | $84 | 73 |
| 614 N 7th St | 0.23mi | 2/1.0 | 1,039 (+4%) | 13mo | $120,000 | $115 | 72 |
| 610 N 7th St | 0.22mi | 2/1.0 | 988 (-1%) | 20mo | $84,000 | $85 | 72 |
| 1013 E Main St | 0.14mi | 2/1.0 | 984 (-1%) | 24mo | $99,000 | $101 | 71 |
| 513 4th St | 0.26mi | 3/2.0 (+1) | 1,032 (+3%) | 3mo | $120,000 | $116 | 71 |
| 1160 Wood St | 0.40mi | 3/1.0 (+1) | 1,032 (+3%) | 1mo | $115,000 | $111 | 70 |
| 508 E Main St | 0.14mi | 2/1.0 | 1,032 (+3%) | 24mo | $96,000 | $93 | 68 |
| 111 Grober St | 0.57mi | 2/1.0 | 1,088 (+9%) | 1mo | $85,000 | $78 | 58 |
Match score weights: distance 35% · size 25% · config 20% · recency 20%. Top-matched comps best support the ARV.
Projected returns pro-forma
-3.0% appreciation · 3.0% rent growth · sell at horizon
- IRR
- 16.6%
- Equity multiple
- 1.67×
- Total profit
- $11,205
- Equity at exit
- $8,931
- IRR
- 25.1%
- Equity multiple
- 3.18×
- Total profit
- $36,641
- Equity at exit
- $5,179
Cash invested: $16,772 (down + closing). Projections, not guarantees.
Landlord ↔ Tenant lean methodology
- Overall (STATE)
- 92 Strongly Landlord-Friendly
- State Arkansas
- 92 Strongly Landlord-Friendly · R+14
- County
- — inherits STATE
- City
- — inherits STATE
ZIP-level market 72855
- Home prices YoY
- -8.3%
- Active inventory
- 78
- Price-to-rent
- 5.7×
Monthly cashflow live
- Estimated rent
- $880 medium interval (Pro) →
- Mortgage (P&I)
- −$314
- Tax from tax record
- −$28 /mo · $330/yr
- Insurance
- −$25
- HOA
- −$0
- Vacancy / Maint / Mgmt
- −$185
- Net cashflow
- $329
Break-even live
Sensitivity live
| Price | -10% $362 | -5% $346 | +0% $329 | +5% $312 | +10% $295 |
|---|---|---|---|---|---|
| Rent | -10% $259 | -5% $294 | +0% $329 | +5% $363 | +10% $398 |
| Rate | -1.0pp $359 | -0.5pp $344 | base $329 | +0.5pp $313 | +1.0pp $297 |
UW: 25.0% down · 7.5% · 30yr · 1.5% tax · 5.0% vac · 8.0% maint · 8.0% mgmt
Financing live
Cash to close
- Down payment
- $14,975
- Closing costs
- $1,797
- Reserves months
- —
- Total cash needed
- —
Loan-product check · same deal, 3 products live
Conventional
25% down · 7.5% · 30yr
- Down + closing
- —
- Monthly P&I
- —
- Monthly cashflow
- —
- DSCR
- —
- Eligible?
- —
Personal DTI + credit; lowest rate.
DSCR
20% down · 8.5% · 30yr
- Down + closing
- —
- Monthly P&I
- —
- Monthly cashflow
- —
- DSCR
- —
- Eligible?
- —
No personal income docs; deal must DSCR.
Hard money
10% down · 12.0% · 12mo
- Down + closing
- —
- Monthly P&I
- —
- Monthly cashflow
- —
- DSCR
- —
- Eligible?
- —
Short-term bridge; refi at stabilization.
Listing history 25 events
-
2026-06-19days on market $59,900 Active 98 DOM
-
2026-06-18days on market $59,900 Active 97 DOM
-
2026-06-17days on market $59,900 Active 96 DOM
-
2026-06-16days on market $59,900 Active 95 DOM
-
2026-06-15days on market $59,900 Active 94 DOM
-
2026-06-14days on market $59,900 Active 92 DOM
-
2026-06-12days on market $59,900 Active 91 DOM
-
2026-06-09days on market $59,900 Active 88 DOM
-
2026-06-08days on market $59,900 Active 87 DOM
-
2026-06-07days on market $59,900 Active 86 DOM
-
2026-06-07days on market $59,900 Active 85 DOM
-
2026-06-04days on market $59,900 Active 82 DOM
-
2026-06-02days on market $59,900 Active 81 DOM
-
2026-06-01days on market $59,900 Active 80 DOM
-
2026-05-31days on market $59,900 Active 79 DOM
-
2026-05-31days on market $59,900 Active 78 DOM
-
2026-05-05price $72,000 577-char remark
Show marketing remark (577 chars)
This home offers great potential for the right buyer. With charming curb appeal and a few updates already in place, this property is ready for someone to step in and make it their own. After a long-term tenant recently moved out, the home will need some TLC, but the possibilities here are endless. Whether you're looking for a renovation project, investment property, or a home you can customize to your own style, this property offers a great opportunity to build equity. With a little vision and some updates, this home could truly shine again. Property is being sold As-Is.
-
2026-03-08$82,000 Active 577-char remark
Show marketing remark (577 chars)
This home offers great potential for the right buyer. With charming curb appeal and a few updates already in place, this property is ready for someone to step in and make it their own. After a long-term tenant recently moved out, the home will need some TLC, but the possibilities here are endless. Whether you're looking for a renovation project, investment property, or a home you can customize to your own style, this property offers a great opportunity to build equity. With a little vision and some updates, this home could truly shine again. Property is being sold As-Is.
-
2022-09-30$89,000
-
2019-10-17soldstatus $40,000
-
2019-10-07soldstatus $40,000
-
2019-08-20$45,000
-
2000-09-08soldstatus $21,000
-
1997-03-31soldstatus $25,000
-
1996-07-03soldstatus $20,000
ⓘ Source: listings_history table (triggers on properties + properties_extension) + one-shot
backfill from property_details.listing_events for pre-trigger history.
Tax reassessment forecast AR · Resets to sale price
- Current annual tax
- $330 · $28/mo
- Projected year-2 tax
- $383 · $32/mo
- Expected delta
- +$53/yr (+$4/mo · 16.1%)
ⓘ Screening estimate from a state-policy table — verify with the county assessor before closing.
Nearby sold comps map
Loading sold comps map…
Walkable amenities ~0.75 mi
Loading nearby amenities…
Taxation est. · year 1
- Rental income
- $10,560
- − Mortgage interest
- −$3,355
- − Property taxes
- −$330
- − Insurance
- −$300
- − Repairs & maintenance
- −$845
- − Management
- −$845
- − Depreciation
- −$1,743
- Taxable income
- $3,143
- Est. tax owed @ 24.0%
- −$754
- After-tax cash flow
- $3,189/yr
For passive investors: Depreciation is non-cash, so a rental often shows a tax loss while cash-flowing — sheltering income. Rental losses are passive: they offset passive income freely, and up to $25,000/yr can offset ordinary (W-2) income if you actively participate and your MAGI is under $100k (phasing out to $0 by $150k); unused losses carry forward. On sale, claimed depreciation is recaptured at up to 25%, and gains may owe capital-gains tax (a 1031 exchange can defer both). Figures are a year-1 estimate at your 24.0% rate — not tax advice; consult a CPA.
Schools (NCES district)
- District
- Paris School District
- NCES district ID
- 0511130
- Math proficiency
- 41% ▼ -9.00%
- Reading proficiency
- 37% ▼ -6.00%
- Median HH income
- $34,950
- Composite
- 32.25/100
- National rank
- #5763
- State rank
- #83 of 238 in AR
Livability — Paris
- Score
- 69/100
- State rank
- #68
- US rank
- #8544
Category grades
Schools grade is shown separately in the Schools card above.
Census & demographics
- Census place
- Paris, AR
- Population (ZIP)
- 6,462
Population outlook (Logan County) Hauer SSP2
- Today (2025)
- 21,046 people
- By 2030
- 20,537 · -2.4%
- By 2040
- 19,443 · -7.6%
- By 2050
- 18,220 · -13.4%
- By 2075
- 16,164 · -23.2%
- By 2100
- 14,858 · -29.4%
Race, ethnicity, and origin ACS 2023
- Neighborhood character
- Predominantly White (87%)
- Race & ethnicity
- White 87% Two or more races 8% Asian 3% Hispanic / Latino 2%
- Common ancestry
- Italian 1% Serbian 1% Lithuanian 1%
- Foreign-born
- 2% · China, Vietnam
- Languages at home
- 95% English-only · Spanish 3% Other Asian/Pacific 1% Chinese 1%
Political lean MEDSL · Logan
- 2024 margin
- Solid R (+62.2) · D 17.8% · R 80.0% · Other 2.1%
- 2008→2024 swing
- -23.5pp toward R · 2008: -38.8pp · 2024: -62.2pp
- All cycles
- 2024: R+62.2 2020: R+59.5 2016: R+51.4 2012: R+41.9 2008: R+38.8
Not yet ingested
- Civics
- —
Market trends
- HPI YoY
- ▼ -15.40%
- Current HPI
- 170.513
- Rent YoY
- —
- Metro
- —
- State GDP YoY
- ▲ 3.80%
- F500 in state
- 10
Industry mix (Fortune 500 HQ in AR)
| Industry | F500 HQs | Revenue |
|---|---|---|
| Retail | 1 | $681B |
|
||
| Food / Agriculture | 1 | $53B |
|
||
| Retail / Energy | 1 | $22B |
|
||
| Transportation / Logistics | 1 | $12B |
|
||
| Energy | 1 | $4B |
|
||
Price history
+260.0% since first listed9 events — show timeline
- 2026-05-05 Price Changed $72,000 WRVBOR
- 2026-03-08 Listed $82,000 WRVBOR
- 2022-09-30 Listed $89,000 WRVBOR
- 2019-10-17 Sold (MLS) $40,000 WRVBOR
- 2019-10-07 Sold (Public Records) $40,000 Public Records
- 2019-08-20 Listed $45,000 WRVBOR
- 2000-09-08 Sold (Public Records) $21,000 Public Records
- 1997-03-31 Sold (Public Records) $25,000 Public Records
- 1996-07-03 Sold (Public Records) $20,000 Public Records
Property tax history
+22.8%/yrLatest (2025): $330 · +10.0% YoY. Source: county tax records.
Cash-flow waterfall
monthlySold comps — $/sqft
last 12 mo · ≤1 miLoading sold comps…