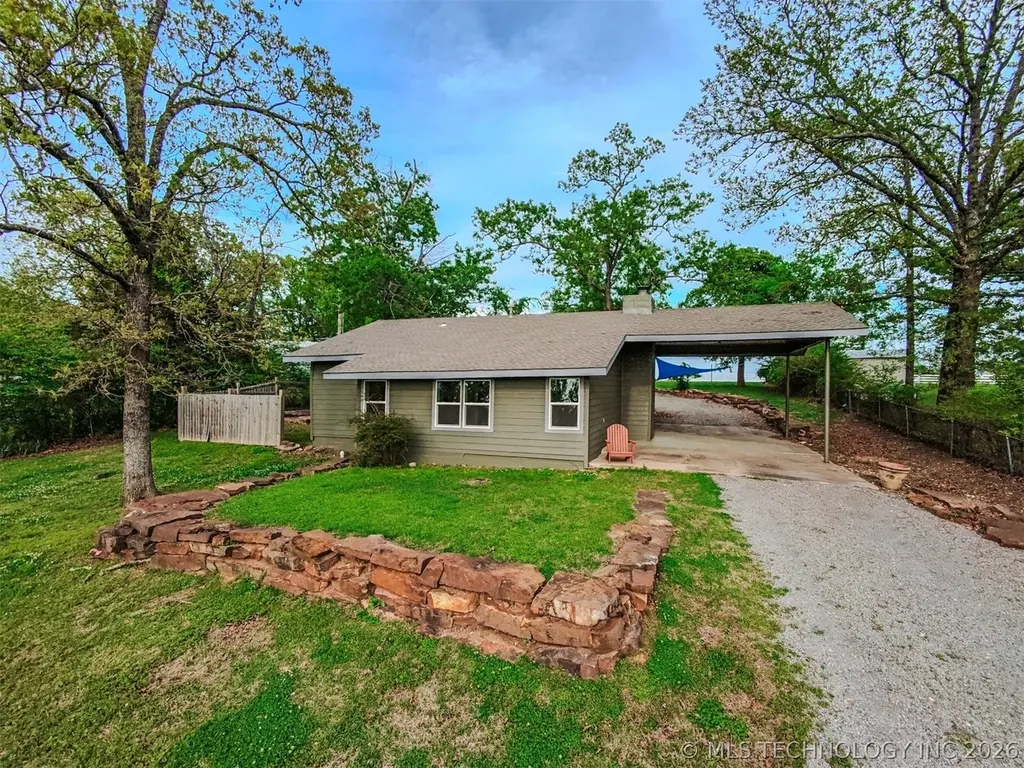
28917 Ranch Ln · Pettit, OK
Flood risk 1/10 · Minimal
- FEMA flood zone
- X (unshaded)
- Chance of flooding over 30 yrs
- 0.0%
- Est. flood insurance / yr
- $507 – $1,088
Fire risk 6/10 · Moderate
- Est. fire insurance / yr
- $2,463 – $4,575
Heat risk 6/10 · Moderate
- Hot days now (above 110°F)
- 7 days/yr
- Hot days in 30 yrs
- 20 days/yr
Wind risk 2/10 · Minimal
- Chance of severe wind over 30 yrs
- 4.0%
Air-quality risk 2/10 · Minimal
- Unhealthy air days now
- 1 days/yr
- Unhealthy air days in 30 yrs
- 1 days/yr
Risk factors via First Street. Map © Google.
Why this score? — see what drove the D+ grade
The composite is a weighted blend of 9 inputs, each scored 0–100. Each bar is that input's sub-score; the figure is the points it added to the 100-point composite (weight × sub-score).
- ARV discount +15.0/15.0
- Cash flow +9.8/30.0
- Appreciation +7.8/10.0
- Schools +3.4/10.0
- Livability +3.1/5.0
- DSCR +2.8/10.0
- Rent growth +2.5/5.0
- Condition / age +2.5/5.0
- 1% rule +1.7/10.0
$179,000
🖨 Deal sheet 📄 Offer letter ✓ Due diligence
Listing remarks
Lakeview Cabin Near Pettit Bay on Lake Tenkiller! This 3 bedroom, 2 bathroom Lake Tenkiller cabin offers 1,410 SqFt (per CH) and the perfect opportunity to create your own private lakeview retreat. Overlooking Pettit Bay, the property sits on 0.55 acres M/L with room for boats, lake toys, and outdoor entertaining. Recent exterior updates include a brand-new roof, new exterior lap siding, and fresh paint. Interior improvements feature newer central heat and air, along with updates in the primary bathroom including a new vanity, tub, and toilet. The home is ready for your finishing touches—complete the interior walls and design to match your vision, whether that’s shiplap, rustic
Key facts
- Fresh paint
- Lakeview cabin
- 0.55 acres
Tags
Property features AI
Finance
- Other: Lot size approximately 0.55 acres
- HOA & community: Marina in the community; Less than 5 miles to water
Exterior
- Parking: Attached garage (1 car); Carport; Circular driveway
- Security: Smoke detector(s); No safety shelter
- Utilities: Septic tank; Rural water
- Home design: Single-story home; Faces west; Slab foundation
- Construction: HardiPlank-type siding; Wood frame construction; Asphalt/fiberglass roof; Built according to public records
- Exterior features: Covered patio; Patio; Gravel driveway; Mature trees; Boat ramp/lift access to nearby water; Has view
Interior
- Kitchen: Country-style kitchen; Oven; Range
- Bedrooms: Master suite with private bath and separate closets (first level); Additional bedrooms on first level
- Flooring: Tile; Vinyl
- Bathrooms: Two full bathrooms; Hall bathroom with shower only (first level)
- Heating & cooling: Central heating (gas); Central air conditioning
- Interior features: Laminate counters; Electric oven connection; Electric range connection; Aluminum frame windows; Vinyl windows; Tile flooring; Vinyl flooring; Wood-burning fireplace
- Laundry & utility: Inside utility room (separate); Washer hookup; Electric dryer hookup; Electric water heater
Neighborhood map
What this means for you Summary
Snapshot
- This is a 3-bed/1.0-bath single-family listed at $179k.
Deal economics
- At list price, monthly cash flow is $-113 ($-1k/yr) — negative.
- To cash-flow at today's rent, offer at most $159k (11.2% below list).
- To meet the 1% rule (rent ≥ 1% of price), the offer needs to be $120k (33.0% below list).
- Recommended offer: $120k (33.0% below list) — sets the bar for 1% rule.
Location & tenants
- Location reads 62/100 on livability (#258 in OK) — a middle-class / working-renter tenant base. Strengths: cost of living A+, housing A+; Watch: schools C-, crime C-, employment D+.
- Keys (rural): math 39% / reading 40% proficiency, ranked #19 of 270 in OK (top 7%) — families likely to look elsewhere, expect single-tenant / working-renter base with shorter leases.
- Market conditions: 145 active listings in the ZIP; 48 units permitted in Cherokee County in 2024 (0 in 5+ unit buildings).
Forward outlook
- In year one you build about $11k of equity ($1k loan paydown + $10k appreciation (5.7% local appreciation)).
- Cherokee County population projected at +15% by 2050 — modest demand growth; plan on rents tracking national, not racing it.
- By year 4, paydown + projected appreciation supports a ~$39k cash-out refi (75% LTV) — recoverable capital for the next deal without selling this one.
Negotiation context
- It's been on market 66 days — a 6% lower offer ($168k) is reasonable based on typical stale-listing flexibility.
- 11 sale attempts since 20y ago; this cycle's ask has dropped $18k (9%) from the opening price — seller is motivated, your offer sets the floor, not the list.
- Current owner paid $100k; list at $179k implies a 79% gain — meaningful room to come down on a strong offer.
Risks & watch-outs
- Climate carrying-cost: major wildfire risk; extreme-heat days projected 7→20/yr by 2055 (HVAC capex compounding) — expect insurance premiums to compound above CPI over the hold.
Questions for the listing agent
- What do current leases actually rent for vs. the listed asking? Can we see a recent rent roll and the last 12 months of T-12 income?
- It's been on market 66 days. Have you received any prior offers? Is the seller open to a 33% concession, seller financing, or rate buy-down credit?
- Built in 1965 — when were the roof, HVAC, electrical panel, plumbing, and water heater last replaced?
- Why hasn't it sold? Are there any deal-killer items the seller is aware of (foundation, flood, title, zoning, code violations)?
- Is there a deadline driving the sale (1031 exchange, divorce, estate, relocation)? That informs how much negotiation room exists.
- The area grade is low — what's the realistic commute time and amenity access for the typical tenant pool here? Any planned neighborhood developments (good or bad) we should know about?
- What's the average days-on-market for RENTAL listings here right now (not sales)? A rising rental-DOM trend means longer vacancies and softer asking-rent achievability than the comps imply.
- What's the recent tenant-quality profile in this submarket — average credit score on applications, eviction rate, late-payment / NSF rate, and stable-employment percentage? A property-management company in the area should have these aggregated.
- How much new for-sale + rental construction is in the pipeline within 1–3 miles? Heavy new supply typically softens prices + rents 12–24 months out; constrained supply supports both.
Investment metrics
- 1% rule
- 0.67% ✗
- Cap rate
- 5.53%
- Cash-on-cash
- -2.71%
- DSCR
- 0.88
- GRM
- 12.4
CMA / ARV
- ARV (on-the-fly)
- $219,960
- Comps found
- 1
Show comp detail 1 sale within ~0.75 mi
| Address | Dist | Beds/Ba | Sqft | Sold | Price | $/sf | Match |
|---|---|---|---|---|---|---|---|
| 29300 Hwy 82 Hwy Lot 119 | 0.47mi | 3/2.0 | 1,216 (-14%) | 4mo | $190,000 | $156 | 48 |
Match score weights: distance 35% · size 25% · config 20% · recency 20%. Top-matched comps best support the ARV.
Projected returns pro-forma
5.65% appreciation · 3.0% rent growth · sell at horizon
- IRR
- 12.2%
- Equity multiple
- 1.81×
- Total profit
- $40,646
- Equity at exit
- $108,547
- IRR
- 13.1%
- Equity multiple
- 3.52×
- Total profit
- $126,087
- Equity at exit
- $193,499
Cash invested: $50,120 (down + closing). Projections, not guarantees.
Landlord ↔ Tenant lean methodology
- Overall (STATE)
- 83 Strongly Landlord-Friendly
- State Oklahoma
- 83 Strongly Landlord-Friendly · R+20
- County
- — inherits STATE
- City
- — inherits STATE
ZIP-level market 74451
- Home prices YoY
- 2.2%
- Active inventory
- 145
- Price-to-rent
- 12.4×
Monthly cashflow live
- Estimated rent
- $1,200 medium interval (Pro) →
- Mortgage (P&I)
- −$939
- Tax from tax record
- −$48 /mo · $572/yr
- Insurance
- −$75
- HOA
- −$0
- Vacancy / Maint / Mgmt
- −$252
- Net cashflow
- $-113
Break-even live
UW: 25.0% down · 7.5% · 30yr · 1.5% tax · 5.0% vac · 8.0% maint · 8.0% mgmt
Financing live
Cash to close
- Down payment
- $44,750
- Closing costs
- $5,370
- Reserves months
- —
- Total cash needed
- —
Loan-product check · same deal, 3 products live
Conventional
25% down · 7.5% · 30yr
- Down + closing
- —
- Monthly P&I
- —
- Monthly cashflow
- —
- DSCR
- —
- Eligible?
- —
Personal DTI + credit; lowest rate.
DSCR
20% down · 8.5% · 30yr
- Down + closing
- —
- Monthly P&I
- —
- Monthly cashflow
- —
- DSCR
- —
- Eligible?
- —
No personal income docs; deal must DSCR.
Hard money
10% down · 12.0% · 12mo
- Down + closing
- —
- Monthly P&I
- —
- Monthly cashflow
- —
- DSCR
- —
- Eligible?
- —
Short-term bridge; refi at stabilization.
Listing history 45 events
-
2026-06-19days on market $179,000 Active 66 DOM
-
2026-06-18days on market $179,000 Active 65 DOM
-
2026-06-17days on market $179,000 Active 64 DOM
-
2026-06-16days on market $179,000 Active 63 DOM
-
2026-06-15days on market $179,000 Active 62 DOM
-
2026-06-14days on market $179,000 Active 60 DOM
-
2026-06-12days on market $179,000 Active 59 DOM
-
2026-06-09days on market $179,000 Active 56 DOM
-
2026-06-08days on market $179,000 Active 55 DOM
-
2026-06-07days on market $179,000 Active 54 DOM
-
2026-06-05days on market $179,000 Active 51 DOM
-
2026-06-02days on market $179,000 Active 49 DOM
-
2026-06-01days on market $179,000 Active 48 DOM
-
2026-05-31days on market $179,000 Active 47 DOM
-
2026-05-30days on market $179,000 Active 46 DOM
-
2026-04-24price $179,000
-
2026-04-14$197,500 Active
-
2026-04-10historical
-
2026-02-27$197,500 Active
-
2026-02-27historical
-
2025-12-30status Active
-
2025-12-22status Pending
-
2025-08-29$197,500 Active
-
2025-03-06historical
-
2025-02-25price $129,900
-
2025-01-31price $132,500
-
2025-01-23$137,400 Active
-
2025-01-22historical
-
2024-12-05price $137,400
-
2024-10-31price $138,900
-
2024-07-24$139,900 Active
-
2024-03-31historical
-
2023-12-27$159,900 Active
-
2023-05-18soldstatus $100,000 Closed
-
2023-05-18soldstatus $100,000
-
2023-04-17status Pending
-
2023-04-06$95,000 Active
-
2010-03-31historical
-
2010-01-16$69,000
-
2009-11-23historical
-
2009-05-22$69,500
-
2007-03-22soldstatus $55,000
-
2007-03-22soldstatus $55,000
-
2007-02-06historical
-
2006-12-22$85,000
ⓘ Source: listings_history table (triggers on properties + properties_extension) + one-shot
backfill from property_details.listing_events for pre-trigger history.
Tax reassessment forecast OK · Resets to sale price
- Current annual tax
- $572 · $48/mo
- Projected year-2 tax
- $1,611 · $134/mo
- Expected delta
- +$1,039/yr (+$87/mo · 181.6%)
ⓘ Screening estimate from a state-policy table — verify with the county assessor before closing.
Climate risk First Street
- Flood 1/10 Low FEMA zone X (unshaded) · 0% chance over 30 yrs
- Wildfire 6/10 Major
- Heat 6/10 Major 7 d/yr ≥110°F today · 20 d/yr by 30 yrs out
- Wind 2/10 Low 4% chance of damaging wind over 30 yrs
- Air quality 2/10 Low 1 unhealthy d/yr today · 1 by 30 yrs out
Nearby sold comps map
Loading sold comps map…
Walkable amenities ~0.75 mi
Loading nearby amenities…
Taxation est. · year 1
- Rental income
- $14,397
- − Mortgage interest
- −$10,027
- − Property taxes
- −$572
- − Insurance
- −$895
- − Repairs & maintenance
- −$1,152
- − Management
- −$1,152
- − Depreciation
- −$5,207
- Taxable loss
- −$4,607
- Est. tax savings @ 24.0%
- +$1,106
- After-tax cash flow
- $-252/yr
For passive investors: Depreciation is non-cash, so a rental often shows a tax loss while cash-flowing — sheltering income. Rental losses are passive: they offset passive income freely, and up to $25,000/yr can offset ordinary (W-2) income if you actively participate and your MAGI is under $100k (phasing out to $0 by $150k); unused losses carry forward. On sale, claimed depreciation is recaptured at up to 25%, and gains may owe capital-gains tax (a 1031 exchange can defer both). Figures are a year-1 estimate at your 24.0% rate — not tax advice; consult a CPA.
Schools (NCES district)
- District
- Keys
- NCES district ID
- 4000033
- Math proficiency
- 39% ▼ -2.00%
- Reading proficiency
- 40% ▲ 4.00%
- Median HH income
- $46,426
- Composite
- 33.74/100
- National rank
- #5370
- State rank
- #19 of 270 in OK
Livability — Pettit
- Score
- 62/100
- State rank
- #258
- US rank
- #16899
Category grades
Schools grade is shown separately in the Schools card above.
Census & demographics
- Census place
- Pettit, OK
- Population (ZIP)
- 3,816
Population outlook (Cherokee County) Hauer SSP2
- Today (2025)
- 51,747 people
- By 2030
- 53,481 · +3.4%
- By 2040
- 56,503 · +9.2%
- By 2050
- 59,370 · +14.7%
- By 2075
- 67,178 · +29.8%
- By 2100
- 70,900 · +37.0%
Race, ethnicity, and origin ACS 2023
- Neighborhood character
- Highly diverse neighborhood (Simpson 0.73)
- Race & ethnicity
- White 52% Native American 27% Two or more races 20% Hispanic / Latino 4%
- Common ancestry
- Italian 6% Slovak 3% Lithuanian 2%
- Foreign-born
- 2% · Canada
- Languages at home
- 96% English-only · Spanish 2%
Political lean MEDSL · Cherokee
- 2024 margin
- Solid R (+32.6) · D 32.7% · R 65.3% · Other 2.0%
- 2008→2024 swing
- -20.4pp toward R · 2008: -12.2pp · 2024: -32.6pp
- All cycles
- 2024: R+32.6 2020: R+29.3 2016: R+27.5 2012: R+14.1 2008: R+12.2
Not yet ingested
- Civics
- —
Market trends
- HPI YoY
- ▲ 5.65%
- Current HPI
- 256.0707
- Rent YoY
- —
- Metro
- —
- State GDP YoY
- ▲ 1.55%
- F500 in state
- 6
Industry mix (Fortune 500 HQ in OK)
| Industry | F500 HQs | Revenue |
|---|---|---|
| Energy | 3 | $48B |
|
||
Price history
+110.6% since first listed30 events — show timeline
- 2026-04-24 Price Changed $179,000 MLS Technology, Inc.
- 2026-04-14 Listed $197,500 MLS Technology, Inc.
- 2026-04-10 Listing Removed — MLS Technology, Inc.
- 2026-02-27 Listing Removed — MLS Technology, Inc.
- 2026-02-27 Listed $197,500 MLS Technology, Inc.
- 2025-12-30 Relisted — MLS Technology, Inc.
- 2025-12-22 Pending — MLS Technology, Inc.
- 2025-08-29 Listed $197,500 MLS Technology, Inc.
- 2025-03-06 Listing Removed — MLS Technology, Inc.
- 2025-02-25 Price Changed $129,900 MLS Technology, Inc.
- 2025-01-31 Price Changed $132,500 MLS Technology, Inc.
- 2025-01-23 Listed $137,400 MLS Technology, Inc.
- 2025-01-22 Listing Removed — MLS Technology, Inc.
- 2024-12-05 Price Changed $137,400 MLS Technology, Inc.
- 2024-10-31 Price Changed $138,900 MLS Technology, Inc.
- 2024-07-24 Listed $139,900 MLS Technology, Inc.
- 2024-03-31 Listing Removed — MLS Technology, Inc.
- 2023-12-27 Listed $159,900 MLS Technology, Inc.
- 2023-05-18 Sold (Public Records) $100,000 Public Records
- 2023-05-18 Sold (MLS) $100,000 MLS Technology, Inc.
- 2023-04-17 Pending — MLS Technology, Inc.
- 2023-04-06 Listed $95,000 MLS Technology, Inc.
- 2010-03-31 Listing Removed — MLS Technology, Inc.
- 2010-01-16 Listed $69,000 MLS Technology, Inc.
- 2009-11-23 Listing Removed — MLS Technology, Inc.
- 2009-05-22 Listed $69,500 MLS Technology, Inc.
- 2007-03-22 Sold (Public Records) $55,000 Public Records
- 2007-03-22 Sold (MLS) $55,000 MLS Technology, Inc.
- 2007-02-06 Listing Removed — MLS Technology, Inc.
- 2006-12-22 Listed $85,000 MLS Technology, Inc.
Property tax history
+1.0%/yrLatest (2025): $572 · -39.8% YoY. Source: county tax records.
Cash-flow waterfall
monthlySold comps — $/sqft
last 12 mo · ≤1 miLoading sold comps…