366 Saint Kitts Rd · Comanche, TX
Flood risk No data
- FEMA flood zone
- —
- Chance of flooding over 30 yrs
- —
- Est. flood insurance / yr
- —
Fire risk No data
- Est. fire insurance / yr
- —
Heat risk No data
- Hot days now (above threshold)
- —
- Hot days in 30 yrs
- —
Wind risk No data
- Chance of severe wind over 30 yrs
- —
Air-quality risk No data
- Unhealthy air days now
- —
- Unhealthy air days in 30 yrs
- —
Risk factors via First Street. Map © Google.
Why this score? — see what drove the B+ grade
The composite is a weighted blend of 9 inputs, each scored 0–100. Each bar is that input's sub-score; the figure is the points it added to the 100-point composite (weight × sub-score).
- Cash flow +30.0/30.0
- ARV discount +15.0/15.0
- 1% rule +10.0/10.0
- DSCR +10.0/10.0
- Schools +4.1/10.0
- Livability +3.2/5.0
- Rent growth +2.5/5.0
- Condition / age +2.2/5.0
- Appreciation +0.0/10.0
$60,000
🖨 Deal sheet 📄 Offer letter ✓ Due diligence
Listing remarks MLS
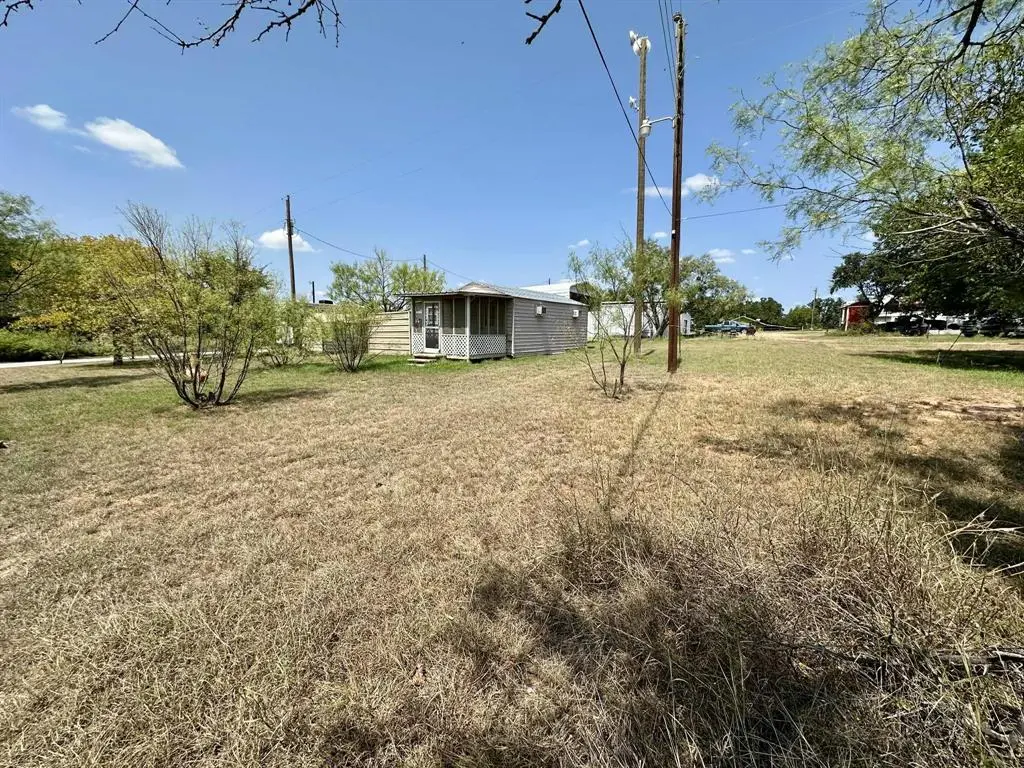
Charming 1 Bedroom, 1 Bath Cabin with Add On! Just a quarter mile from Lake Proctor! Looking for the perfect weekend escape? This cozy one-bedroom, one-bath cabin with an additional add-on space has 3 lots and is located just a quarter mile from beautiful Lake Proctor. There is a huge RV carport to park your RV. Whether you're into fishing, boating, or simply relaxing in nature, this cabin offers the ideal retreat. Enjoy peaceful surroundings, quick lake access, and the comfort of a quiet getaway spot. Don’t miss your chance to own this great weekend hideaway!
Key facts
- Quick lake access
- Lake proctor
- 6,490 sq ft lot
Tags
Neighborhood map
What this means for you Summary
Snapshot
- This is a 1-bed/1.0-bath single-family listed at $60k. Condition is rated fair.
Deal economics
- At list price, monthly cash flow is $558 ($7k/yr) — positive.
- The deal already cash-flows at list — no discount required.
- Meets the 1% rule at list price ($1k rent vs $60k).
- Recommended offer: $53k (12.0% below list) — sets the bar for market timing.
- Cap rate 17.5% vs local median 2.1% in Comanche — top-decile yield for the area; either an underpriced asset or a hidden risk that comps aren't pricing in. Stress-test before assuming the spread holds.
Location & tenants
- Location reads 64/100 on livability (#763 in TX) — a middle-class / working-renter tenant base. Strengths: cost of living A+, housing A+; Watch: crime D+, health & safety D+, schools F.
- De Leon ISD (rural): math 46% / reading 53% proficiency, ranked #207 of 826 in TX (top 25%) — families likely to look elsewhere, expect single-tenant / working-renter base with shorter leases.
- Market conditions: 168 active listings in the ZIP; 4 units permitted in Comanche County in 2024 (0 in 5+ unit buildings).
Forward outlook
- Local home prices are declining (-3.0%/yr); year-one equity from $415 of loan paydown is wiped out by about $2k of value loss. Plan a longer hold.
- Comanche County population projected at -29% by 2050 — secular population decline; favor cash flow + early exit over multi-decade hold.
- At projected returns (-3.0% appreciation + 3.0% rent growth), your $17k cash investment doubles in ~3 years — after that, you're playing with house money.
Negotiation context
- It's been on market 283 days — a 12% lower offer ($53k) is reasonable based on typical stale-listing flexibility.
Questions for the listing agent
- It's been on market 283 days. Have you received any prior offers? Is the seller open to a 12% concession, seller financing, or rate buy-down credit?
- Have any recent inspections been done? Can we get a copy of the seller's disclosures and any deferred-maintenance estimates?
- Why hasn't it sold? Are there any deal-killer items the seller is aware of (foundation, flood, title, zoning, code violations)?
- Is there a deadline driving the sale (1031 exchange, divorce, estate, relocation)? That informs how much negotiation room exists.
- Schools are F-rated, which usually means shorter tenancies and higher turnover. Who's the typical renter profile here, and what's been the actual vacancy rate?
- Crime grade is D in this area — have there been break-ins, vandalism, or insurance claims at this property in the last 3 years? What carrier currently insures it and at what premium?
- What's the average days-on-market for RENTAL listings here right now (not sales)? A rising rental-DOM trend means longer vacancies and softer asking-rent achievability than the comps imply.
- What's the recent tenant-quality profile in this submarket — average credit score on applications, eviction rate, late-payment / NSF rate, and stable-employment percentage? A property-management company in the area should have these aggregated.
- How much new for-sale + rental construction is in the pipeline within 1–3 miles? Heavy new supply typically softens prices + rents 12–24 months out; constrained supply supports both.
Investment metrics
- 1% rule
- 2.05% ✓
- Cap rate
- 17.46%
- Cash-on-cash
- 39.87%
- DSCR
- 2.77
- GRM
- 4.1
CMA / ARV
- ARV (median comp)
- $113,346
- List price
- $60,000
- Delta
- -47.06%
- Verdict
- UNDERPRICED
- Comps
- 4 within 1.0 mi
Projected returns pro-forma
-3.0% appreciation · 3.0% rent growth · sell at horizon
- IRR
- 36.2%
- Equity multiple
- 2.54×
- Total profit
- $25,843
- Equity at exit
- $8,946
- IRR
- 42.9%
- Equity multiple
- 5.07×
- Total profit
- $68,353
- Equity at exit
- $5,188
Cash invested: $16,800 (down + closing). Projections, not guarantees.
Landlord ↔ Tenant lean methodology
- Overall (STATE)
- 87 Strongly Landlord-Friendly
- State Texas
- 87 Strongly Landlord-Friendly · R+5
- County
- — inherits STATE
- City
- — inherits STATE
ZIP-level market 76442
- Home prices YoY
- -15.9%
- Active inventory
- 168
- Price-to-rent
- 4.1×
Monthly cashflow live
- Estimated rent
- $1,231 medium interval (Pro) →
- Mortgage (P&I)
- −$315
- Tax est. 1.5%
- −$75 /mo · $900/yr
- Insurance
- −$25
- HOA
- −$0
- Vacancy / Maint / Mgmt
- −$259
- Net cashflow
- $558
Break-even live
UW: 25.0% down · 7.5% · 30yr · 1.5% tax · 5.0% vac · 8.0% maint · 8.0% mgmt
Financing live
Cash to close
- Down payment
- $15,000
- Closing costs
- $1,800
- Reserves months
- —
- Total cash needed
- —
Loan-product check · same deal, 3 products live
Conventional
25% down · 7.5% · 30yr
- Down + closing
- —
- Monthly P&I
- —
- Monthly cashflow
- —
- DSCR
- —
- Eligible?
- —
Personal DTI + credit; lowest rate.
DSCR
20% down · 8.5% · 30yr
- Down + closing
- —
- Monthly P&I
- —
- Monthly cashflow
- —
- DSCR
- —
- Eligible?
- —
No personal income docs; deal must DSCR.
Hard money
10% down · 12.0% · 12mo
- Down + closing
- —
- Monthly P&I
- —
- Monthly cashflow
- —
- DSCR
- —
- Eligible?
- —
Short-term bridge; refi at stabilization.
Listing history 16 events
-
2026-06-18days on market $60,000 Active 283 DOM
-
2026-06-17days on market $60,000 Active 282 DOM
-
2026-06-16days on market $60,000 Active 281 DOM
-
2026-06-15days on market $60,000 Active 280 DOM
-
2026-06-13days on market $60,000 Active 278 DOM
-
2026-06-12days on market $60,000 Active 277 DOM
-
2026-06-09days on market $60,000 Active 274 DOM
-
2026-06-08days on market $60,000 Active 273 DOM
-
2026-06-08days on market $60,000 Active 272 DOM
-
2026-06-07days on market $60,000 Active 271 DOM
-
2026-06-03days on market $60,000 Active 268 DOM
-
2026-06-02days on market $60,000 Active 267 DOM
-
2026-06-01days on market $60,000 Active 266 DOM
-
2026-05-31days on market $60,000 Active 265 DOM
-
2026-02-26price $60,000 577-char remark
Show marketing remark (577 chars)
Charming 1 Bedroom, 1 Bath Cabin with Add On! Just a quarter mile from Lake Proctor! Looking for the perfect weekend escape? This cozy one-bedroom, one-bath cabin with an additional add-on space has 3 lots and is located just a quarter mile from beautiful Lake Proctor. There is a huge RV carport to park your RV. Whether you're into fishing, boating, or simply relaxing in nature, this cabin offers the ideal retreat. Enjoy peaceful surroundings, quick lake access, and the comfort of a quiet getaway spot. Don’t miss your chance to own this great weekend hideaway!
-
2025-09-08$65,000 Active 577-char remark
Show marketing remark (577 chars)
Charming 1 Bedroom, 1 Bath Cabin with Add On! Just a quarter mile from Lake Proctor! Looking for the perfect weekend escape? This cozy one-bedroom, one-bath cabin with an additional add-on space has 3 lots and is located just a quarter mile from beautiful Lake Proctor. There is a huge RV carport to park your RV. Whether you're into fishing, boating, or simply relaxing in nature, this cabin offers the ideal retreat. Enjoy peaceful surroundings, quick lake access, and the comfort of a quiet getaway spot. Don’t miss your chance to own this great weekend hideaway!
ⓘ Source: listings_history table (triggers on properties + properties_extension) + one-shot
backfill from property_details.listing_events for pre-trigger history.
Nearby sold comps map
Loading sold comps map…
Walkable amenities ~0.75 mi
Loading nearby amenities…
Taxation est. · year 1
- Rental income
- $14,776
- − Mortgage interest
- −$3,361
- − Property taxes
- −$900
- − Insurance
- −$300
- − Repairs & maintenance
- −$1,182
- − Management
- −$1,182
- − Depreciation
- −$1,745
- Taxable income
- $6,106
- Est. tax owed @ 24.0%
- −$1,465
- After-tax cash flow
- $5,232/yr
For passive investors: Depreciation is non-cash, so a rental often shows a tax loss while cash-flowing — sheltering income. Rental losses are passive: they offset passive income freely, and up to $25,000/yr can offset ordinary (W-2) income if you actively participate and your MAGI is under $100k (phasing out to $0 by $150k); unused losses carry forward. On sale, claimed depreciation is recaptured at up to 25%, and gains may owe capital-gains tax (a 1031 exchange can defer both). Figures are a year-1 estimate at your 24.0% rate — not tax advice; consult a CPA.
Condition & rehab AI · 12 photos
This single-family home requires significant repairs and maintenance to improve its condition and increase its value. The home is in fair condition with poor exterior and interior conditions. Repairs and updates are needed to bring the home up to a good condition and increase its value.
Repairs flagged
- Major siding — Significant wear and tear
- Major roof — Siding condition suggests potential leak
- Major flooring — Worn carpet
- Major interior walls — Worn wallpaper
- Major bathrooms — Worn fixtures
- Major kitchen — Worn cabinets
- Major HVAC/mechanicals — Age suggests potential issues
- Major landscaping — Overgrown yard
Value-add opportunities
- Both paint and clean interior — Fresh paint and cleaning can significantly improve the home's appearance and value
- Both repair and replace siding — New siding will improve the home's curb appeal and increase its value
- Both repair and replace roof — A new roof will address potential leaks and improve the home's value
- Both replace flooring — New flooring will improve the home's appearance and increase its value
- Both repair and replace interior walls — New walls will improve the home's appearance and increase its value
- Both repair and replace bathrooms — New bathrooms will improve the home's appearance and increase its value
- Both repair and replace kitchen — New kitchen will improve the home's appearance and increase its value
- Both landscaping and curb appeal — New landscaping will improve the home's curb appeal and increase its value
Renovation cost estimate screening
| Repair item | Severity | Est. cost |
|---|---|---|
| siding · Significant wear and tear | Major | $15,000–50,000 |
| roof · Siding condition suggests potential leak | Major | $15,000–50,000 |
| flooring · Worn carpet | Major | $15,000–50,000 |
| interior walls · Worn wallpaper | Major | $15,000–50,000 |
| bathrooms · Worn fixtures | Major | $15,000–50,000 |
| kitchen · Worn cabinets | Major | $15,000–50,000 |
| HVAC/mechanicals · Age suggests potential issues | Major | $15,000–50,000 |
| landscaping · Overgrown yard | Major | $15,000–50,000 |
| Total estimated repair cost · 8 items | $120,000–400,000 |
Value-add ROI direction
- Both paint and clean interior — Fresh paint and cleaning can significantly improve the home's appearance and value ↑
- Both repair and replace siding — New siding will improve the home's curb appeal and increase its value ↑
- Both repair and replace roof — A new roof will address potential leaks and improve the home's value ↑
- Both replace flooring — New flooring will improve the home's appearance and increase its value ↑
- Both repair and replace interior walls — New walls will improve the home's appearance and increase its value ↑
- Both repair and replace bathrooms — New bathrooms will improve the home's appearance and increase its value ↑
- Both repair and replace kitchen — New kitchen will improve the home's appearance and increase its value ↑
- Both landscaping and curb appeal — New landscaping will improve the home's curb appeal and increase its value ↑
ⓘ Cost ranges are severity-bucket heuristics (US national rule-of-thumb). Get contractor quotes + a written scope before underwriting a rehab budget.
Schools (NCES district)
- District
- De Leon ISD
- NCES district ID
- 4816440
- Math proficiency
- 46% ▼ -5.00%
- Reading proficiency
- 53% ▼ -2.00%
- Median HH income
- $36,143
- Composite
- 41.02/100
- National rank
- #3586
- State rank
- #207 of 826 in TX
Livability — Comanche
- Score
- 64/100
- State rank
- #763
- US rank
- #13962
Category grades
Schools grade is shown separately in the Schools card above.
Census & demographics
- City population
- 7,082
- Population (ZIP)
- 7,082
Population outlook (Comanche County) Hauer SSP2
- Today (2025)
- 12,214 people
- By 2030
- 11,531 · -5.6%
- By 2040
- 10,132 · -17.0%
- By 2050
- 8,724 · -28.6%
- By 2075
- 5,684 · -53.5%
- By 2100
- 3,649 · -70.1%
Race, ethnicity, and origin ACS 2023
- Neighborhood character
- Majority White (60%)
- Race & ethnicity
- White 60% Hispanic / Latino 35% Two or more races 25% Native American 1%
- Hispanic origin (detail)
- Mexican 33%
- Common ancestry
- Italian 5% Slovak 1% Serbian 1%
- Foreign-born
- 10% · Canada
- Languages at home
- 76% English-only · Spanish 23% German/W. Germanic 1%
Political lean MEDSL · Comanche
- 2024 margin
- Solid R (+74.0) · D 12.7% · R 86.8%
- 2008→2024 swing
- -26.5pp toward R · 2008: -47.5pp · 2024: -74.0pp
- All cycles
- 2024: R+74.0 2020: R+71.0 2016: R+67.4 2012: R+62.3 2008: R+47.5
Not yet ingested
- Civics
- —
Market trends
- HPI YoY
- ▼ -41.00%
- Current HPI
- 216.9759
- Rent YoY
- —
- Metro
- —
- State GDP YoY
- ▲ 3.95%
- F500 in state
- 110
Industry mix (Fortune 500 HQ in TX)
| Industry | F500 HQs | Revenue |
|---|---|---|
| Energy | 16 | $1,198B |
|
||
| Technology | 5 | $198B |
|
||
| Engineering / Construction | 4 | $72B |
|
||
| Energy Services | 3 | $60B |
|
||
| Utilities | 3 | $41B |
|
||
| Healthcare | 2 | $330B |
|
||
Price history
-7.7% since first listed2 events — show timeline
- 2026-02-26 Price Changed $60,000 NTREIS
- 2025-09-08 Listed $65,000 NTREIS
Cash-flow waterfall
monthlySold comps — $/sqft
last 12 mo · ≤1 miLoading sold comps…