2305 Cottonwood Pl · Springdale, AR
Flood risk 1/10 · Minimal
- FEMA flood zone
- X (unshaded)
- Chance of flooding over 30 yrs
- 0.0%
- Est. flood insurance / yr
- $507 – $1,088
Fire risk 4/10 · Minor
- Est. fire insurance / yr
- $1,499 – $2,785
Heat risk 5/10 · Moderate
- Hot days now (above 105°F)
- 7 days/yr
- Hot days in 30 yrs
- 20 days/yr
Wind risk 2/10 · Minimal
- Chance of severe wind over 30 yrs
- 2.0%
Air-quality risk 1/10 · Minimal
- Unhealthy air days now
- 0 days/yr
- Unhealthy air days in 30 yrs
- 0 days/yr
Risk factors via First Street. Map © Google.
Why this score? — see what drove the B- grade
The composite is a weighted blend of 9 inputs, each scored 0–100. Each bar is that input's sub-score; the figure is the points it added to the 100-point composite (weight × sub-score).
- Cash flow +28.4/30.0
- DSCR +10.0/10.0
- ARV discount +7.5/15.0
- 1% rule +7.4/10.0
- Livability +3.5/5.0
- Rent growth +3.2/5.0
- Schools +3.1/10.0
- Condition / age +2.5/5.0
- Appreciation +0.0/10.0
$125,000
🖨 Deal sheet 📄 Offer letter ✓ Due diligence
Listing remarks
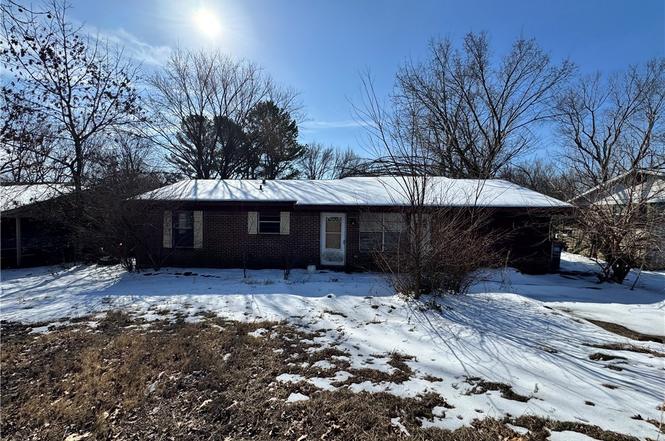
Calling all investors and visionaries! This all-brick 1973 home is ready for its next chapter. Featuring 3 bedrooms, 1.5 bathrooms, and a generously sized yard, this home offers the perfect canvas for your next renovation project. Nestled in a central location close to schools, parks, trails, shopping, and dining—with easy access to I-49 and 71-B—convenience is built right in. Sold AS-IS and subject to court approval. No SPD provided. A great opportunity for those ready to unlock its potential.
Key facts
- Close to parks
- Close to schools
- Central location
Tags
Neighborhood map
What this means for you Summary
Snapshot
- This is a 3-bed/1.5-bath single-family listed at $125k.
Deal economics
- At list price, monthly cash flow is $404 ($5k/yr) — positive.
- The deal already cash-flows at list — no discount required.
- Meets the 1% rule at list price ($2k rent vs $125k).
- Cap rate 10.2% vs local median 3.3% in Springdale — top-decile yield for the area; either an underpriced asset or a hidden risk that comps aren't pricing in. Stress-test before assuming the spread holds.
Location & tenants
- Location reads 70/100 on livability (#48 in AR) — a middle-class / working-renter tenant base. Strengths: cost of living A+, housing A+, health & safety A+; Watch: schools D+, commute D+, employment D+.
- Springdale School District (urban): math 38% / reading 35% proficiency, ranked #100 of 238 in AR (top 42%) — families likely to look elsewhere, expect single-tenant / working-renter base with shorter leases.
- Market conditions: Rents rising (+2.7%/yr); 695 active listings in the ZIP; 19 comparable units currently listed for rent nearby; rentals at typical pace (median 24d on market — plan ~3-4 weeks tenant-placement turnaround); solid renter incomes; 3,494 units permitted in Washington County in 2024 (1,497 in 5+ unit buildings).
Forward outlook
- Local home prices are declining (-3.0%/yr); year-one equity from $864 of loan paydown is wiped out by about $4k of value loss. Plan a longer hold.
- Washington County population projected at +47% by 2050 — long-run rental-demand tailwind backs the buy-and-hold thesis.
- At projected returns (-3.0% appreciation + 2.7% rent growth), your $35k cash investment doubles in ~9 years — after that, you're playing with house money.
Negotiation context
- Only 1 days on market — expect competitive offers; lowballing is unlikely to land.
- Current owner paid $42k; list at $125k implies a 198% gain — meaningful room to come down on a strong offer.
Risks & watch-outs
- Climate carrying-cost: extreme-heat days projected 7→20/yr by 2055 (HVAC capex compounding) — expect insurance premiums to compound above CPI over the hold.
Questions for the listing agent
- Built in 1973 — when were the roof, HVAC, electrical panel, plumbing, and water heater last replaced?
- Is there a deadline driving the sale (1031 exchange, divorce, estate, relocation)? That informs how much negotiation room exists.
- Schools are D-rated, which usually means shorter tenancies and higher turnover. Who's the typical renter profile here, and what's been the actual vacancy rate?
- Crime grade is D in this area — have there been break-ins, vandalism, or insurance claims at this property in the last 3 years? What carrier currently insures it and at what premium?
- What's the average days-on-market for RENTAL listings here right now (not sales)? A rising rental-DOM trend means longer vacancies and softer asking-rent achievability than the comps imply.
- What's the recent tenant-quality profile in this submarket — average credit score on applications, eviction rate, late-payment / NSF rate, and stable-employment percentage? A property-management company in the area should have these aggregated.
- How much new for-sale + rental construction is in the pipeline within 1–3 miles? Heavy new supply typically softens prices + rents 12–24 months out; constrained supply supports both.
Investment metrics
- 1% rule
- 1.24% ✓
- Cap rate
- 10.17%
- Cash-on-cash
- 13.84%
- DSCR
- 1.62
- GRM
- 6.7
CMA / ARV
- ARV (on-the-fly)
- $290,928
- Comps found
- 12
Show comp detail 12 sales within ~0.75 mi
| Address | Dist | Beds/Ba | Sqft | Sold | Price | $/sf | Match |
|---|---|---|---|---|---|---|---|
| 2305 Cottonwood Pl | 0.00mi | 3/1.5 | 1,392 (0%) | 0mo | $125,000 | $90 | 100 |
| 2300 Sycamore Pl | 0.10mi | 4/1.5 (+1) | 1,260 (-10%) | 1mo | $268,000 | $213 | 73 |
| 2200 Dogwood Pl | 0.12mi | 3/1.0 | 1,248 (-10%) | 12mo | $245,000 | $196 | 66 |
| 2205 Cottonwood Pl | 0.08mi | 3/1.5 | 1,190 (-14%) | 8mo | $235,000 | $197 | 66 |
| 4931 Dogwood | 0.61mi | 3/2.0 | 1,403 (+1%) | 8mo | $332,500 | $237 | 61 |
| 2708 Drexelwood Dr | 0.27mi | 3/2.0 | 1,575 (+13%) | 3mo | $336,400 | $214 | 61 |
| 2103 Blueberry Ln | 0.37mi | 4/2.0 (+1) | 1,296 (-7%) | 5mo | $260,000 | $201 | 60 |
| 1984 Dogwood Pl | 0.27mi | 3/2.0 | 1,197 (-14%) | 10mo | $252,333 | $211 | 53 |
| 3061 White Oak Pl | 0.46mi | 3/2.0 | 1,561 (+12%) | 8mo | $328,000 | $210 | 49 |
| 3131 Silver Bell Trce | 0.47mi | 3/2.0 | 1,568 (+13%) | 8mo | $310,000 | $198 | 48 |
| 3150 Silver Bell Trce | 0.47mi | 3/2.0 | 1,558 (+12%) | 11mo | $324,900 | $209 | 47 |
| 3021 White Oak Pl | 0.44mi | 3/2.0 | 1,587 (+14%) | 11mo | $328,500 | $207 | 45 |
Match score weights: distance 35% · size 25% · config 20% · recency 20%. Top-matched comps best support the ARV.
Projected returns pro-forma
-3.0% appreciation · 2.7% rent growth · sell at horizon
- IRR
- 3.7%
- Equity multiple
- 1.14×
- Total profit
- $4,984
- Equity at exit
- $18,638
- IRR
- 12.9%
- Equity multiple
- 2.02×
- Total profit
- $35,532
- Equity at exit
- $10,808
Cash invested: $35,000 (down + closing). Projections, not guarantees.
Landlord ↔ Tenant lean methodology
- Overall (STATE)
- 92 Strongly Landlord-Friendly
- State Arkansas
- 92 Strongly Landlord-Friendly · R+14
- County
- — inherits STATE
- City
- — inherits STATE
ZIP-level market 72762
- Rents YoY
- 2.7%
- Active inventory
- 695
- Price-to-rent
- 6.7×
Monthly cashflow live
- Estimated rent
- $1,556 high interval (Pro) →
- Mortgage (P&I)
- −$656
- Tax from tax record
- −$118 /mo · $1,413/yr
- Insurance
- −$52
- HOA
- −$0
- Vacancy / Maint / Mgmt
- −$327
- Net cashflow
- $404
Break-even live
UW: 25.0% down · 7.5% · 30yr · 1.5% tax · 5.0% vac · 8.0% maint · 8.0% mgmt
Financing live
Cash to close
- Down payment
- $31,250
- Closing costs
- $3,750
- Reserves months
- —
- Total cash needed
- —
Loan-product check · same deal, 3 products live
Conventional
25% down · 7.5% · 30yr
- Down + closing
- —
- Monthly P&I
- —
- Monthly cashflow
- —
- DSCR
- —
- Eligible?
- —
Personal DTI + credit; lowest rate.
DSCR
20% down · 8.5% · 30yr
- Down + closing
- —
- Monthly P&I
- —
- Monthly cashflow
- —
- DSCR
- —
- Eligible?
- —
No personal income docs; deal must DSCR.
Hard money
10% down · 12.0% · 12mo
- Down + closing
- —
- Monthly P&I
- —
- Monthly cashflow
- —
- DSCR
- —
- Eligible?
- —
Short-term bridge; refi at stabilization.
Rent comps 19 comps
| Address | Beds | Baths | Sqft | Rent | $/sqft | DOM | Units | Dist |
|---|---|---|---|---|---|---|---|---|
| 2000 Cypress Pl Springdale, AR | 2.0 | 1.0 | 1044 | $1,395 | $1.34 | 23d | 1 | 0.31mi |
| 2803 Foxwood Dr Springdale, AR | 3.0 | 2.0 | 1722 | $1,900 | $1.10 | 43d | 1 | 0.46mi |
| 3345 W Don Tyson Pkwy Springdale, AR | 2.0 | 1.0 | 875 | $1,295 | $1.48 | 43d | 1 | 0.67mi |
| 1605 Juniper Cir Springdale, AR | 2.0 | 1.0 | 901 | $1,025 | $1.14 | 14d | 1 | 0.70mi |
| 1605 Juniper Cir Unit C Springdale, AR | 2.0 | 1.0 | 901 | $1,025 | $1.14 | 21d | 1 | 0.70mi |
| 2209 Ellington Dr Unit A Springdale, AR | 2.0 | 2.5 | 1150 | $1,300 | $1.13 | 43d | 1 | 0.80mi |
| 2205 Ellington Dr Unit D Springdale, AR | 2.0 | 2.5 | 1150 | $1,300 | $1.13 | 14d | 1 | 0.81mi |
| 5702 Sara St Unit A Fayetteville, AR | 2.0 | 1.5 | 1034 | $1,250 | $1.21 | 23d | 1 | 0.83mi |
| Slape St Fayetteville, AR | 2.0 | 2.5 | 1200 | $1,250 | $1.04 | 23d | 1 | 0.86mi |
| 2509 Meadow Vw Fayetteville, AR | 2.0 | 2.5 | 1200 | $1,250 | $1.04 | 14d | 1 | 0.87mi |
| 5817 Slape St Fayetteville, AR | 2.0 | 2.5 | 1200 | $1,250 | $1.04 | 43d | 1 | 0.87mi |
| 5809 Samantha St Unit B Fayetteville, AR | 2.0 | 1.5 | 1035 | $1,395 | $1.35 | 43d | 1 | 0.93mi |
| 5902 Samantha St Unit B Fayetteville, AR | 2.0 | 1.5 | 1034 | $1,300 | $1.26 | 23d | 1 | 0.96mi |
| 3906 Celeste Dr Springdale, AR | 1.0–2.0 | 1.0–2.0 | 826 | $1,375 | $1.66 | 14d | 15 | 1.00mi |
| 4230 NW Meadow Creek Cir Unit 306 Fayetteville, AR | 2.0 | 2.0 | 990 | $1,450 | $1.46 | 43d | 1 | 1.19mi |
| 2736 Jean St Springdale, AR | 4.0 | 2.0 | 1668 | $1,950 | $1.17 | 14d | 1 | 1.21mi |
| 502 Black Oak Ave Springdale, AR | 2.0 | 1.0 | 900 | $1,105 | $1.23 | 14d | 2 | 1.23mi |
| 4190 NW Meadow Creek Cir Unit 207 Fayetteville, AR | 2.0 | 2.0 | 1158 | $1,950 | $1.68 | 43d | 1 | 1.24mi |
| 2450 W Jane Circle Dr Fayetteville, AR | 3.0 | 2.0 | 1620 | $1,865 | $1.15 | 14d | 1 | 1.39mi |
Listing history 3 events
-
2026-02-11status Pending
-
2026-02-10$125,000 Active
-
1989-06-20soldstatus $42,000
ⓘ Source: listings_history table (triggers on properties + properties_extension) + one-shot
backfill from property_details.listing_events for pre-trigger history.
Tax reassessment forecast AR · Resets to sale price
- Current annual tax
- $1,413 · $118/mo
- Projected year-2 tax
- $1,413 · $118/mo
- Expected delta
- $0/yr ($0/mo · 0.0%)
ⓘ Screening estimate from a state-policy table — verify with the county assessor before closing.
Climate risk First Street
- Flood 1/10 Low FEMA zone X (unshaded) · 0% chance over 30 yrs
- Wildfire 4/10 Moderate
- Heat 5/10 Major 7 d/yr ≥105°F today · 20 d/yr by 30 yrs out
- Wind 2/10 Low 2% chance of damaging wind over 30 yrs
- Air quality 1/10 Low 0 unhealthy d/yr today · 0 by 30 yrs out
Nearby sold comps map
Loading sold comps map…
Walkable amenities ~0.75 mi
Loading nearby amenities…
Taxation est. · year 1
- Rental income
- $18,668
- − Mortgage interest
- −$7,002
- − Property taxes
- −$1,413
- − Insurance
- −$625
- − Repairs & maintenance
- −$1,493
- − Management
- −$1,493
- − Depreciation
- −$3,636
- Taxable income
- $3,005
- Est. tax owed @ 24.0%
- −$721
- After-tax cash flow
- $4,122/yr
For passive investors: Depreciation is non-cash, so a rental often shows a tax loss while cash-flowing — sheltering income. Rental losses are passive: they offset passive income freely, and up to $25,000/yr can offset ordinary (W-2) income if you actively participate and your MAGI is under $100k (phasing out to $0 by $150k); unused losses carry forward. On sale, claimed depreciation is recaptured at up to 25%, and gains may owe capital-gains tax (a 1031 exchange can defer both). Figures are a year-1 estimate at your 24.0% rate — not tax advice; consult a CPA.
Schools (NCES district)
- District
- Springdale School District
- NCES district ID
- 0512660
- Math proficiency
- 38% ▼ -11.00%
- Reading proficiency
- 35% ▼ -6.00%
- Median HH income
- $45,469
- Composite
- 31.18/100
- National rank
- #6046
- State rank
- #100 of 238 in AR
Livability — Springdale
- Score
- 70/100
- State rank
- #48
- US rank
- #7326
Category grades
Schools grade is shown separately in the Schools card above.
Census & demographics
- Census place
- Springdale, AR
- County
- Washington County · 252,056 people
- City population
- 104,811
- Metro
- Fayetteville-Springdale-Rogers, AR
- Population (ZIP)
- 46,092
- Household income
- $82,228
- Rent vs Own
- Severe rent burden
- 719.0
Population outlook (Washington County) Hauer SSP2
- Today (2025)
- 271,748 people
- By 2030
- 296,414 · +9.1%
- By 2040
- 346,874 · +27.6%
- By 2050
- 398,552 · +46.7%
- By 2075
- 523,309 · +92.6%
- By 2100
- 615,280 · +126.4%
Race, ethnicity, and origin ACS 2023
- Neighborhood character
- Diverse neighborhood (Simpson 0.62)
- Race & ethnicity
- White 55% Hispanic / Latino 27% Two or more races 23% Pacific Islander 3% Asian 2% Black 1%
- Hispanic origin (detail)
- Mexican 21%
- Common ancestry
- Italian 3% Slovak 2% Lithuanian 1%
- Foreign-born
- 15% · Canada, Jamaica
- Languages at home
- 75% English-only · Spanish 21% Other Asian/Pacific 3%
Political lean MEDSL · Washington
- 2024 margin
- Lean R (+6.7) · D 45.1% · R 51.7% · Other 3.2%
- 2008→2024 swing
- +6.4pp toward D · 2008: -13.1pp · 2024: -6.7pp
- All cycles
- 2024: R+6.7 2020: R+3.9 2016: R+10.4 2012: R+16.3 2008: R+13.1
Not yet ingested
- Civics
- —
Market trends
- HPI YoY
- ▼ -258.50%
- Current HPI
- 291.4661
- Rent YoY
- ▲ 2.70%
- Metro
- Fayetteville-Springdale-Rogers, AR
- State GDP YoY
- ▲ 3.80%
- F500 in state
- 10
Industry mix (Fortune 500 HQ in AR)
| Industry | F500 HQs | Revenue |
|---|---|---|
| Retail | 1 | $681B |
|
||
| Food / Agriculture | 1 | $53B |
|
||
| Retail / Energy | 1 | $22B |
|
||
| Transportation / Logistics | 1 | $12B |
|
||
| Energy | 1 | $4B |
|
||
Price history
+197.6% since first listed3 events — show timeline
- 2026-02-11 Pending — NWARMLS
- 2026-02-10 Listed $125,000 NWARMLS
- 1989-06-20 Sold (Public Records) $42,000 Public Records
Property tax history
+3.6%/yrLatest (2025): $1,413 · +8.5% YoY. Source: county tax records.
Cash-flow waterfall
monthlySold comps — $/sqft
last 12 mo · ≤1 miLoading sold comps…