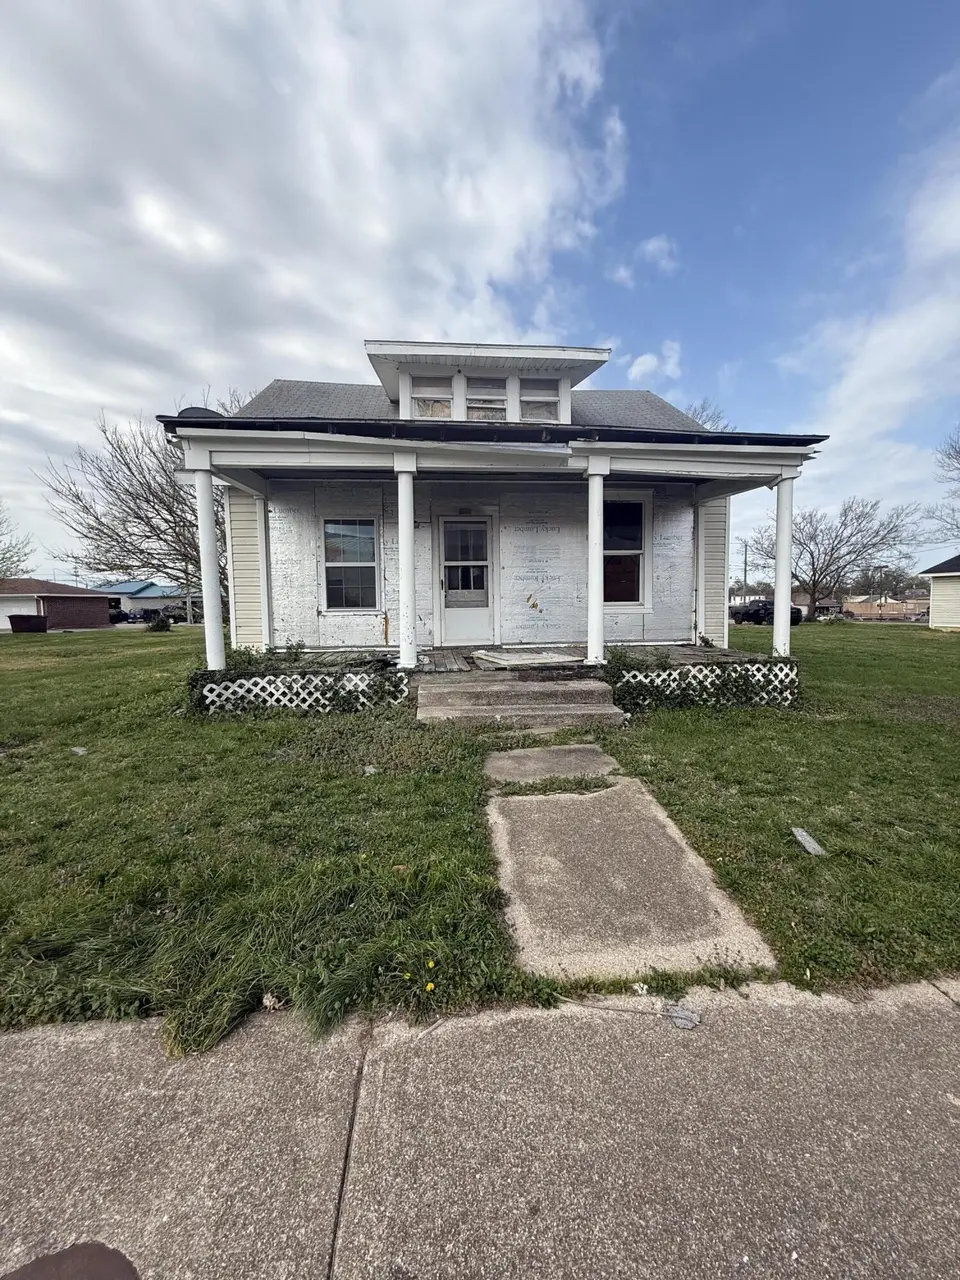
467 N Adams Ave · Lebanon, MO
Flood risk 1/10 · Minimal
- FEMA flood zone
- X (unshaded)
- Chance of flooding over 30 yrs
- 0.0%
- Est. flood insurance / yr
- $507 – $1,088
Fire risk 5/10 · Moderate
- Est. fire insurance / yr
- $1,054 – $1,958
Heat risk 5/10 · Moderate
- Hot days now (above 106°F)
- 7 days/yr
- Hot days in 30 yrs
- 19 days/yr
Wind risk 2/10 · Minimal
- Chance of severe wind over 30 yrs
- 1.0%
Air-quality risk 1/10 · Minimal
- Unhealthy air days now
- 0 days/yr
- Unhealthy air days in 30 yrs
- 0 days/yr
Risk factors via First Street. Map © Google.
Why this score? — see what drove the D grade
The composite is a weighted blend of 9 inputs, each scored 0–100. Each bar is that input's sub-score; the figure is the points it added to the 100-point composite (weight × sub-score).
- Cash flow +15.0/30.0
- ARV discount +7.5/15.0
- 1% rule +5.0/10.0
- DSCR +5.0/10.0
- Livability +3.2/5.0
- Schools +2.7/10.0
- Rent growth +2.5/5.0
- Condition / age +2.5/5.0
- Appreciation +0.0/10.0
$25,000
🖨 Deal sheet 📄 Offer letter ✓ Due diligence
Listing remarks
Historic Home Rebuild OpportunityThis is a true rebuild opportunity for an investor or builder looking to restore and modernize a historic home in a prime in-town location and is being sold in 'as-is' condition. Originally built in 1882, this 2-bedroom, 1-bath home sits on a 150' x 45' lot just 2 blocks off Main Street, 1 block from the grocery store, and directly across from a youth sports complex. The location alone makes this a rare find at this price point. The home is not a cosmetic rehab and is priced accordingly. It offers the opportunity to rework the layout and expand, including the potential to add a second-story primary suite off the back while maintaining the existing footprint.
Key facts
- Rezoned commercial
- 150 x 45 lot
- 6,970 sq ft lot
Tags
Property features AI
Finance
- Other: Lot dimensions approximately 45' x 150' (0.16 acre)
- Financial info: Financial details not provided
- HOA & community: HOA information not provided
Exterior
- Parking: Parking details not provided
- Security: Security details not provided
- Utilities: Public water; Public sewer
- Home design: Single family residence; Residential property; Two-story
- Construction: Construction details not provided
- Exterior features: Asphalt road frontage; Frontage on a public maintained city street; Cross street: 5th; Directions: From I-44, take Lebanon exit, go N on Jefferson, W on 4th, N on Adams. Home on left.
Interior
- Kitchen: Kitchen details not provided
- Bedrooms: Bedrooms information not provided
- Flooring: Flooring details not provided
- Bathrooms: 1 full bathroom
- Heating & cooling: No heating; No cooling
- Interior features: Two levels
- Laundry & utility: Laundry and utility details not provided
Neighborhood map
What this means for you Summary
Snapshot
- This is a 3-bed/1.0-bath other listed at $25k.
Deal economics
- At list price, monthly cash flow is $694 ($8k/yr) — positive.
- The deal already cash-flows at list — no discount required.
- Meets the 1% rule at list price ($1k rent vs $25k).
- Recommended offer: $24k (3.0% below list) — sets the bar for market timing.
- Cap rate 39.6% vs local median 3.7% in Lebanon — top-decile yield for the area; either an underpriced asset or a hidden risk that comps aren't pricing in. Stress-test before assuming the spread holds.
Location & tenants
- Location reads 64/100 on livability (#308 in MO) — a middle-class / working-renter tenant base. Strengths: cost of living A+, housing A+, health & safety A-; Watch: crime D, amenities F, commute F.
- Lebanon R-III (town): math 29% / reading 35% proficiency, ranked #256 of 324 in MO (top 79%) — families likely to look elsewhere, expect single-tenant / working-renter base with shorter leases.
- Zoned schools: Lebanon Middle School (math 33% / reading 35%, grade F, #255 of 391 statewide, top 66%, 921 students, 59% FRL); Lebanon Sr. High (math 16% / reading 34%, grade F, #435 of 521 statewide, top 83%, 1,474 students, 50% FRL) — zoned schools at 55% FRL track the district average.
- Market conditions: 256 active listings in the ZIP; 61 units permitted in Laclede County in 2024 (0 in 5+ unit buildings).
Forward outlook
- Local home prices are declining (-3.0%/yr); year-one equity from $173 of loan paydown is wiped out by about $750 of value loss. Plan a longer hold.
- Laclede County population projected at -13% by 2050 — secular population decline; favor cash flow + early exit over multi-decade hold.
- At projected returns (-3.0% appreciation + 3.0% rent growth), your $7k cash investment doubles in ~1 year — after that, you're playing with house money.
Negotiation context
- It's been on market 53 days — a 3% lower offer ($24k) is reasonable based on typical stale-listing flexibility.
Risks & watch-outs
- Watch-outs: built in 1882 — expect roof / HVAC / electrical / plumbing capex.
- Climate carrying-cost: moderate wildfire risk; extreme-heat days projected 7→19/yr by 2055 (HVAC capex compounding) — expect insurance premiums to compound above CPI over the hold.
Questions for the listing agent
- It's been on market 53 days. Have you received any prior offers? Is the seller open to a 3% concession, seller financing, or rate buy-down credit?
- Built in 1882 — when were the roof, HVAC, electrical panel, plumbing, and water heater last replaced?
- Is there a deadline driving the sale (1031 exchange, divorce, estate, relocation)? That informs how much negotiation room exists.
- Schools are D-rated, which usually means shorter tenancies and higher turnover. Who's the typical renter profile here, and what's been the actual vacancy rate?
- Crime grade is D in this area — have there been break-ins, vandalism, or insurance claims at this property in the last 3 years? What carrier currently insures it and at what premium?
- The area grade is low — what's the realistic commute time and amenity access for the typical tenant pool here? Any planned neighborhood developments (good or bad) we should know about?
- What's the average days-on-market for RENTAL listings here right now (not sales)? A rising rental-DOM trend means longer vacancies and softer asking-rent achievability than the comps imply.
- What's the recent tenant-quality profile in this submarket — average credit score on applications, eviction rate, late-payment / NSF rate, and stable-employment percentage? A property-management company in the area should have these aggregated.
- How much new for-sale + rental construction is in the pipeline within 1–3 miles? Heavy new supply typically softens prices + rents 12–24 months out; constrained supply supports both.
Investment metrics
- 1% rule
- 4.27% ✓
- Cap rate
- 39.62%
- Cash-on-cash
- 119.01%
- DSCR
- 6.30
- GRM
- 2.0
CMA / ARV
- ARV (median comp)
- $118,889
- List price
- $25,000
- Delta
- -78.97%
- Verdict
- UNDERPRICED
- Comps
- 20 within 1.0 mi
Projected returns pro-forma
-3.0% appreciation · 3.0% rent growth · sell at horizon
- IRR
- —
- Equity multiple
- 6.74×
- Total profit
- $40,166
- Equity at exit
- $3,728
- IRR
- —
- Equity multiple
- 14.13×
- Total profit
- $91,917
- Equity at exit
- $2,162
Cash invested: $7,000 (down + closing). Projections, not guarantees.
Landlord ↔ Tenant lean methodology
- Overall (STATE)
- 81 Strongly Landlord-Friendly
- State Missouri
- 81 Strongly Landlord-Friendly · R+10
- County
- — inherits STATE
- City
- — inherits STATE
ZIP-level market 65536
- Home prices YoY
- -21.8%
- Active inventory
- 256
- Price-to-rent
- 2.0×
Monthly cashflow live
- Estimated rent
- $1,068 medium interval (Pro) →
- Mortgage (P&I)
- −$131
- Tax from tax record
- −$8 /mo · $99/yr
- Insurance
- −$10
- HOA
- −$0
- Vacancy / Maint / Mgmt
- −$224
- Net cashflow
- $694
Break-even live
UW: 25.0% down · 7.5% · 30yr · 1.5% tax · 5.0% vac · 8.0% maint · 8.0% mgmt
Financing live
Cash to close
- Down payment
- $6,250
- Closing costs
- $750
- Reserves months
- —
- Total cash needed
- —
Loan-product check · same deal, 3 products live
Conventional
25% down · 7.5% · 30yr
- Down + closing
- —
- Monthly P&I
- —
- Monthly cashflow
- —
- DSCR
- —
- Eligible?
- —
Personal DTI + credit; lowest rate.
DSCR
20% down · 8.5% · 30yr
- Down + closing
- —
- Monthly P&I
- —
- Monthly cashflow
- —
- DSCR
- —
- Eligible?
- —
No personal income docs; deal must DSCR.
Hard money
10% down · 12.0% · 12mo
- Down + closing
- —
- Monthly P&I
- —
- Monthly cashflow
- —
- DSCR
- —
- Eligible?
- —
Short-term bridge; refi at stabilization.
Listing history 15 events
-
2026-06-19days on market $25,000 Active 53 DOM
-
2026-06-18days on market $25,000 Active 52 DOM
-
2026-06-17days on market $25,000 Active 51 DOM
-
2026-06-16days on market $25,000 Active 50 DOM
-
2026-06-15days on market $25,000 Active 49 DOM
-
2026-06-14days on market $25,000 Active 47 DOM
-
2026-06-12days on market $25,000 Active 46 DOM
-
2026-06-09days on market $25,000 Active 43 DOM
-
2026-06-08days on market $25,000 Active 42 DOM
-
2026-06-07days on market $25,000 Active 41 DOM
-
2026-06-02days on market $25,000 Active 36 DOM
-
2026-06-01days on market $25,000 Active 35 DOM
-
2026-05-31days on market $25,000 Active 34 DOM
-
2026-05-30days on market $25,000 Active 33 DOM
-
2026-04-27$25,000 Active 1335-char remark
ⓘ Source: listings_history table (triggers on properties + properties_extension) + one-shot
backfill from property_details.listing_events for pre-trigger history.
Tax reassessment forecast MO · Resets to sale price
- Current annual tax
- $99 · $8/mo
- Projected year-2 tax
- $242 · $20/mo
- Expected delta
- +$144/yr (+$12/mo · 146.2%)
ⓘ Screening estimate from a state-policy table — verify with the county assessor before closing.
Climate risk First Street
- Flood 1/10 Low FEMA zone X (unshaded) · 0% chance over 30 yrs
- Wildfire 5/10 Major
- Heat 5/10 Major 7 d/yr ≥106°F today · 19 d/yr by 30 yrs out
- Wind 2/10 Low 100% chance of damaging wind over 30 yrs
- Air quality 1/10 Low 0 unhealthy d/yr today · 0 by 30 yrs out
Nearby sold comps map
Loading sold comps map…
Walkable amenities ~0.75 mi
Loading nearby amenities…
Taxation est. · year 1
- Rental income
- $12,819
- − Mortgage interest
- −$1,400
- − Property taxes
- −$99
- − Insurance
- −$125
- − Repairs & maintenance
- −$1,026
- − Management
- −$1,026
- − Depreciation
- −$727
- Taxable income
- $8,417
- Est. tax owed @ 24.0%
- −$2,020
- After-tax cash flow
- $6,310/yr
For passive investors: Depreciation is non-cash, so a rental often shows a tax loss while cash-flowing — sheltering income. Rental losses are passive: they offset passive income freely, and up to $25,000/yr can offset ordinary (W-2) income if you actively participate and your MAGI is under $100k (phasing out to $0 by $150k); unused losses carry forward. On sale, claimed depreciation is recaptured at up to 25%, and gains may owe capital-gains tax (a 1031 exchange can defer both). Figures are a year-1 estimate at your 24.0% rate — not tax advice; consult a CPA.
Schools (NCES district)
- District
- Lebanon R-III
- NCES district ID
- 2918270
- Math proficiency
- 29% ▼ -10.00%
- Reading proficiency
- 35% ▼ -8.00%
- Median HH income
- $38,352
- Composite
- 26.73/100
- National rank
- #7145
- State rank
- #256 of 324 in MO
Livability — Lebanon
- Score
- 64/100
- State rank
- #308
- US rank
- #14040
Category grades
Schools grade is shown separately in the Schools card above.
Census & demographics
- Census place
- Lebanon, MO
- County
- Laclede County · 29,915 people
- City population
- 29,915
- Metro
- Lebanon, MO
- Population (ZIP)
- 29,915
- Household income
- $53,783
- Rent vs Own
- Severe rent burden
- 641.0
Population outlook (Laclede County) Hauer SSP2
- Today (2025)
- 34,730 people
- By 2030
- 33,985 · -2.1%
- By 2040
- 32,213 · -7.2%
- By 2050
- 30,189 · -13.1%
- By 2075
- 24,782 · -28.6%
- By 2100
- 18,554 · -46.6%
Race, ethnicity, and origin ACS 2023
- Neighborhood character
- Predominantly White (90%)
- Race & ethnicity
- White 90% Two or more races 6% Hispanic / Latino 3%
- Common ancestry
- Lithuanian 2% Iranian 2% Italian 2%
- Foreign-born
- 2% · Canada
- Languages at home
- 97% English-only · Spanish 2% German/W. Germanic 1%
Political lean MEDSL · Laclede
- 2024 margin
- Solid R (+66.8) · D 16.1% · R 82.9%
- 2008→2024 swing
- +212.7pp toward D · 2008: -279.5pp · 2024: -66.8pp
- All cycles
- 2024: R+66.8 2020: R+65.4 2016: R+64.5 2012: R+44.5 2008: R+279.5
Not yet ingested
- Civics
- —
Market trends
- HPI YoY
- ▼ -54.82%
- Current HPI
- 196.7643
- Rent YoY
- —
- Metro
- Lebanon, MO
- State GDP YoY
- ▲ 1.84%
- F500 in state
- 20
Industry mix (Fortune 500 HQ in MO)
| Industry | F500 HQs | Revenue |
|---|---|---|
| Healthcare | 1 | $163B |
|
||
| Insurance | 1 | $21B |
|
||
| Industrial Technology | 1 | $17B |
|
||
| Retail | 1 | $16B |
|
||
| Industrial Distribution | 1 | $10B |
|
||
| Utilities | 1 | $9B |
|
||
Price history
1 event — show timeline
- 2026-04-27 Listed $25,000 SOMO
Property tax history
-17.0%/yrLatest (2025): $99 · -31.2% YoY. Source: county tax records.
Cash-flow waterfall
monthlySold comps — $/sqft
last 12 mo · ≤1 miLoading sold comps…