 🏷️ Likely Rental
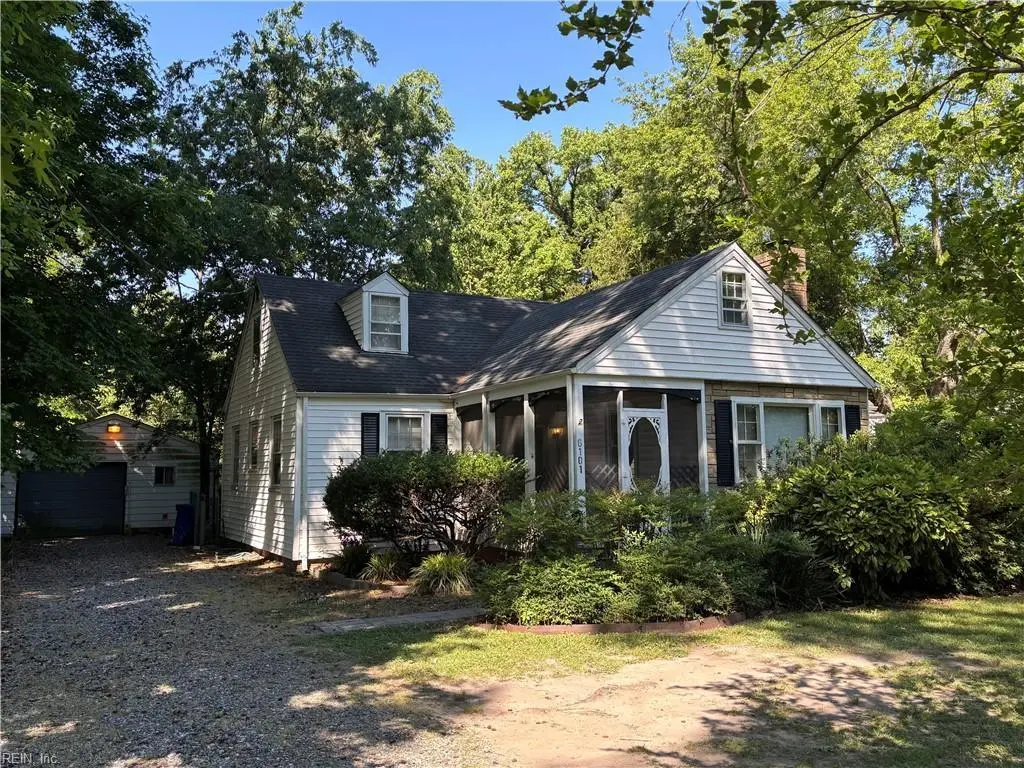
6101 Roanoke Ave · Newport News, VA
Flood risk 6/10 · Moderate
- FEMA flood zone
- X (unshaded)
- Chance of flooding over 30 yrs
- 0.73%
- Est. flood insurance / yr
- $507 – $1,088
Fire risk 1/10 · Minimal
- Est. fire insurance / yr
- $666 – $1,236
Heat risk 9/10 · Severe
- Hot days now (above 106°F)
- 7 days/yr
- Hot days in 30 yrs
- 15 days/yr
Wind risk 8/10 · Major
- Chance of severe wind over 30 yrs
- 80.0%
Air-quality risk 2/10 · Minimal
- Unhealthy air days now
- 1 days/yr
- Unhealthy air days in 30 yrs
- 1 days/yr
Risk factors via First Street. Map © Google.
Why this score? — see what drove the C+ grade
The composite is a weighted blend of 9 inputs, each scored 0–100. Each bar is that input's sub-score; the figure is the points it added to the 100-point composite (weight × sub-score).
- Cash flow +21.2/30.0
- ARV discount +15.0/15.0
- DSCR +6.7/10.0
- 1% rule +4.9/10.0
- Rent growth +4.7/5.0
- Schools +3.8/10.0
- Livability +3.8/5.0
- Condition / age +2.5/5.0
- Appreciation +0.0/10.0
$275,000
🖨 Deal sheet 📄 Offer letter ✓ Due diligence
Listing remarks
CALLING ALL INVESTORS. THIS HOME FEATURES TWO SEPARATE DWELLING UNITS THAT RENT SEPARATELY, WITH SEPARATE ELECTRIC METERS. THE LARGER UNIT IS 1,500 SF FEATURING AN OPEN KITCHEN/LIVING AREA, TWO FULL BATHS AND THREE BEDROOMS. THE SMALLER UNIT IS 750 SF WITH A FULL KITCHEN, 2 BEDROOMS AND 1 FULL BATH. TOGETHER THESE UNITS WILL RENT FOR $2,000 PER MONTH OR MORE. BOTH UNITS HAVE COVERED DECKS, FENCED BACK YARDS, AND STORAGE SPACE IN THE DETACHED GARAGE. CASH BUYERS ONLY. BEING SOLD AS IS. OPEN HOUSE SATURDAY, MAY 22, 12:00-3:00 PM.
Key facts
- Fenced back yard
- Deck
- Storage area
Tags
Property features AI
Finance
- HOA & community: No HOA fees
Exterior
- Parking: Detached 1-car garage; Driveway parking; 448 sq ft garage
- Utilities: City water; City sewer; Electric water heater
- Home design: Detached Cape Cod; 2 stories; Crawl foundation; City view
- Construction: Vinyl siding; Asphalt shingle roof
- Exterior features: Patio; Screened porch; Back yard fenced with chain-link fence
Interior
- Kitchen: Dishwasher; Microwave; Gas range; Electric range; Refrigerator
- Bedrooms: Master bedroom; Additional bedroom; In-law suite; Attic
- Flooring: Vinyl flooring; Wood flooring
- Bathrooms: 3 full bathrooms; Master bedroom with bath
- Heating & cooling: Forced hot air; Heat pump; Natural gas heating; Central air conditioning; Window/Wall air conditioning
- Interior features: Ceiling fan; Wood-burning fireplace
- Laundry & utility: Washer; Dryer; Utility room on first floor
Neighborhood map
What this means for you Summary
Snapshot
- This is a 5-bed/2.0-bath single-family listed at $275k.
Deal economics
- At list price, monthly cash flow is $396 ($5k/yr) — positive.
- The deal already cash-flows at list — no discount required.
- To meet the 1% rule (rent ≥ 1% of price), the offer needs to be $273k (0.8% below list).
- Recommended offer: $271k (1.5% below list) — sets the bar for market timing.
- Cap rate 8.0% vs local median 4.2% in Newport News — top-decile yield for the area; either an underpriced asset or a hidden risk that comps aren't pricing in. Stress-test before assuming the spread holds.
Location & tenants
- Location reads 75/100 on livability (#123 in VA, #4,018 nationally) — a middle-class / working-renter tenant base. Strengths: health & safety A+, cost of living A, housing A; Watch: crime F, commute F.
- Newport News City Public School District (urban): math 34% / reading 54% proficiency, ranked #112 of 131 in VA (top 86%) — families likely to look elsewhere, expect single-tenant / working-renter base with shorter leases.
- Zoned schools: Carver Elementary (math 14% / reading 32%, grade F, #1,066 of 1,108 statewide, top 96%, 600 students, 90% FRL); Heritage High (math 49% / reading 67%, grade C, #262 of 319 statewide, top 82%, 1,111 students, 85% FRL) — zoned schools average 88% FRL vs 55% district-wide (33 pts higher); higher-poverty schools than district average — tighter screening recommended.
- Market conditions: Rents rising fast (+8.9%/yr); 42 active listings in the ZIP; 3 comparable units currently listed for rent nearby; rentals at typical pace (median 15d on market — plan ~3-4 weeks tenant-placement turnaround); 522 units permitted in Newport News city in 2024 (458 in 5+ unit buildings).
- At $2,729/mo this rent would consume 61% of the median local household income ($54k/yr) (locally 1119% of renters already pay >50% of income on rent) — very limited rent-growth headroom before tenants either downsize or default.
Forward outlook
- Local home prices are declining (-3.0%/yr); year-one equity from $2k of loan paydown is wiped out by about $8k of value loss. Plan a longer hold.
- Newport News County population projected to shrink 8% by 2050 — rents likely to lag national; underwrite the cash flow, not the appreciation.
- At projected returns (-3.0% appreciation + 8.0% rent growth), your $77k cash investment doubles in ~9 years — after that, you're playing with house money.
Negotiation context
- It's been on market 28 days — a 2% lower offer ($271k) is reasonable based on typical stale-listing flexibility.
- Current owner paid $34k; list at $275k implies a 715% gain — meaningful room to come down on a strong offer.
Risks & watch-outs
- Watch-outs: built in 1940 — expect roof / HVAC / electrical / plumbing capex.
- Climate carrying-cost: major flood risk; severe wind risk, 80% chance of damaging wind over 30y; extreme-heat days projected 7→15/yr by 2055 (HVAC capex compounding) — expect insurance premiums to compound above CPI over the hold.
Questions for the listing agent
- Built in 1940 — when were the roof, HVAC, electrical panel, plumbing, and water heater last replaced?
- Is there a deadline driving the sale (1031 exchange, divorce, estate, relocation)? That informs how much negotiation room exists.
- Schools are B-rated — typically a magnet for longer-tenancy family renters. What's the average tenant stay here, and is there a school-zone premium baked into asking?
- Crime grade is F in this area — have there been break-ins, vandalism, or insurance claims at this property in the last 3 years? What carrier currently insures it and at what premium?
- What's the average days-on-market for RENTAL listings here right now (not sales)? A rising rental-DOM trend means longer vacancies and softer asking-rent achievability than the comps imply.
- What's the recent tenant-quality profile in this submarket — average credit score on applications, eviction rate, late-payment / NSF rate, and stable-employment percentage? A property-management company in the area should have these aggregated.
- How much new for-sale + rental construction is in the pipeline within 1–3 miles? Heavy new supply typically softens prices + rents 12–24 months out; constrained supply supports both.
Investment metrics
- 1% rule
- 0.99% ✗
- Cap rate
- 8.02%
- Cash-on-cash
- 6.18%
- DSCR
- 1.27
- GRM
- 8.4
CMA / ARV
- ARV (on-the-fly)
- $384,366
- Comps found
- 3
Show comp detail 3 sales within ~0.75 mi
| Address | Dist | Beds/Ba | Sqft | Sold | Price | $/sf | Match |
|---|---|---|---|---|---|---|---|
| 1103 Elizabeth Ct | 0.39mi | 4/2.5 (-1) | 2,280 (+3%) | 2mo | $470,000 | $206 | 68 |
| 5938 Marshall Ave | 0.59mi | 4/3.0 (-1) | 2,227 (+1%) | 6mo | $312,500 | $140 | 57 |
| 5920 Wickham Ave | 0.38mi | 4/2.5 (-1) | 2,446 (+11%) | 3mo | $424,900 | $174 | 55 |
Match score weights: distance 35% · size 25% · config 20% · recency 20%. Top-matched comps best support the ARV.
Projected returns pro-forma
-3.0% appreciation · 8.0% rent growth · sell at horizon
- IRR
- -1.6%
- Equity multiple
- 0.94×
- Total profit
- $-4,948
- Equity at exit
- $41,003
- IRR
- 12.6%
- Equity multiple
- 2.22×
- Total profit
- $93,645
- Equity at exit
- $23,777
Cash invested: $77,000 (down + closing). Projections, not guarantees.
Landlord ↔ Tenant lean methodology
- Overall (STATE)
- 55 Moderately Landlord-Leaning
- State Virginia
- 55 Moderately Landlord-Leaning · D+2
- County
- — inherits STATE
- City
- — inherits STATE
ZIP-level market 23605
- Home prices YoY
- -7.6%
- Rents YoY
- 8.9%
- Active inventory
- 42
- Price-to-rent
- 8.4×
Monthly cashflow live
- Estimated rent
- $2,729 medium interval (Pro) →
- Mortgage (P&I)
- −$1,442
- Tax from tax record
- −$203 /mo · $2,435/yr
- Insurance
- −$115
- HOA
- −$0
- Vacancy / Maint / Mgmt
- −$573
- Net cashflow
- $396
Break-even live
UW: 25.0% down · 7.5% · 30yr · 1.5% tax · 5.0% vac · 8.0% maint · 8.0% mgmt
Financing live
Cash to close
- Down payment
- $68,750
- Closing costs
- $8,250
- Reserves months
- —
- Total cash needed
- —
Loan-product check · same deal, 3 products live
Conventional
25% down · 7.5% · 30yr
- Down + closing
- —
- Monthly P&I
- —
- Monthly cashflow
- —
- DSCR
- —
- Eligible?
- —
Personal DTI + credit; lowest rate.
DSCR
20% down · 8.5% · 30yr
- Down + closing
- —
- Monthly P&I
- —
- Monthly cashflow
- —
- DSCR
- —
- Eligible?
- —
No personal income docs; deal must DSCR.
Hard money
10% down · 12.0% · 12mo
- Down + closing
- —
- Monthly P&I
- —
- Monthly cashflow
- —
- DSCR
- —
- Eligible?
- —
Short-term bridge; refi at stabilization.
Rent comps 3 comps
| Address | Beds | Baths | Sqft | Rent | $/sqft | DOM | Units | Dist |
|---|---|---|---|---|---|---|---|---|
| 621 44th St Newport News, VA | 4.0 | 3.5 | 2100 | $3,000 | $1.43 | 43d | 1 | 1.04mi |
| 3318 Custer Ct Hampton, VA | 4.0 | 2.5 | 1625 | $2,500 | $1.54 | 12d | 1 | 1.21mi |
| 731 Childs Ave Hampton, VA | 5.0 | 3.0 | 2305 | $2,750 | $1.19 | 14d | 1 | 1.42mi |
Listing history 17 events
-
2026-06-18days on market $275,000 Active 28 DOM
-
2026-06-17days on market $275,000 Active 27 DOM
-
2026-06-16days on market $275,000 Active 26 DOM
-
2026-06-15days on market $275,000 Active 25 DOM
-
2026-06-09days on market $275,000 Active 19 DOM
-
2026-06-08days on market $275,000 Active 18 DOM
-
2026-06-07days on market $275,000 Active 17 DOM
-
2026-06-03days on market $275,000 Active 13 DOM
-
2026-06-02days on market $275,000 Active 12 DOM
-
2026-06-01days on market $275,000 Active 11 DOM
-
2026-05-31statusdays on market $275,000 Active 10 DOM
-
2026-05-20$275,000 Active
-
2015-04-17price $58,500
-
2015-03-20price $62,500
-
2015-02-24price $69,500
-
2015-01-28price $77,500
-
1978-11-01soldstatus $33,742
ⓘ Source: listings_history table (triggers on properties + properties_extension) + one-shot
backfill from property_details.listing_events for pre-trigger history.
Tax reassessment forecast VA · Resets to sale price
- Current annual tax
- $2,435 · $203/mo
- Projected year-2 tax
- $2,435 · $203/mo
- Expected delta
- $0/yr ($0/mo · 0.0%)
ⓘ Screening estimate from a state-policy table — verify with the county assessor before closing.
Climate risk First Street
- Flood 6/10 Major FEMA zone X (unshaded) · 73% chance over 30 yrs
- Wildfire 1/10 Low
- Heat 9/10 Extreme 7 d/yr ≥106°F today · 15 d/yr by 30 yrs out
- Wind 8/10 Severe 80% chance of damaging wind over 30 yrs
- Air quality 2/10 Low 1 unhealthy d/yr today · 1 by 30 yrs out
Nearby sold comps map
Loading sold comps map…
Walkable amenities ~0.75 mi
Loading nearby amenities…
Taxation est. · year 1
- Rental income
- $32,748
- − Mortgage interest
- −$15,404
- − Property taxes
- −$2,435
- − Insurance
- −$1,375
- − Repairs & maintenance
- −$2,620
- − Management
- −$2,620
- − Depreciation
- −$8,000
- Taxable income
- $294
- Est. tax owed @ 24.0%
- −$70
- After-tax cash flow
- $4,685/yr
For passive investors: Depreciation is non-cash, so a rental often shows a tax loss while cash-flowing — sheltering income. Rental losses are passive: they offset passive income freely, and up to $25,000/yr can offset ordinary (W-2) income if you actively participate and your MAGI is under $100k (phasing out to $0 by $150k); unused losses carry forward. On sale, claimed depreciation is recaptured at up to 25%, and gains may owe capital-gains tax (a 1031 exchange can defer both). Figures are a year-1 estimate at your 24.0% rate — not tax advice; consult a CPA.
Schools (NCES district)
- District
- Newport News City Public School District
- NCES district ID
- 5102640
- Math proficiency
- 34% ▼ -37.00%
- Reading proficiency
- 54% ▼ -10.00%
- Median HH income
- $49,644
- Composite
- 37.7/100
- National rank
- #4360
- State rank
- #112 of 131 in VA
Livability — Newport News
- Score
- 75/100
- State rank
- #123
- US rank
- #4018
Category grades
Schools grade is shown separately in the Schools card above.
Census & demographics
- Census place
- Newport News, VA
- County
- Newport News City · 178,950 people
- City population
- 178,950
- Metro
- Virginia Beach-Norfolk-Newport News, VA-NC
- Population (ZIP)
- 13,332
- Household income
- $53,815
- Rent vs Own
- Severe rent burden
- 1119.0
Population outlook (Newport News County) Hauer SSP2
- Today (2025)
- 181,076 people
- By 2030
- 179,683 · -0.8%
- By 2040
- 174,649 · -3.5%
- By 2050
- 167,407 · -7.5%
- By 2075
- 147,597 · -18.5%
- By 2100
- 122,144 · -32.5%
Race, ethnicity, and origin ACS 2023
- Neighborhood character
- Diverse neighborhood (Simpson 0.58)
- Race & ethnicity
- Black 59% White 25% Two or more races 9% Hispanic / Latino 8%
- Hispanic origin (detail)
- Mexican 3% Puerto Rican 3%
- Common ancestry
- Romanian 2% Lithuanian 1% Italian 1%
- Foreign-born
- 5% · Canada, Jamaica
- Languages at home
- 94% English-only · Spanish 5%
Political lean MEDSL · Newport News
- 2024 margin
- Strong D (+28.8) · D 63.7% · R 34.9% · Other 1.4%
- 2008→2024 swing
- +0.1pp no change · 2008: 28.7pp · 2024: 28.8pp
- All cycles
- 2024: D+28.8 2020: D+32.9 2016: D+25.4 2012: D+30.0 2008: D+28.7
Not yet ingested
- Civics
- —
Market trends
- HPI YoY
- ▼ -24.94%
- Current HPI
- 305.0997
- Rent YoY
- ▲ 8.87%
- Metro
- Virginia Beach-Norfolk-Newport News, VA-NC
- State GDP YoY
- ▲ 2.40%
- F500 in state
- 50
Industry mix (Fortune 500 HQ in VA)
| Industry | F500 HQs | Revenue |
|---|---|---|
| Aerospace / Defense | 4 | $236B |
|
||
| Technology / Defense | 3 | $32B |
|
||
| Financial Services | 2 | $176B |
|
||
| Utilities | 2 | $27B |
|
||
| Insurance | 2 | $25B |
|
||
| Technology | 2 | $15B |
|
||
Price history
+715.0% since first listed6 events — show timeline
- 2026-05-20 Listed $275,000 REINMLS
- 2015-04-17 Price Changed $58,500 REINMLS
- 2015-03-20 Price Changed $62,500 REINMLS
- 2015-02-24 Price Changed $69,500 REINMLS
- 2015-01-28 Price Changed $77,500 REINMLS
- 1978-11-01 Sold (Public Records) $33,742 Public Records
Property tax history
+2.9%/yrLatest (2026): $2,435 · +18.7% YoY. Source: county tax records.
Cash-flow waterfall
monthlySold comps — $/sqft
last 12 mo · ≤1 miLoading sold comps…