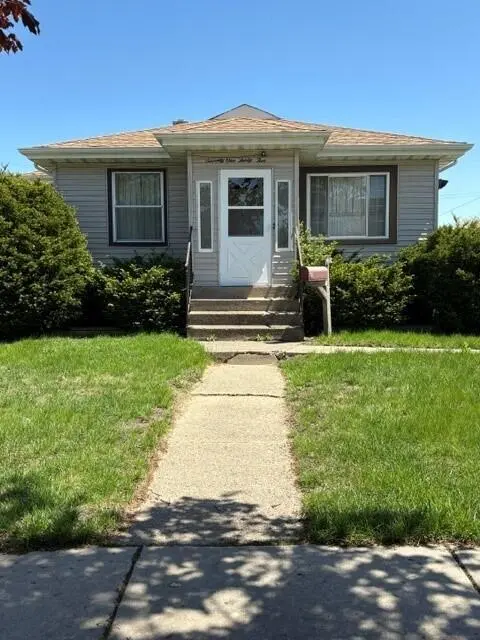
7135 Oakdale Ave · Hammond, IN
Flood risk 3/10 · Minor
- FEMA flood zone
- X (unshaded)
- Chance of flooding over 30 yrs
- 0.2%
- Est. flood insurance / yr
- $473 – $860
Fire risk 1/10 · Minimal
- Est. fire insurance / yr
- $717 – $1,331
Heat risk 3/10 · Minor
- Hot days now (above 102°F)
- 7 days/yr
- Hot days in 30 yrs
- 15 days/yr
Wind risk 2/10 · Minimal
- Chance of severe wind over 30 yrs
- 0.0%
Air-quality risk 4/10 · Minor
- Unhealthy air days now
- 5 days/yr
- Unhealthy air days in 30 yrs
- 6 days/yr
Risk factors via First Street. Map © Google.
Why this score? — see what drove the C- grade
The composite is a weighted blend of 9 inputs, each scored 0–100. Each bar is that input's sub-score; the figure is the points it added to the 100-point composite (weight × sub-score).
- Cash flow +21.1/30.0
- DSCR +6.7/10.0
- ARV discount +6.6/15.0
- 1% rule +5.2/10.0
- Rent growth +3.9/5.0
- Livability +3.5/5.0
- Condition / age +2.5/5.0
- Schools +1.1/10.0
- Appreciation +0.0/10.0
$179,900
🖨 Deal sheet 📄 Offer letter ✓ Due diligence
Listing remarks
Terrific Investment Opportunity, or Update and make this Affordable Home your Own. This 3 Bedroom, 1,378' Sq. ft. Home over Basement and 1.5 Car Garage is Located in the Well-Kept Buena Vista Neighborhood. Recent Updates Include: Windows, Vinyl Siding, Eaves, Soffits, Gutters, Architectural Roof, and Exterior Doors. The Interior is in need of Cosmetic Updates. With its Close Proximity to Restaurants, Shopping, Entertainment, and the Expressway (if commuting to Chicago 80/94 is less than 5 minutes away), this Home is a Truly MUST-SEE! The City of Hammond also Offers the College Bound Scholarship Program. Visit the City of Hammonds Website for Details.
Key facts
- Recent updates
- 6,250 sq ft lot
- Garage
Tags
Property features AI
Exterior
- Parking: Garage (approximately 1.5 car capacity)
- Utilities: Public water; Public sewer
- Home design: Single-story home; Built in 1949; One-level entry
- Construction: Unfinished basement
- Exterior features: Neighborhood view
Interior
- Kitchen: Range; Refrigerator
- Bedrooms: Primary bedroom; Bedroom 2; Bedroom 3; Bonus room
- Bathrooms: 1 full bathroom
- Heating & cooling: Natural gas heating; Central air conditioning
- Interior features: Other interior features; Neighborhood view from the property
- Laundry & utility: Unfinished basement available for utilities or storage
Neighborhood map
What this means for you Summary
Snapshot
- This is a 3-bed/1.0-bath single-family listed at $180k.
Deal economics
- At list price, monthly cash flow is $256 ($3k/yr) — positive.
- The deal already cash-flows at list — no discount required.
- Meets the 1% rule at list price ($2k rent vs $180k).
- Cap rate 8.0% vs local median 5.8% in Hammond — top-decile yield for the area; either an underpriced asset or a hidden risk that comps aren't pricing in. Stress-test before assuming the spread holds.
Location & tenants
- Location reads 70/100 on livability (#143 in IN) — a middle-class / working-renter tenant base. Strengths: cost of living A+, housing A+, commute A; Watch: health & safety D+, employment D, schools F.
- School City Of Hammond (suburban): math 8% / reading 18% proficiency, ranked #289 of 301 in IN (top 96%) — low school quality limits family demand, transient renter base, plan for 1-2y turnover; 74% free/reduced lunch — lower-income household profile, screen leases tightly.
- Market conditions: Rents rising fast (+5.5%/yr); 63 active listings in the ZIP; 10 comparable units currently listed for rent nearby; rentals at typical pace (median 17d on market — plan ~3-4 weeks tenant-placement turnaround); 1,642 units permitted in Lake County in 2024 (14 in 5+ unit buildings).
- This rent runs 35% of the median local income ($63k/yr) — at the standard rent-burdened threshold; future hikes will face affordability resistance.
Forward outlook
- Local home prices are declining (-3.0%/yr); year-one equity from $1k of loan paydown is wiped out by about $5k of value loss. Plan a longer hold.
- Lake County population projected to shrink 7% by 2050 — rents likely to lag national; underwrite the cash flow, not the appreciation.
Negotiation context
- Only 12 days on market — expect competitive offers; lowballing is unlikely to land.
Risks & watch-outs
- Watch-outs: built in 1949 — expect roof / HVAC / electrical / plumbing capex.
Questions for the listing agent
- Built in 1949 — when were the roof, HVAC, electrical panel, plumbing, and water heater last replaced?
- Is there a deadline driving the sale (1031 exchange, divorce, estate, relocation)? That informs how much negotiation room exists.
- Schools are F-rated, which usually means shorter tenancies and higher turnover. Who's the typical renter profile here, and what's been the actual vacancy rate?
- Crime grade is F in this area — have there been break-ins, vandalism, or insurance claims at this property in the last 3 years? What carrier currently insures it and at what premium?
- What's the average days-on-market for RENTAL listings here right now (not sales)? A rising rental-DOM trend means longer vacancies and softer asking-rent achievability than the comps imply.
- What's the recent tenant-quality profile in this submarket — average credit score on applications, eviction rate, late-payment / NSF rate, and stable-employment percentage? A property-management company in the area should have these aggregated.
- How much new for-sale + rental construction is in the pipeline within 1–3 miles? Heavy new supply typically softens prices + rents 12–24 months out; constrained supply supports both.
Investment metrics
- 1% rule
- 1.02% ✓
- Cap rate
- 8.00%
- Cash-on-cash
- 6.11%
- DSCR
- 1.27
- GRM
- 8.2
CMA / ARV
- ARV (on-the-fly)
- $176,384
- Comps found
- 12
Show comp detail 12 sales within ~0.75 mi
| Address | Dist | Beds/Ba | Sqft | Sold | Price | $/sf | Match |
|---|---|---|---|---|---|---|---|
| 7319 Oakdale Ave | 0.22mi | 3/1.0 | 1,220 (-12%) | 5mo | $197,000 | $161 | 67 |
| 7019 Chestnut Ave | 0.47mi | 3/1.0 | 1,440 (+4%) | 6mo | $135,000 | $94 | 66 |
| 737 Cherry St | 0.52mi | 3/1.0 | 1,312 (-5%) | 3mo | $145,000 | $111 | 65 |
| 6736 Columbia Ave | 0.53mi | 3/1.0 | 1,274 (-8%) | 7mo | $131,000 | $103 | 57 |
| 7027 Monroe Ave | 0.48mi | 4/1.0 (+1) | 1,280 (-7%) | 5mo | $163,500 | $128 | 57 |
| 7341 Harrison Ave | 0.70mi | 4/2.0 (+1) | 1,365 (-1%) | 2mo | $201,995 | $148 | 55 |
| 1135 169th St | 0.38mi | 4/2.0 (+1) | 1,248 (-9%) | 4mo | $195,000 | $156 | 54 |
| 7613 Monroe Ave | 0.74mi | 4/1.0 (+1) | 1,330 (-4%) | 1mo | $196,000 | $147 | 54 |
| 925 Cherry St | 0.43mi | 3/1.5 | 1,178 (-14%) | 3mo | $130,000 | $110 | 51 |
| 939 175th Pl | 0.48mi | 4/1.5 (+1) | 1,508 (+9%) | 7mo | $180,000 | $119 | 50 |
| 7609 Jarnecke Ave | 0.58mi | 4/1.0 (+1) | 1,512 (+10%) | 5mo | $199,500 | $132 | 48 |
| 7240 Harrison Ave | 0.69mi | 3/1.0 | 1,253 (-9%) | 6mo | $145,000 | $116 | 47 |
Match score weights: distance 35% · size 25% · config 20% · recency 20%. Top-matched comps best support the ARV.
Projected returns pro-forma
-3.0% appreciation · 5.51% rent growth · sell at horizon
- IRR
- -4.2%
- Equity multiple
- 0.84×
- Total profit
- $-8,094
- Equity at exit
- $26,824
- IRR
- 8.1%
- Equity multiple
- 1.68×
- Total profit
- $34,404
- Equity at exit
- $15,554
Cash invested: $50,372 (down + closing). Projections, not guarantees.
Landlord ↔ Tenant lean methodology
- Overall (STATE)
- 90 Strongly Landlord-Friendly
- State Indiana
- 90 Strongly Landlord-Friendly · R+11
- County
- — inherits STATE
- City
- — inherits STATE
ZIP-level market 46324
- Home prices YoY
- -9.6%
- Rents YoY
- 5.5%
- Active inventory
- 63
- Price-to-rent
- 8.2×
Monthly cashflow live
- Estimated rent
- $1,828 high interval (Pro) →
- Mortgage (P&I)
- −$943
- Tax from tax record
- −$170 /mo · $2,036/yr
- Insurance
- −$75
- HOA
- −$0
- Vacancy / Maint / Mgmt
- −$384
- Net cashflow
- $256
Break-even live
UW: 25.0% down · 7.5% · 30yr · 1.5% tax · 5.0% vac · 8.0% maint · 8.0% mgmt
Financing live
Cash to close
- Down payment
- $44,975
- Closing costs
- $5,397
- Reserves months
- —
- Total cash needed
- —
Loan-product check · same deal, 3 products live
Conventional
25% down · 7.5% · 30yr
- Down + closing
- —
- Monthly P&I
- —
- Monthly cashflow
- —
- DSCR
- —
- Eligible?
- —
Personal DTI + credit; lowest rate.
DSCR
20% down · 8.5% · 30yr
- Down + closing
- —
- Monthly P&I
- —
- Monthly cashflow
- —
- DSCR
- —
- Eligible?
- —
No personal income docs; deal must DSCR.
Hard money
10% down · 12.0% · 12mo
- Down + closing
- —
- Monthly P&I
- —
- Monthly cashflow
- —
- DSCR
- —
- Eligible?
- —
Short-term bridge; refi at stabilization.
Rent comps 10 comps
| Address | Beds | Baths | Sqft | Rent | $/sqft | DOM | Units | Dist |
|---|---|---|---|---|---|---|---|---|
| 7129 Columbia Ave Unit 1E Hammond, IN | 2.0 | 1.0 | 900 | $1,195 | $1.33 | 11d | 1 | 0.17mi |
| 7234 Columbia Ave Hammond, IN | 2.0 | 1.0 | 960 | $1,300 | $1.35 | 24d | 1 | 0.20mi |
| 7019 Chestnut Ave Hammond, IN | 3.0 | 1.5 | 1440 | $1,895 | $1.32 | 20d | 1 | 0.43mi |
| 7610 Manor Ave Munster, IN | 3.0 | 2.0 | 1700 | $4,750 | $2.79 | 1d | 1 | 1.08mi |
| 7611 Kinsley Pl Munster, IN | 3.0 | 2.0 | 1700 | $4,700 | $2.76 | 1d | 1 | 1.11mi |
| 232 Gregory Ave Munster, IN | 3.0 | 1.5 | 1600 | $2,450 | $1.53 | 1d | 1 | 1.21mi |
| 3649 173rd Ct Lansing, IL | 2.0 | 2.0 | 972 | $1,357 | $1.40 | 24d | 1 | 1.27mi |
| 407 Kenwood St Hammond, IN | 2.0 | 1.0 | 920 | $1,495 | $1.62 | 24d | 1 | 1.32mi |
| 407 Kenwood St Hammond, IN | 2.0 | 1.0 | 920 | $1,495 | $1.62 | 16d | 1 | 1.32mi |
| 1539 Wentworth Ave Unit 3W Calumet City, IL | 3.0 | 1.0 | 1100 | $1,700 | $1.55 | 12d | 1 | 1.41mi |
Listing history 2 events
-
2026-05-12status Pending
-
2026-04-30$179,900 Active
ⓘ Source: listings_history table (triggers on properties + properties_extension) + one-shot
backfill from property_details.listing_events for pre-trigger history.
Tax reassessment forecast IN · Partial reset (capped growth)
- Current annual tax
- $2,036 · $170/mo
- Projected year-2 tax
- $2,036 · $170/mo
- Expected delta
- $0/yr ($0/mo · 0.0%)
ⓘ Screening estimate from a state-policy table — verify with the county assessor before closing.
Climate risk First Street
- Flood 3/10 Moderate FEMA zone X (unshaded) · 20% chance over 30 yrs
- Wildfire 1/10 Low
- Heat 3/10 Moderate 7 d/yr ≥102°F today · 15 d/yr by 30 yrs out
- Wind 2/10 Low 0% chance of damaging wind over 30 yrs
- Air quality 4/10 Moderate 5 unhealthy d/yr today · 6 by 30 yrs out
Nearby sold comps map
Loading sold comps map…
Walkable amenities ~0.75 mi
Loading nearby amenities…
Taxation est. · year 1
- Rental income
- $21,941
- − Mortgage interest
- −$10,077
- − Property taxes
- −$2,036
- − Insurance
- −$900
- − Repairs & maintenance
- −$1,755
- − Management
- −$1,755
- − Depreciation
- −$5,233
- Taxable income
- $184
- Est. tax owed @ 24.0%
- −$44
- After-tax cash flow
- $3,033/yr
For passive investors: Depreciation is non-cash, so a rental often shows a tax loss while cash-flowing — sheltering income. Rental losses are passive: they offset passive income freely, and up to $25,000/yr can offset ordinary (W-2) income if you actively participate and your MAGI is under $100k (phasing out to $0 by $150k); unused losses carry forward. On sale, claimed depreciation is recaptured at up to 25%, and gains may owe capital-gains tax (a 1031 exchange can defer both). Figures are a year-1 estimate at your 24.0% rate — not tax advice; consult a CPA.
Schools (NCES district)
- District
- School City Of Hammond
- NCES district ID
- 1804320
- Math proficiency
- 8% ▼ -18.00%
- Reading proficiency
- 18% ▼ -15.00%
- Median HH income
- $39,970
- Composite
- 11.11/100
- National rank
- #9730
- State rank
- #289 of 301 in IN
Livability — Hammond
- Score
- 70/100
- State rank
- #143
- US rank
- #7343
Category grades
Schools grade is shown separately in the Schools card above.
Census & demographics
- Census place
- Hammond, IN
- County
- Lake County · 422,878 people
- City population
- 58,809
- Metro
- Chicago-Naperville-Elgin, IL-IN-WI
- Population (ZIP)
- 21,409
- Household income
- $63,052
- Rent vs Own
- Severe rent burden
- 507.0
Population outlook (Lake County) Hauer SSP2
- Today (2025)
- 484,026 people
- By 2030
- 478,091 · -1.2%
- By 2040
- 462,974 · -4.3%
- By 2050
- 449,894 · -7.1%
- By 2075
- 436,169 · -9.9%
- By 2100
- 426,607 · -11.9%
Race, ethnicity, and origin ACS 2023
- Neighborhood character
- Diverse neighborhood (Simpson 0.69)
- Race & ethnicity
- Hispanic / Latino 39% White 34% Black 22% Two or more races 14% Asian 1% Native American 1%
- Hispanic origin (detail)
- Mexican 31% Puerto Rican 5%
- Common ancestry
- Romanian 5% Lithuanian 1% Italian 1%
- Foreign-born
- 10% · Canada
- Languages at home
- 79% English-only · Spanish 20%
Political lean MEDSL · Lake
- 2024 margin
- Lean D (+5.6) · D 52.1% · R 46.5% · Other 1.5%
- 2008→2024 swing
- -28.6pp toward R · 2008: 34.3pp · 2024: 5.6pp
- All cycles
- 2024: D+5.6 2020: D+15.1 2016: D+20.6 2012: D+31.0 2008: D+34.3
Not yet ingested
- Civics
- —
Market trends
- HPI YoY
- ▼ -37.65%
- Current HPI
- 352.8678
- Rent YoY
- ▲ 5.51%
- Metro
- Chicago-Naperville-Elgin, IL-IN-WI
- State GDP YoY
- ▲ 2.90%
- F500 in state
- 18
Industry mix (Fortune 500 HQ in IN)
| Industry | F500 HQs | Revenue |
|---|---|---|
| Industrial Machinery | 2 | $37B |
|
||
| Healthcare | 1 | $177B |
|
||
| Pharmaceuticals | 1 | $45B |
|
||
| Metals / Steel | 1 | $18B |
|
||
| Agriculture | 1 | $17B |
|
||
| Packaging | 1 | $12B |
|
||
Price history
2 events — show timeline
- 2026-05-12 Pending — NIRA MLS as Distributed by MLS Grid
- 2026-04-30 Listed $179,900 NIRA MLS as Distributed by MLS Grid
Property tax history
+3.6%/yrLatest (2024): $2,036 · -4.1% YoY. Source: county tax records.
Cash-flow waterfall
monthlySold comps — $/sqft
last 12 mo · ≤1 miLoading sold comps…