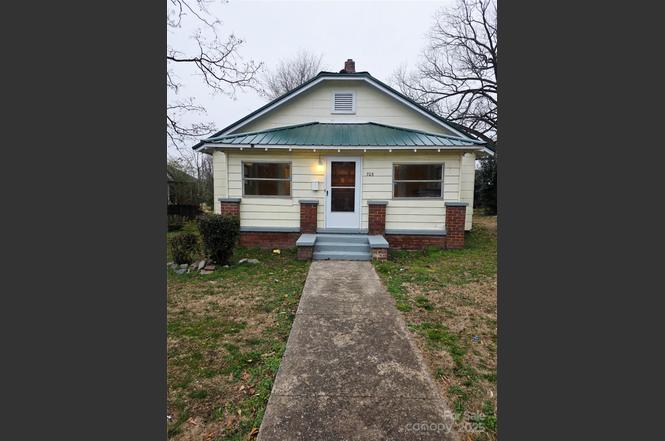
703 Buffalo St · Shelby, NC
Flood risk 1/10 · Minimal
- FEMA flood zone
- X (unshaded)
- Chance of flooding over 30 yrs
- 0.0%
- Est. flood insurance / yr
- $507 – $1,088
Fire risk 1/10 · Minimal
- Est. fire insurance / yr
- $906 – $1,684
Heat risk 6/10 · Moderate
- Hot days now (above 104°F)
- 7 days/yr
- Hot days in 30 yrs
- 18 days/yr
Wind risk 2/10 · Minimal
- Chance of severe wind over 30 yrs
- 4.0%
Air-quality risk 3/10 · Minor
- Unhealthy air days now
- 3 days/yr
- Unhealthy air days in 30 yrs
- 4 days/yr
Risk factors via First Street. Map © Google.
Why this score? — see what drove the B- grade
The composite is a weighted blend of 9 inputs, each scored 0–100. Each bar is that input's sub-score; the figure is the points it added to the 100-point composite (weight × sub-score).
- Cash flow +23.2/30.0
- ARV discount +15.0/15.0
- DSCR +7.5/10.0
- 1% rule +4.9/10.0
- Rent growth +4.2/5.0
- Schools +4.0/10.0
- Livability +3.8/5.0
- Condition / age +2.5/5.0
- Appreciation +0.5/10.0
$137,499
🖨 Deal sheet (PDF) 📄 Offer letter ✓ Due diligence
Listing remarks MLS
This is a 3 bedroom, 2 bath home. It is only heated by two gas heaters. Spacious rooms. Enclosed front porch. Living Room plus Dining room. There is a detached garage type/storage building.
Key facts
- New screen door
- Ceiling fans
- New kitchen windows
Tags
Property features AI
Finance
- HOA & community: No HOA dues
Exterior
- Parking: Shared driveway
- Utilities: City water; Public sewer
- Home design: Single family residence; Residential property; One story
- Construction: Site-built construction; Wood construction; Metal roof; Crawl space foundation
- Exterior features: Enclosed patio/porch; Road access is on dirt and paved surfaces; Publicly maintained road
Interior
- Kitchen: Exhaust hood
- Bedrooms: 3 bedrooms (all on the main level)
- Bathrooms: 2 full bathrooms (on the main level)
- Heating & cooling: Central heating; Central air; Ceiling fan(s)
- Interior features: Exhaust hood; 10 rooms
- Laundry & utility: Dedicated laundry room
Neighborhood map
What this means for you Summary
Snapshot
- This is a 3-bed/2.0-bath single-family listed at $137k.
Deal economics
- At list price, monthly cash flow is $249 ($3k/yr) — positive.
- The deal already cash-flows at list — no discount required.
- To meet the 1% rule (rent ≥ 1% of price), the offer needs to be $136k (1.3% below list).
- Recommended offer: $121k (12.0% below list) — sets the bar for market timing.
Location & tenants
- Location reads 75/100 on livability (#52 in NC, #4,349 nationally) — a middle-class / working-renter tenant base. Strengths: commute A+, cost of living A+, housing A+; Watch: crime F, employment F.
- Cleveland County Schools (rural): math 47% / reading 49% proficiency, ranked #76 of 178 in NC (top 43%) — families likely to look elsewhere, expect single-tenant / working-renter base with shorter leases.
- Zoned schools: Graham Elementary (math 17% / reading 27%); Shelby Middle (math 25% / reading 42%, grade F, #299 of 475 statewide, top 64%, 630 students, 81% FRL); Shelby High (math 17% / reading 52%, grade F, #427 of 535 statewide, top 81%, 825 students, 65% FRL).
- Zoned-school proficiency averages 30% at this address vs 48% district-wide (-18 pts) — the specific schools serving this property underperform the Cleveland County Schools average; the district grade overstates school quality for this exact location.
- Market conditions: Rents rising fast (+6.7%/yr); 247 active listings in the ZIP; 461 units permitted in Cleveland County in 2024 (38 in 5+ unit buildings).
Forward outlook
- Local home prices are declining (-3.0%/yr); year-one equity from $950 of loan paydown is wiped out by about $4k of value loss. Plan a longer hold.
- Cleveland County population projected at -15% by 2050 — secular population decline; favor cash flow + early exit over multi-decade hold.
- At projected returns (-3.0% appreciation + 6.7% rent growth), your $38k cash investment doubles in ~9 years — after that, you're playing with house money.
Negotiation context
- It's been on market 168 days — a 12% lower offer ($121k) is reasonable based on typical stale-listing flexibility.
- 3 sale attempts since 2y ago; this cycle's ask has dropped $32k (19%) from the opening price — seller is motivated, your offer sets the floor, not the list.
- Current owner paid $80k; list at $137k implies a 72% gain — meaningful room to come down on a strong offer.
Risks & watch-outs
- Watch-outs: built in 1940 — expect roof / HVAC / electrical / plumbing capex.
- Climate carrying-cost: extreme-heat days projected 7→18/yr by 2055 (HVAC capex compounding) — expect insurance premiums to compound above CPI over the hold.
Questions for the listing agent
- It's been on market 168 days. Have you received any prior offers? Is the seller open to a 12% concession, seller financing, or rate buy-down credit?
- Built in 1940 — when were the roof, HVAC, electrical panel, plumbing, and water heater last replaced?
- Why hasn't it sold? Are there any deal-killer items the seller is aware of (foundation, flood, title, zoning, code violations)?
- Is there a deadline driving the sale (1031 exchange, divorce, estate, relocation)? That informs how much negotiation room exists.
- Schools are D-rated, which usually means shorter tenancies and higher turnover. Who's the typical renter profile here, and what's been the actual vacancy rate?
- Crime grade is F in this area — have there been break-ins, vandalism, or insurance claims at this property in the last 3 years? What carrier currently insures it and at what premium?
- What's the average days-on-market for RENTAL listings here right now (not sales)? A rising rental-DOM trend means longer vacancies and softer asking-rent achievability than the comps imply.
- What's the recent tenant-quality profile in this submarket — average credit score on applications, eviction rate, late-payment / NSF rate, and stable-employment percentage? A property-management company in the area should have these aggregated.
- How much new for-sale + rental construction is in the pipeline within 1–3 miles? Heavy new supply typically softens prices + rents 12–24 months out; constrained supply supports both.
Investment metrics
- 1% rule
- 0.99% ✗
- Cap rate
- 8.46%
- Cash-on-cash
- 7.76%
- DSCR
- 1.35
- GRM
- 8.4
CMA / ARV
- ARV (on-the-fly)
- $213,696
- Comps found
- 12
Show comp detail 12 sales within ~0.75 mi
| Address | Dist | Beds/Ba | Sqft | Sold | Price | $/sf | Match |
|---|---|---|---|---|---|---|---|
| 406 Hudson St | 0.05mi | 3/2.5 | 1,335 (+5%) | 3mo | $215,000 | $161 | 85 |
| 424 Airline Ave | 0.13mi | 3/2.5 | 1,335 (+5%) | 1mo | $196,000 | $147 | 82 |
| 823 Frederick St | 0.20mi | 3/2.0 | 1,203 (-5%) | 2mo | $220,000 | $183 | 80 |
| 613 Buffalo St | 0.05mi | 3/2.5 | 1,335 (+5%) | 12mo | $248,000 | $186 | 78 |
| 712 N Washington St | 0.34mi | 3/2.0 | 1,363 (+7%) | 2mo | $229,000 | $168 | 70 |
| 318 E Sumter St | 0.44mi | 3/2.0 | 1,148 (-10%) | 4mo | $70,000 | $61 | 60 |
| 211 Chestnut St | 0.55mi | 3/2.5 | 1,335 (+5%) | 12mo | $245,000 | $184 | 54 |
| 951 Hardin Dr | 0.74mi | 3/2.0 | 1,225 (-4%) | 8mo | $265,000 | $216 | 53 |
| 746 Vale St | 0.60mi | 3/1.5 | 1,428 (+12%) | 1mo | $200,000 | $140 | 49 |
| 123 N Poston St | 0.63mi | 2/2.0 (-1) | 1,382 (+9%) | 11mo | $150,000 | $109 | 42 |
| 605 Oakley St | 0.48mi | 2/1.0 (-1) | 1,086 (-15%) | 3mo | $82,625 | $76 | 42 |
| 953 Hardin Dr | 0.74mi | 3/2.0 | 1,082 (-15%) | 2mo | $239,900 | $222 | 38 |
Match score weights: distance 35% · size 25% · config 20% · recency 20%. Top-matched comps best support the ARV.
Projected returns pro-forma
-3.0% appreciation · 6.66% rent growth · sell at horizon
- IRR
- -0.9%
- Equity multiple
- 0.97×
- Total profit
- $-1,307
- Equity at exit
- $20,502
- IRR
- 12.0%
- Equity multiple
- 2.09×
- Total profit
- $41,970
- Equity at exit
- $11,888
Cash invested: $38,500 (down + closing). Projections, not guarantees.
Landlord ↔ Tenant lean methodology
- Overall (STATE)
- 85 Strongly Landlord-Friendly
- State North Carolina
- 85 Strongly Landlord-Friendly · R+3
- County
- — inherits STATE
- City
- — inherits STATE
ZIP-level market 28150
- Home prices YoY
- -2.0%
- Rents YoY
- 6.7%
- Active inventory
- 247
- Price-to-rent
- 8.4×
Monthly cashflow live
- Estimated rent
- $1,358 medium interval (Pro) →
- Mortgage (P&I)
- −$721
- Tax from tax record
- −$45 /mo · $543/yr
- Insurance
- −$57
- HOA
- −$0
- Vacancy / Maint / Mgmt
- −$285
- Net cashflow
- $249
Break-even live
Sensitivity live
| Price | -10% $327 | -5% $288 | +0% $249 | +5% $210 | +10% $171 |
|---|---|---|---|---|---|
| Rent | -10% $142 | -5% $195 | +0% $249 | +5% $302 | +10% $356 |
| Rate | -1.0pp $318 | -0.5pp $284 | base $249 | +0.5pp $213 | +1.0pp $177 |
UW: 25.0% down · 7.5% · 30yr · 1.5% tax · 5.0% vac · 8.0% maint · 8.0% mgmt
Financing live
Cash to close
- Down payment
- $34,375
- Closing costs
- $4,125
- Reserves months
- —
- Total cash needed
- —
Loan-product check · same deal, 3 products live
Conventional
25% down · 7.5% · 30yr
- Down + closing
- —
- Monthly P&I
- —
- Monthly cashflow
- —
- DSCR
- —
- Eligible?
- —
Personal DTI + credit; lowest rate.
DSCR
20% down · 8.5% · 30yr
- Down + closing
- —
- Monthly P&I
- —
- Monthly cashflow
- —
- DSCR
- —
- Eligible?
- —
No personal income docs; deal must DSCR.
Hard money
10% down · 12.0% · 12mo
- Down + closing
- —
- Monthly P&I
- —
- Monthly cashflow
- —
- DSCR
- —
- Eligible?
- —
Short-term bridge; refi at stabilization.
Listing history 32 events
-
2026-06-22days on market $137,499 Active 168 DOM
-
2026-06-19days on market $137,499 Active 166 DOM
-
2026-06-18days on market $137,499 Active 165 DOM
-
2026-06-17days on market $137,499 Active 164 DOM
-
2026-06-16days on market $137,499 Active 163 DOM
-
2026-06-15days on market $137,499 Active 162 DOM
-
2026-06-14days on market $137,499 Active 160 DOM
-
2026-06-13days on market $137,499 Active 159 DOM
-
2026-06-10days on market $137,499 Active 157 DOM
-
2026-06-09days on market $137,499 Active 156 DOM
-
2026-06-08days on market $137,499 Active 155 DOM
-
2026-06-07days on market $137,499 Active 154 DOM
-
2026-06-05days on market $137,499 Active 151 DOM
-
2026-06-03days on market $137,499 Active 150 DOM
-
2026-06-02days on market $137,499 Active 149 DOM
-
2026-06-01days on market $137,499 Active 148 DOM
-
2026-05-31days on market $137,499 Active 147 DOM
-
2026-05-30days on market $137,499 Active 146 DOM
-
2026-05-10price $137,499
-
2026-04-08price $139,999
-
2026-04-07status Active
-
2026-04-04historical Active Under Contract
-
2026-04-01status Pending
-
2026-03-17price $149,999
-
2026-02-22price $154,999
-
2026-02-02price $159,999
-
2026-01-01$169,999 Active
-
2025-06-17soldstatus $80,000 Closed 194-char remark
Show marketing remark (194 chars)
This is a 3 bedroom, 2 bath home. It is only heated by two gas heaters. Spacious rooms. Enclosed front porch. Living Room plus Dining room. There is a detached garage type/storage building.
-
2025-06-17soldstatus $80,000
Show marketing remark (194 chars)
This is a 3 bedroom, 2 bath home. It is only heated by two gas heaters. Spacious rooms. Enclosed front porch. Living Room plus Dining room. There is a detached garage type/storage building.
-
2025-05-21historical Active Under Contract 194-char remark
Show marketing remark (194 chars)
This is a 3 bedroom, 2 bath home. It is only heated by two gas heaters. Spacious rooms. Enclosed front porch. Living Room plus Dining room. There is a detached garage type/storage building.
-
2025-05-08price $85,000 194-char remark
Show marketing remark (194 chars)
This is a 3 bedroom, 2 bath home. It is only heated by two gas heaters. Spacious rooms. Enclosed front porch. Living Room plus Dining room. There is a detached garage type/storage building.
-
2024-12-13$99,900 Active 194-char remark
Show marketing remark (194 chars)
This is a 3 bedroom, 2 bath home. It is only heated by two gas heaters. Spacious rooms. Enclosed front porch. Living Room plus Dining room. There is a detached garage type/storage building.
ⓘ Source: listings_history table (triggers on properties + properties_extension) + one-shot
backfill from property_details.listing_events for pre-trigger history.
Tax reassessment forecast NC · Resets to sale price
- Current annual tax
- $543 · $45/mo
- Projected year-2 tax
- $1,127 · $94/mo
- Expected delta
- +$584/yr (+$49/mo · 107.6%)
ⓘ Screening estimate from a state-policy table — verify with the county assessor before closing.
Climate risk First Street
- Flood 1/10 Low FEMA zone X (unshaded) · 0% chance over 30 yrs
- Wildfire 1/10 Low
- Heat 6/10 Major 7 d/yr ≥104°F today · 18 d/yr by 30 yrs out
- Wind 2/10 Low 4% chance of damaging wind over 30 yrs
- Air quality 3/10 Moderate 3 unhealthy d/yr today · 4 by 30 yrs out
Nearby sold comps map
Loading sold comps map…
Walkable amenities ~0.75 mi
Loading nearby amenities…
Taxation est. · year 1
- Rental income
- $16,290
- − Mortgage interest
- −$7,702
- − Property taxes
- −$543
- − Insurance
- −$687
- − Repairs & maintenance
- −$1,303
- − Management
- −$1,303
- − Depreciation
- −$4,000
- Taxable income
- $751
- Est. tax owed @ 24.0%
- −$180
- After-tax cash flow
- $2,806/yr
For passive investors: Depreciation is non-cash, so a rental often shows a tax loss while cash-flowing — sheltering income. Rental losses are passive: they offset passive income freely, and up to $25,000/yr can offset ordinary (W-2) income if you actively participate and your MAGI is under $100k (phasing out to $0 by $150k); unused losses carry forward. On sale, claimed depreciation is recaptured at up to 25%, and gains may owe capital-gains tax (a 1031 exchange can defer both). Figures are a year-1 estimate at your 24.0% rate — not tax advice; consult a CPA.
Schools (NCES district)
- District
- Cleveland County Schools
- NCES district ID
- 3700900
- Math proficiency
- 47% ▬ 0.00%
- Reading proficiency
- 49% ▲ 4.00%
- Median HH income
- $38,501
- Composite
- 40.03/100
- National rank
- #3823
- State rank
- #76 of 178 in NC
Livability — Shelby
- Score
- 75/100
- State rank
- #52
- US rank
- #4349
Category grades
Schools grade is shown separately in the Schools card above.
Census & demographics
- Census place
- Shelby, NC
- County
- Cleveland County · 83,736 people
- City population
- 26,134
- Metro
- Shelby, NC
- Population (ZIP)
- 28,142
- Household income
- $55,832
- Rent vs Own
- Severe rent burden
- 790.0
Population outlook (Cleveland County) Hauer SSP2
- Today (2025)
- 93,671 people
- By 2030
- 91,157 · -2.7%
- By 2040
- 85,519 · -8.7%
- By 2050
- 79,708 · -14.9%
- By 2075
- 68,317 · -27.1%
- By 2100
- 57,145 · -39.0%
Race, ethnicity, and origin ACS 2023
- Neighborhood character
- Majority White (62%)
- Race & ethnicity
- White 62% Black 27% Two or more races 5% Hispanic / Latino 5%
- Common ancestry
- Serbian 2% Italian 2% Lithuanian 1%
- Foreign-born
- 3% · Canada, Jamaica
- Languages at home
- 95% English-only · Spanish 4%
Political lean MEDSL · Cleveland
- 2024 margin
- Solid R (+35.0) · D 32.2% · R 67.2%
- 2008→2024 swing
- -15.1pp toward R · 2008: -19.9pp · 2024: -35.0pp
- All cycles
- 2024: R+35.0 2020: R+32.8 2016: R+30.6 2012: R+20.5 2008: R+19.9
Not yet ingested
- Civics
- —
Market trends
- HPI YoY
- ▼ -8.92%
- Current HPI
- 447.16
- Rent YoY
- ▲ 6.66%
- Metro
- Shelby, NC
- State GDP YoY
- ▲ 3.28%
- F500 in state
- 26
Industry mix (Fortune 500 HQ in NC)
| Industry | F500 HQs | Revenue |
|---|---|---|
| Financial Services | 2 | $213B |
|
||
| Retail | 2 | $95B |
|
||
| Industrial Conglomerate | 1 | $38B |
|
||
| Metals / Steel | 1 | $35B |
|
||
| Utilities | 1 | $30B |
|
||
| Industrial Machinery | 1 | $19B |
|
||
Price history
+37.6% since first listed14 events — show timeline
- 2026-05-10 Price Changed $137,499 CANOPYMLS as Distributed by MLS Grid
- 2026-04-08 Price Changed $139,999 CANOPYMLS as Distributed by MLS Grid
- 2026-04-07 Relisted — CANOPYMLS as Distributed by MLS Grid
- 2026-04-04 Contingent — CANOPYMLS as Distributed by MLS Grid
- 2026-04-01 Pending — CANOPYMLS as Distributed by MLS Grid
- 2026-03-17 Price Changed $149,999 CANOPYMLS as Distributed by MLS Grid
- 2026-02-22 Price Changed $154,999 CANOPYMLS as Distributed by MLS Grid
- 2026-02-02 Price Changed $159,999 CANOPYMLS as Distributed by MLS Grid
- 2026-01-01 Listed $169,999 CANOPYMLS as Distributed by MLS Grid
- 2025-06-17 Sold (Public Records) $80,000 Public Records
- 2025-06-17 Sold (MLS) $80,000 CANOPYMLS as Distributed by MLS Grid
- 2025-05-21 Contingent — CANOPYMLS as Distributed by MLS Grid
- 2025-05-08 Price Changed $85,000 CANOPYMLS as Distributed by MLS Grid
- 2024-12-13 Listed $99,900 CANOPYMLS as Distributed by MLS Grid
Property tax history
+5.4%/yrLatest (2025): $543 · +169.7% YoY. Source: county tax records.
Cash-flow waterfall
monthlySold comps — $/sqft
last 12 mo · ≤1 miLoading sold comps…