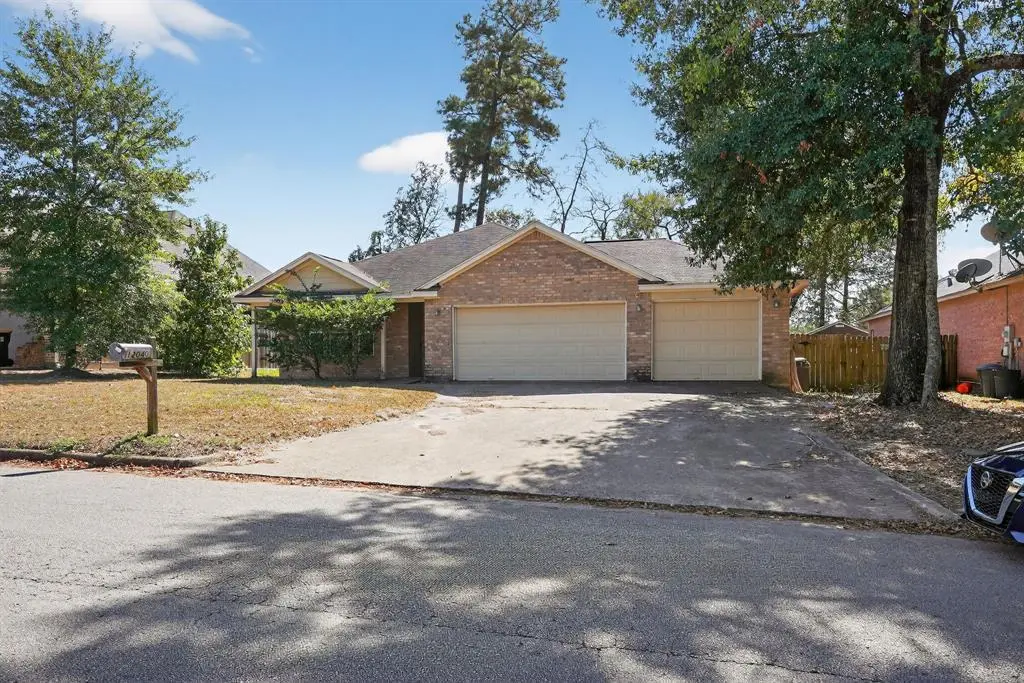
12040 Maverick Dr · Willis, TX
Flood risk 1/10 · Minimal
- FEMA flood zone
- X (unshaded)
- Chance of flooding over 30 yrs
- 0.0%
- Est. flood insurance / yr
- $507 – $1,088
Fire risk 5/10 · Moderate
- Est. fire insurance / yr
- $1,222 – $2,270
Heat risk 8/10 · Major
- Hot days now (above 111°F)
- 7 days/yr
- Hot days in 30 yrs
- 24 days/yr
Wind risk 8/10 · Major
- Chance of severe wind over 30 yrs
- 99.0%
Air-quality risk 2/10 · Minimal
- Unhealthy air days now
- 1 days/yr
- Unhealthy air days in 30 yrs
- 1 days/yr
Risk factors via First Street. Map © Google.
Why this score? — see what drove the D grade
The composite is a weighted blend of 9 inputs, each scored 0–100. Each bar is that input's sub-score; the figure is the points it added to the 100-point composite (weight × sub-score).
- ARV discount +15.0/15.0
- Cash flow +7.5/30.0
- 1% rule +4.3/10.0
- Schools +3.2/10.0
- Livability +3.1/5.0
- Rent growth +2.7/5.0
- Condition / age +2.5/5.0
- DSCR +1.7/10.0
- Appreciation +0.9/10.0
$200,000
🖨 Deal sheet (PDF) 📄 Offer letter ✓ Due diligence
Listing remarks MLS
Calling all investors. Welcome to thi well priced 3 bedroom home that will need TLC. This home features brick and siding construction. Step inside to find a welcoming open floor plan that flow seamlessly into a generous living area, perfectly designed for entertaining and everyday living. The open kitchen overlooks the living room, creating a warm and connected space for family and friends. The primary suite offers a relaxing retreat with an ensuite bath that includes dual sinks, a jetted tub, a separate shower, and a large walk-in closet. This property provides the perfect blend of privacy and space—while still being only minutes from top-rated schools, shops, restaurants, and entertainment.
Key facts
- Open floor plan
- Generous living area
- Primary suite
Tags
Neighborhood map
What this means for you Summary
Snapshot
- This is a 3-bed/2.0-bath single-family listed at $200k.
Deal economics
- At list price, monthly cash flow is $-245 ($-3k/yr) — negative.
- To cash-flow at today's rent, offer at most $157k (21.7% below list).
- To meet the 1% rule (rent ≥ 1% of price), the offer needs to be $185k (7.5% below list).
- Recommended offer: $157k (21.7% below list) — sets the bar for cash-flow.
Location & tenants
- Location reads 62/100 on livability (#933 in TX) — a middle-class / working-renter tenant base. Strengths: cost of living A+, housing A+; Watch: crime C-, employment D+, amenities F.
- Willis ISD (rural): math 33% / reading 40% proficiency, ranked #458 of 826 in TX (top 55%) — families likely to look elsewhere, expect single-tenant / working-renter base with shorter leases.
- Zoned schools: Edward B Cannan El (math 34% / reading 32%, grade F, #2,208 of 4,322 statewide, top 52%, 672 students, 74% FRL); Robert P Brabham Middle (math 33% / reading 41%, grade F, #756 of 1,662 statewide, top 47%, 1,117 students, 52% FRL); Willis H S (math 19% / reading 46%, grade F, #1,029 of 1,632 statewide, top 64%, 2,521 students, 57% FRL).
- Market conditions: Rents flat; 721 active listings in the ZIP; 13,259 units permitted in Montgomery County in 2024 (1,402 in 5+ unit buildings).
- This rent runs 31% of the median local income ($71k/yr) — at the standard rent-burdened threshold; future hikes will face affordability resistance.
Forward outlook
- Local home prices are declining (-3.0%/yr); year-one equity from $1k of loan paydown is wiped out by about $6k of value loss. Plan a longer hold.
- Montgomery County population projected at +65% by 2050 — long-run rental-demand tailwind backs the buy-and-hold thesis.
Negotiation context
- It's been on market 171 days — a 12% lower offer ($176k) is reasonable based on typical stale-listing flexibility.
- 3 sale attempts; this cycle's ask has dropped $15k (7%) from the opening price — seller is motivated, your offer sets the floor, not the list.
Risks & watch-outs
- Watch-outs: property tax is 3.4% of price.
- Climate carrying-cost: severe wind risk, 99% chance of damaging wind over 30y; moderate wildfire risk; extreme-heat days projected 7→24/yr by 2055 (HVAC capex compounding) — expect insurance premiums to compound above CPI over the hold.
Questions for the listing agent
- What do current leases actually rent for vs. the listed asking? Can we see a recent rent roll and the last 12 months of T-12 income?
- It's been on market 171 days. Have you received any prior offers? Is the seller open to a 22% concession, seller financing, or rate buy-down credit?
- Property tax is high relative to price — has the assessment been appealed recently, and will the sale trigger a re-assessment?
- What does the HOA fee cover, when was the last increase, and are there any pending special assessments or reserve-fund shortfalls?
- Why hasn't it sold? Are there any deal-killer items the seller is aware of (foundation, flood, title, zoning, code violations)?
- Is there a deadline driving the sale (1031 exchange, divorce, estate, relocation)? That informs how much negotiation room exists.
- Schools are D-rated, which usually means shorter tenancies and higher turnover. Who's the typical renter profile here, and what's been the actual vacancy rate?
- The area grade is low — what's the realistic commute time and amenity access for the typical tenant pool here? Any planned neighborhood developments (good or bad) we should know about?
- What's the average days-on-market for RENTAL listings here right now (not sales)? A rising rental-DOM trend means longer vacancies and softer asking-rent achievability than the comps imply.
- What's the recent tenant-quality profile in this submarket — average credit score on applications, eviction rate, late-payment / NSF rate, and stable-employment percentage? A property-management company in the area should have these aggregated.
- How much new for-sale + rental construction is in the pipeline within 1–3 miles? Heavy new supply typically softens prices + rents 12–24 months out; constrained supply supports both.
Investment metrics
- 1% rule
- 0.93% ✗
- Cap rate
- 4.82%
- Cash-on-cash
- -5.25%
- DSCR
- 0.77
- GRM
- 9.0
CMA / ARV
- ARV (median comp)
- $262,060
- List price
- $200,000
- Delta
- -23.68%
- Verdict
- UNDERPRICED
- Comps
- 20 within 1.0 mi
Show comp detail 12 sales within ~0.75 mi
| Address | Dist | Beds/Ba | Sqft | Sold | Price | $/sf | Match |
|---|---|---|---|---|---|---|---|
| 12148 Brazos Dr | 0.47mi | 3/2.0 | 1,676 (+0%) | 1mo | $241,000 | $144 | 77 |
| 12098 Mustang Ave | 0.43mi | 3/2.0 | 1,621 (-3%) | 1mo | $260,000 | $160 | 74 |
| 12089 Maverick Dr | 0.12mi | 2/2.0 (-1) | 1,562 (-7%) | 13mo | $225,000 | $144 | 67 |
| 12121 Maverick Dr | 0.18mi | 2/2.0 (-1) | 1,544 (-8%) | 9mo | $225,900 | $146 | 66 |
| 12011 Maverick Dr | 0.10mi | 4/2.0 (+1) | 1,922 (+15%) | 1mo | $239,900 | $125 | 65 |
| 12132 Brazos Dr | 0.45mi | 4/2.0 (+1) | 1,635 (-2%) | 7mo | $275,000 | $168 | 64 |
| 12135 Mustang Ave | 0.54mi | 3/2.0 | 1,605 (-4%) | 9mo | $257,990 | $161 | 61 |
| 9024 Zapata Way | 0.36mi | 3/2.0 | 1,857 (+11%) | 9mo | $244,900 | $132 | 57 |
| 12315 FM 2432 Rd | 0.26mi | 3/2.0 | 1,456 (-13%) | 13mo | $215,000 | $148 | 55 |
| 12178 Mustang Ave | 0.70mi | 3/2.5 | 1,738 (+4%) | 13mo | $285,000 | $164 | 48 |
| 12175 Mustang Ave | 0.68mi | 3/2.0 | 1,885 (+12%) | 1mo | $325,000 | $172 | 47 |
| 12398 Bagwell Rd | 0.72mi | 2/2.5 (-1) | 1,536 (-8%) | 13mo | $475,000 | $309 | 35 |
Match score weights: distance 35% · size 25% · config 20% · recency 20%. Top-matched comps best support the ARV.
Projected returns pro-forma
-3.0% appreciation · 0.98% rent growth · sell at horizon
- IRR
- -28.0%
- Equity multiple
- 0.08×
- Total profit
- $-51,480
- Equity at exit
- $29,821
- IRR
- -39.6%
- Equity multiple
- -0.40×
- Total profit
- $-78,534
- Equity at exit
- $17,292
Cash invested: $56,000 (down + closing). Projections, not guarantees.
Landlord ↔ Tenant lean methodology
- Overall (STATE)
- 87 Strongly Landlord-Friendly
- State Texas
- 87 Strongly Landlord-Friendly · R+5
- County
- — inherits STATE
- City
- — inherits STATE
ZIP-level market 77378
- Home prices YoY
- -3.0%
- Rents YoY
- 1.0%
- Active inventory
- 721
- Price-to-rent
- 9.0×
Monthly cashflow live
- Estimated rent
- $1,851 medium interval (Pro) →
- Mortgage (P&I)
- −$1,049
- Tax from tax record
- −$560 /mo · $6,719/yr
- Insurance
- −$83
- HOA
- −$15
- Vacancy / Maint / Mgmt
- −$389
- Net cashflow
- $-245
Break-even live
Sensitivity live
| Price | -10% $-132 | -5% $-189 | +0% $-245 | +5% $-302 | +10% $-358 |
|---|---|---|---|---|---|
| Rent | -10% $-391 | -5% $-318 | +0% $-245 | +5% $-172 | +10% $-99 |
| Rate | -1.0pp $-144 | -0.5pp $-194 | base $-245 | +0.5pp $-297 | +1.0pp $-350 |
UW: 25.0% down · 7.5% · 30yr · 1.5% tax · 5.0% vac · 8.0% maint · 8.0% mgmt
Financing live
Cash to close
- Down payment
- $50,000
- Closing costs
- $6,000
- Reserves months
- —
- Total cash needed
- —
Loan-product check · same deal, 3 products live
Conventional
25% down · 7.5% · 30yr
- Down + closing
- —
- Monthly P&I
- —
- Monthly cashflow
- —
- DSCR
- —
- Eligible?
- —
Personal DTI + credit; lowest rate.
DSCR
20% down · 8.5% · 30yr
- Down + closing
- —
- Monthly P&I
- —
- Monthly cashflow
- —
- DSCR
- —
- Eligible?
- —
No personal income docs; deal must DSCR.
Hard money
10% down · 12.0% · 12mo
- Down + closing
- —
- Monthly P&I
- —
- Monthly cashflow
- —
- DSCR
- —
- Eligible?
- —
Short-term bridge; refi at stabilization.
HOA detail
- Monthly dues
- $15 · $180/yr
Listing history 23 events
-
2026-06-21statusdays on market $200,000 Pending 171 DOM
-
2026-06-18days on market $200,000 Active Option Contract 169 DOM
-
2026-06-17days on market $200,000 Active Option Contract 168 DOM
-
2026-06-16days on market $200,000 Active Option Contract 167 DOM
-
2026-06-15status $200,000 Active Option Contract 166 DOM
-
2026-06-15days on market $200,000 Active 166 DOM
-
2026-06-13days on market $200,000 Active 164 DOM
-
2026-06-09days on market $200,000 Active 160 DOM
-
2026-06-08days on market $200,000 Active 159 DOM
-
2026-06-07days on market $200,000 Active 158 DOM
-
2026-06-04days on market $200,000 Active 155 DOM
-
2026-06-03days on market $200,000 Active 154 DOM
-
2026-06-02days on market $200,000 Active 153 DOM
-
2026-06-01days on market $200,000 Active 152 DOM
-
2026-05-31days on market $200,000 Active 151 DOM
-
2026-05-08price $205,000 707-char remark
Show marketing remark (707 chars)
Calling all investors. Welcome to thi well priced 3 bedroom home that will need TLC. This home features brick and siding construction. Step inside to find a welcoming open floor plan that flow seamlessly into a generous living area, perfectly designed for entertaining and everyday living. The open kitchen overlooks the living room, creating a warm and connected space for family and friends. The primary suite offers a relaxing retreat with an ensuite bath that includes dual sinks, a jetted tub, a separate shower, and a large walk-in closet. This property provides the perfect blend of privacy and space—while still being only minutes from top-rated schools, shops, restaurants, and entertainment.
-
2025-12-31$215,000 Active 707-char remark
Show marketing remark (707 chars)
Calling all investors. Welcome to thi well priced 3 bedroom home that will need TLC. This home features brick and siding construction. Step inside to find a welcoming open floor plan that flow seamlessly into a generous living area, perfectly designed for entertaining and everyday living. The open kitchen overlooks the living room, creating a warm and connected space for family and friends. The primary suite offers a relaxing retreat with an ensuite bath that includes dual sinks, a jetted tub, a separate shower, and a large walk-in closet. This property provides the perfect blend of privacy and space—while still being only minutes from top-rated schools, shops, restaurants, and entertainment.
-
2025-12-08historical
-
2025-11-05price $240,000
-
2025-10-24$250,000 Active
-
2025-06-13historical
-
2025-04-10$257,990 Active
-
2006-06-26soldstatus
ⓘ Source: listings_history table (triggers on properties + properties_extension) + one-shot
backfill from property_details.listing_events for pre-trigger history.
Tax reassessment forecast TX · Resets to sale price
- Current annual tax
- $6,719 · $560/mo
- Projected year-2 tax
- $6,719 · $560/mo
- Expected delta
- $0/yr ($0/mo · 0.0%)
ⓘ Screening estimate from a state-policy table — verify with the county assessor before closing.
Climate risk First Street
- Flood 1/10 Low FEMA zone X (unshaded) · 0% chance over 30 yrs
- Wildfire 5/10 Major
- Heat 8/10 Severe 7 d/yr ≥111°F today · 24 d/yr by 30 yrs out
- Wind 8/10 Severe 99% chance of damaging wind over 30 yrs
- Air quality 2/10 Low 1 unhealthy d/yr today · 1 by 30 yrs out
Nearby sold comps map
Loading sold comps map…
Walkable amenities ~0.75 mi
Loading nearby amenities…
Taxation est. · year 1
- Rental income
- $22,207
- − Mortgage interest
- −$11,203
- − Property taxes
- −$6,719
- − Insurance
- −$1,000
- − Repairs & maintenance
- −$1,777
- − Management
- −$1,777
- − HOA
- −$180
- − Depreciation
- −$5,818
- Taxable loss
- −$6,267
- Est. tax savings @ 24.0%
- +$1,504
- After-tax cash flow
- $-1,437/yr
For passive investors: Depreciation is non-cash, so a rental often shows a tax loss while cash-flowing — sheltering income. Rental losses are passive: they offset passive income freely, and up to $25,000/yr can offset ordinary (W-2) income if you actively participate and your MAGI is under $100k (phasing out to $0 by $150k); unused losses carry forward. On sale, claimed depreciation is recaptured at up to 25%, and gains may owe capital-gains tax (a 1031 exchange can defer both). Figures are a year-1 estimate at your 24.0% rate — not tax advice; consult a CPA.
Schools (NCES district)
- District
- Willis ISD
- NCES district ID
- 4845900
- Math proficiency
- 33% ▼ -15.00%
- Reading proficiency
- 40% ▼ -2.00%
- Median HH income
- $57,828
- Composite
- 32.32/100
- National rank
- #5746
- State rank
- #458 of 826 in TX
Livability — Willis
- Score
- 62/100
- State rank
- #933
- US rank
- #16579
Category grades
Schools grade is shown separately in the Schools card above.
Census & demographics
- County
- Montgomery County · 663,713 people
- City population
- 38,421
- Metro
- Houston-The Woodlands-Sugar Land, TX
- Population (ZIP)
- 17,629
- Household income
- $71,143
- Rent vs Own
- Severe rent burden
- 402.0
Population outlook (Montgomery County) Hauer SSP2
- Today (2025)
- 713,896 people
- By 2030
- 805,263 · +12.8%
- By 2040
- 992,708 · +39.1%
- By 2050
- 1,179,590 · +65.2%
- By 2075
- 1,628,084 · +128.1%
- By 2100
- 1,937,880 · +171.5%
Race, ethnicity, and origin ACS 2023
- Neighborhood character
- Diverse neighborhood (Simpson 0.55)
- Race & ethnicity
- White 58% Hispanic / Latino 32% Two or more races 14% Black 7% Native American 1%
- Hispanic origin (detail)
- Mexican 27%
- Common ancestry
- Romanian 2% Slovak 2% Serbian 1%
- Foreign-born
- 12% · Canada
- Languages at home
- 80% English-only · Spanish 19%
Political lean MEDSL · Montgomery
- 2024 margin
- Solid R (+45.5) · D 26.8% · R 72.3%
- 2008→2024 swing
- +7.2pp toward D · 2008: -52.7pp · 2024: -45.5pp
- All cycles
- 2024: R+45.5 2020: R+43.8 2016: R+51.4 2012: R+60.7 2008: R+52.7
Not yet ingested
- Civics
- —
Market trends
- HPI YoY
- ▼ -8.25%
- Current HPI
- 261.9673
- Rent YoY
- ▲ 0.98%
- Metro
- Houston-The Woodlands-Sugar Land, TX
- State GDP YoY
- ▲ 3.95%
- F500 in state
- 110
Industry mix (Fortune 500 HQ in TX)
| Industry | F500 HQs | Revenue |
|---|---|---|
| Energy | 16 | $1,198B |
|
||
| Technology | 5 | $198B |
|
||
| Engineering / Construction | 4 | $72B |
|
||
| Energy Services | 3 | $60B |
|
||
| Utilities | 3 | $41B |
|
||
| Healthcare | 2 | $330B |
|
||
Price history
-20.5% since first listed8 events — show timeline
- 2026-05-08 Price Changed $205,000 NTREIS
- 2025-12-31 Listed $215,000 NTREIS
- 2025-12-08 Listing Removed — NTREIS
- 2025-11-05 Price Changed $240,000 NTREIS
- 2025-10-24 Listed $250,000 NTREIS
- 2025-06-13 Listing Removed — HARMLS
- 2025-04-10 Listed $257,990 HARMLS
- 2006-06-26 Sold (Public Records) — Public Records
Property tax history
+2.8%/yrLatest (2025): $6,719 · +1.1% YoY. Source: county tax records.
Cash-flow waterfall
monthlySold comps — $/sqft
last 12 mo · ≤1 miLoading sold comps…