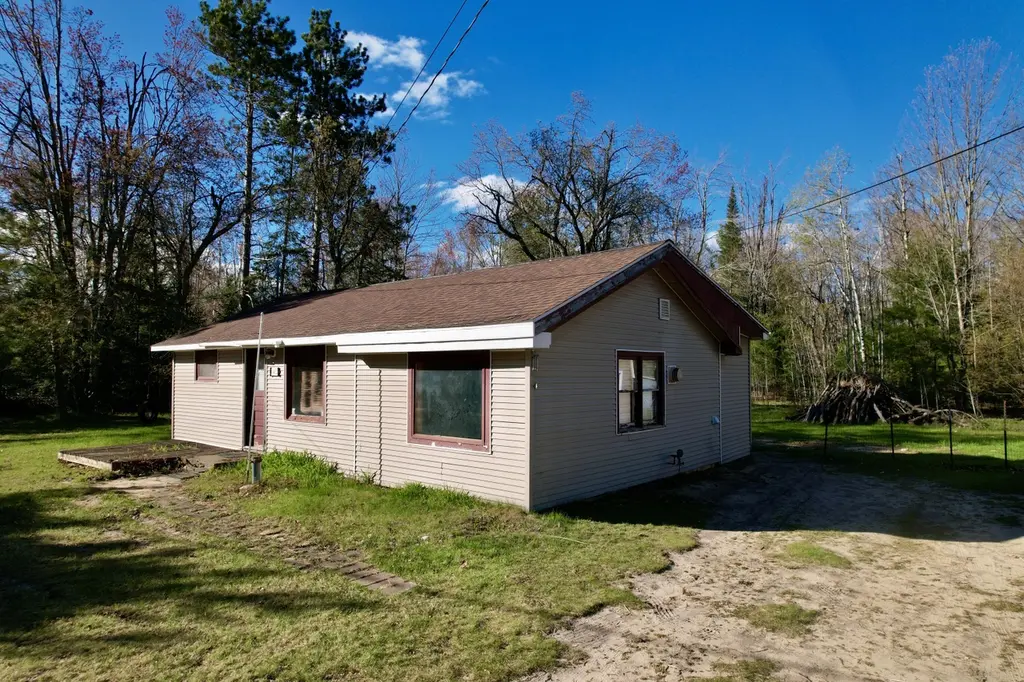
1412 Charles Brink Rd · Bagley, MI
Flood risk 1/10 · Minimal
- FEMA flood zone
- —
- Chance of flooding over 30 yrs
- 0.0%
- Est. flood insurance / yr
- —
Fire risk 4/10 · Minor
- Est. fire insurance / yr
- $784 – $1,456
Heat risk 1/10 · Minimal
- Hot days now (above 93°F)
- 7 days/yr
- Hot days in 30 yrs
- 13 days/yr
Wind risk 1/10 · Minimal
- Chance of severe wind over 30 yrs
- —
Air-quality risk 1/10 · Minimal
- Unhealthy air days now
- 0 days/yr
- Unhealthy air days in 30 yrs
- 0 days/yr
Risk factors via First Street. Map © Google.
Why this score? — see what drove the C- grade
The composite is a weighted blend of 9 inputs, each scored 0–100. Each bar is that input's sub-score; the figure is the points it added to the 100-point composite (weight × sub-score).
- Cash flow +17.9/30.0
- ARV discount +15.0/15.0
- DSCR +5.6/10.0
- Schools +4.1/10.0
- 1% rule +4.0/10.0
- Rent growth +2.5/5.0
- Livability +2.5/5.0
- Condition / age +2.5/5.0
- Appreciation +0.0/10.0
$129,900
🖨 Deal sheet (PDF) 📄 Offer letter ✓ Due diligence
Listing remarks
This charming 2-bedroom, 1-bath home is a fantastic opportunity for first-time buyers or savvy investors. With solid bones and loads of potential, it's perfect for sweat equity and value-building updates. Major systems updated in the last 8 years include a roof, septic, furnace, insulation, plus a spacious 12x24 shed. Additional features: washer/dryer hookups, 1/2 new flooring (remaining flooring included in shed), second working furnace, and owned propane tank. Enjoy easy access to trails, golf courses, and year-round recreation.
Key facts
- Spacious shed
- Owned propane tank
- Washer dryer hookups
Tags
Property features AI
Exterior
- Parking: RV access/parking
- Utilities: Well water; Septic tank; Propane utility
- Home design: Single family residence; Residential property
- Construction: Crawl space / no basement
- Exterior features: Paved road access; Lot approximately 0.55 acre
Interior
- Kitchen: Refrigerator; Oven; Range
- Flooring: Simulated wood
- Bathrooms: 1 full bathroom
- Heating & cooling: Propane heating; Wall furnace
- Interior features: Blinds on windows; Simulated wood flooring
- Laundry & utility: Laundry on the main level
Neighborhood map
What this means for you Summary
Snapshot
- This is a 2-bed/1.0-bath single-family listed at $130k.
Deal economics
- At list price, monthly cash flow is $110 ($1k/yr) — positive.
- The deal already cash-flows at list — no discount required.
- To meet the 1% rule (rent ≥ 1% of price), the offer needs to be $116k (10.4% below list).
- Recommended offer: $116k (10.4% below list) — sets the bar for 1% rule.
Location & tenants
- Location reads: area grade C — affects rentability + tenant quality, not the cash-flow math above.
- Gaylord Community Schools (rural): math 43% / reading 53% proficiency, ranked #123 of 540 in MI (top 23%) — families likely to look elsewhere, expect single-tenant / working-renter base with shorter leases.
- Zoned schools: Gaylord High Schoolvoc Bldg (math 47% / reading 67%, grade C, #99 of 713 statewide, top 14%, 961 students, 43% FRL) — zoned schools at 43% FRL track the district average.
- Market conditions: 209 active listings in the ZIP; 24 units permitted in Otsego County in 2024 (0 in 5+ unit buildings).
Forward outlook
- Local home prices are declining (-3.0%/yr); year-one equity from $898 of loan paydown is wiped out by about $4k of value loss. Plan a longer hold.
- Otsego County population projected at -11% by 2050 — secular population decline; favor cash flow + early exit over multi-decade hold.
Negotiation context
- It's been on market 38 days — a 3% lower offer ($126k) is reasonable based on typical stale-listing flexibility.
Questions for the listing agent
- It's been on market 38 days. Have you received any prior offers? Is the seller open to a 10% concession, seller financing, or rate buy-down credit?
- Is there a deadline driving the sale (1031 exchange, divorce, estate, relocation)? That informs how much negotiation room exists.
- What's the average days-on-market for RENTAL listings here right now (not sales)? A rising rental-DOM trend means longer vacancies and softer asking-rent achievability than the comps imply.
- What's the recent tenant-quality profile in this submarket — average credit score on applications, eviction rate, late-payment / NSF rate, and stable-employment percentage? A property-management company in the area should have these aggregated.
- How much new for-sale + rental construction is in the pipeline within 1–3 miles? Heavy new supply typically softens prices + rents 12–24 months out; constrained supply supports both.
Investment metrics
- 1% rule
- 0.90% ✗
- Cap rate
- 7.31%
- Cash-on-cash
- 3.64%
- DSCR
- 1.16
- GRM
- 9.3
CMA / ARV
- ARV (median comp)
- $169,863
- List price
- $129,900
- Delta
- -23.53%
- Verdict
- UNDERPRICED
- Comps
- 14 within 1.0 mi
Show comp detail 4 sales within ~0.75 mi
| Address | Dist | Beds/Ba | Sqft | Sold | Price | $/sf | Match |
|---|---|---|---|---|---|---|---|
| 793 Skiview Trl | 0.63mi | 2/1.0 | 889 (-5%) | 6mo | $150,000 | $169 | 57 |
| 5128 Krys Rd | 0.52mi | 2/2.0 | 1,020 (+9%) | 11mo | $165,000 | $162 | 48 |
| 6094 Northstar Rd | 0.57mi | 2/2.0 | 836 (-11%) | 10mo | $171,000 | $205 | 43 |
| 957 Charles Brink Rd | 0.56mi | 2/2.0 | 1,011 (+8%) | 22mo | $155,000 | $153 | 38 |
Match score weights: distance 35% · size 25% · config 20% · recency 20%. Top-matched comps best support the ARV.
Projected returns pro-forma
-3.0% appreciation · 3.0% rent growth · sell at horizon
- IRR
- -10.6%
- Equity multiple
- 0.61×
- Total profit
- $-14,065
- Equity at exit
- $19,369
- IRR
- -1.3%
- Equity multiple
- 0.91×
- Total profit
- $-3,356
- Equity at exit
- $11,231
Cash invested: $36,372 (down + closing). Projections, not guarantees.
Landlord ↔ Tenant lean methodology
- Overall (STATE)
- 62 Landlord-Friendly
- State Michigan
- 62 Landlord-Friendly · EVEN
- County
- — inherits STATE
- City
- — inherits STATE
ZIP-level market 49735
- Home prices YoY
- -27.8%
- Active inventory
- 209
- Price-to-rent
- 9.3×
Monthly cashflow live
- Estimated rent
- $1,164 medium interval (Pro) →
- Mortgage (P&I)
- −$681
- Tax from tax record
- −$74 /mo · $891/yr
- Insurance
- −$54
- HOA
- −$0
- Vacancy / Maint / Mgmt
- −$245
- Net cashflow
- $110
Break-even live
Sensitivity live
| Price | -10% $184 | -5% $147 | +0% $110 | +5% $73 | +10% $37 |
|---|---|---|---|---|---|
| Rent | -10% $18 | -5% $64 | +0% $110 | +5% $156 | +10% $202 |
| Rate | -1.0pp $176 | -0.5pp $143 | base $110 | +0.5pp $77 | +1.0pp $42 |
UW: 25.0% down · 7.5% · 30yr · 1.5% tax · 5.0% vac · 8.0% maint · 8.0% mgmt
Financing live
Cash to close
- Down payment
- $32,475
- Closing costs
- $3,897
- Reserves months
- —
- Total cash needed
- —
Loan-product check · same deal, 3 products live
Conventional
25% down · 7.5% · 30yr
- Down + closing
- —
- Monthly P&I
- —
- Monthly cashflow
- —
- DSCR
- —
- Eligible?
- —
Personal DTI + credit; lowest rate.
DSCR
20% down · 8.5% · 30yr
- Down + closing
- —
- Monthly P&I
- —
- Monthly cashflow
- —
- DSCR
- —
- Eligible?
- —
No personal income docs; deal must DSCR.
Hard money
10% down · 12.0% · 12mo
- Down + closing
- —
- Monthly P&I
- —
- Monthly cashflow
- —
- DSCR
- —
- Eligible?
- —
Short-term bridge; refi at stabilization.
Listing history 18 events
-
2026-06-21days on market $129,900 Active 38 DOM
-
2026-06-21days on market $129,900 Active 37 DOM
-
2026-06-18days on market $129,900 Active 35 DOM
-
2026-06-17days on market $129,900 Active 34 DOM
-
2026-06-16days on market $129,900 Active 33 DOM
-
2026-06-15days on market $129,900 Active 32 DOM
-
2026-06-13days on market $129,900 Active 30 DOM
-
2026-06-12days on market $129,900 Active 29 DOM
-
2026-06-09days on market $129,900 Active 26 DOM
-
2026-06-08days on market $129,900 Active 25 DOM
-
2026-06-07days on market $129,900 Active 24 DOM
-
2026-06-07days on market $129,900 Active 23 DOM
-
2026-06-04days on market $129,900 Active 20 DOM
-
2026-06-02days on market $129,900 Active 19 DOM
-
2026-06-01days on market $129,900 Active 18 DOM
-
2026-05-31days on market $129,900 Active 17 DOM
-
2026-05-31days on market $129,900 Active 16 DOM
-
2026-05-13$129,900 Active 536-char remark
ⓘ Source: listings_history table (triggers on properties + properties_extension) + one-shot
backfill from property_details.listing_events for pre-trigger history.
Tax reassessment forecast MI · Partial reset (capped growth)
- Current annual tax
- $891 · $74/mo
- Projected year-2 tax
- $1,446 · $120/mo
- Expected delta
- +$555/yr (+$46/mo · 62.3%)
ⓘ Screening estimate from a state-policy table — verify with the county assessor before closing.
Climate risk First Street
- Flood 1/10 Low 0% chance over 30 yrs
- Wildfire 4/10 Moderate
- Heat 1/10 Low 7 d/yr ≥93°F today · 13 d/yr by 30 yrs out
- Wind 1/10 Low
- Air quality 1/10 Low 0 unhealthy d/yr today · 0 by 30 yrs out
Nearby sold comps map
Loading sold comps map…
Walkable amenities ~0.75 mi
Loading nearby amenities…
Taxation est. · year 1
- Rental income
- $13,971
- − Mortgage interest
- −$7,276
- − Property taxes
- −$891
- − Insurance
- −$650
- − Repairs & maintenance
- −$1,118
- − Management
- −$1,118
- − Depreciation
- −$3,779
- Taxable loss
- −$859
- Est. tax savings @ 24.0%
- +$206
- After-tax cash flow
- $1,529/yr
For passive investors: Depreciation is non-cash, so a rental often shows a tax loss while cash-flowing — sheltering income. Rental losses are passive: they offset passive income freely, and up to $25,000/yr can offset ordinary (W-2) income if you actively participate and your MAGI is under $100k (phasing out to $0 by $150k); unused losses carry forward. On sale, claimed depreciation is recaptured at up to 25%, and gains may owe capital-gains tax (a 1031 exchange can defer both). Figures are a year-1 estimate at your 24.0% rate — not tax advice; consult a CPA.
Schools (NCES district)
- District
- Gaylord Community Schools
- NCES district ID
- 2615730
- Math proficiency
- 43% ▼ -5.00%
- Reading proficiency
- 53% ▼ -5.00%
- Median HH income
- $48,682
- Composite
- 40.97/100
- National rank
- #3597
- State rank
- #123 of 540 in MI
Livability — Bagley
No livability data for this city. (Only ~50 U.S. cities are tracked.)
Census & demographics
- Population (ZIP)
- 20,678
Population outlook (Otsego County) Hauer SSP2
- Today (2025)
- 24,175 people
- By 2030
- 23,836 · -1.4%
- By 2040
- 22,718 · -6.0%
- By 2050
- 21,411 · -11.4%
- By 2075
- 18,864 · -22.0%
- By 2100
- 15,011 · -37.9%
Race, ethnicity, and origin ACS 2023
- Neighborhood character
- Predominantly White (93%)
- Race & ethnicity
- White 93% Two or more races 4% Hispanic / Latino 2%
- Common ancestry
- Romanian 12% Lithuanian 6% Slovak 2%
- Foreign-born
- 1% · Canada
- Languages at home
- 97% English-only · Other Indo-European 1% German/W. Germanic 1%
Political lean MEDSL · Otsego
- 2024 margin
- Solid R (+35.3) · D 31.6% · R 67.0% · Other 1.4%
- 2008→2024 swing
- -26.5pp toward R · 2008: -8.9pp · 2024: -35.3pp
- All cycles
- 2024: R+35.3 2020: R+34.1 2016: R+37.6 2012: R+19.7 2008: R+8.9
Not yet ingested
- Civics
- —
Market trends
- HPI YoY
- ▼ -94.52%
- Current HPI
- 245.8639
- Rent YoY
- —
- Metro
- —
- State GDP YoY
- ▲ 1.37%
- F500 in state
- 28
Industry mix (Fortune 500 HQ in MI)
| Industry | F500 HQs | Revenue |
|---|---|---|
| Automotive Parts | 3 | $48B |
|
||
| Automotive | 2 | $372B |
|
||
| Chemicals | 1 | $45B |
|
||
| Automotive Retail | 1 | $29B |
|
||
| Healthcare / Medical Devices | 1 | $23B |
|
||
| Automotive Technology | 1 | $20B |
|
||
Price history
1 event — show timeline
- 2026-05-13 Listed $129,900 WWMLS
Property tax history
+12.1%/yrLatest (2025): $891 · +1.1% YoY. Source: county tax records.
Cash-flow waterfall
monthlySold comps — $/sqft
last 12 mo · ≤1 miLoading sold comps…