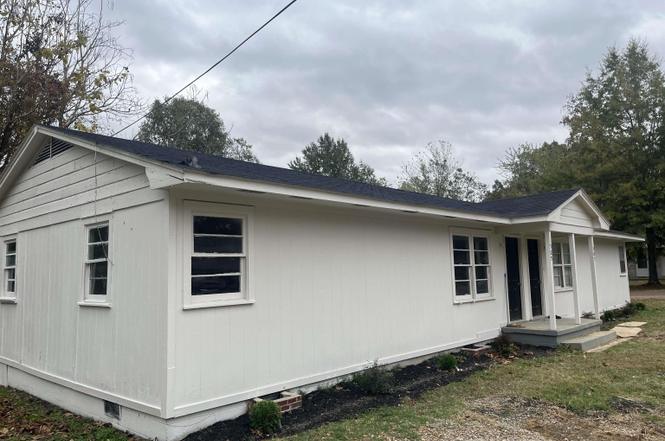
507 Tilghman St · Kenton, TN
Flood risk 3/10 · Minor
- FEMA flood zone
- X (unshaded)
- Chance of flooding over 30 yrs
- 0.2%
- Est. flood insurance / yr
- $507 – $1,088
Fire risk 1/10 · Minimal
- Est. fire insurance / yr
- $949 – $1,763
Heat risk 6/10 · Moderate
- Hot days now (above 109°F)
- 7 days/yr
- Hot days in 30 yrs
- 22 days/yr
Wind risk 4/10 · Minor
- Chance of severe wind over 30 yrs
- 8.0%
Air-quality risk 1/10 · Minimal
- Unhealthy air days now
- 0 days/yr
- Unhealthy air days in 30 yrs
- 0 days/yr
Risk factors via First Street. Map © Google.
Why this score? — see what drove the D- grade
The composite is a weighted blend of 9 inputs, each scored 0–100. Each bar is that input's sub-score; the figure is the points it added to the 100-point composite (weight × sub-score).
- Cash flow +12.0/30.0
- Appreciation +5.3/10.0
- Schools +3.7/10.0
- ARV discount +3.6/15.0
- DSCR +3.5/10.0
- Livability +2.9/5.0
- Rent growth +2.5/5.0
- Condition / age +2.5/5.0
- 1% rule +2.3/10.0
$169,900
🖨 Deal sheet (PDF) 📄 Offer letter ✓ Due diligence
Listing remarks
Only 15 miles away from The University of Tennessee at Martin this Duplex Freshly updated and leased though October 2025 awaiting your special touch. Call listing agent to set up a showing!!
Key facts
- 0.34 acre lot
- 2 parking spots
- Built 1958
Property features AI
Finance
- Financial info: Each unit currently rented for $850/month (actual rent listed)
Exterior
- Parking: 2 open parking spaces
- Utilities: Public water; Public sewer
- Home design: Duplex residential income property; Single-story
- Construction: Wood siding; Asphalt roof
- Exterior features: Level lot; Paved road access
Interior
- Bedrooms: Two 2-bedroom units (each unit has 2 bedrooms)
- Flooring: Hardwood; Vinyl
- Heating & cooling: Wall furnace heating; Window-unit cooling
- Interior features: Fireplace (1) with no special features listed; Hardwood floors; Vinyl floors; Crawl space basement
Neighborhood map
What this means for you Summary
Snapshot
- This is a 4-bed/2.0-bath single-family listed at $170k.
Deal economics
- At list price, monthly cash flow is $-42 ($-500/yr) — negative.
- To cash-flow at today's rent, offer at most $163k (4.3% below list).
- To meet the 1% rule (rent ≥ 1% of price), the offer needs to be $124k (27.1% below list).
- Recommended offer: $124k (27.1% below list) — sets the bar for 1% rule.
Location & tenants
- Location reads 58/100 on livability (#309 in TN) — a working-class tenant base; expect higher turnover. Strengths: cost of living A+, housing A+, crime B; Watch: health & safety C-, employment D, amenities F.
- Gibson County Sp District (rural): math 47% / reading 39% proficiency, ranked #11 of 139 in TN (top 8%) — families likely to look elsewhere, expect single-tenant / working-renter base with shorter leases.
- Zoned schools: Kenton Elementary School (math 30% / reading 10%, grade F, #644 of 952 statewide, top 68%, 91 students, 0% FRL); South Gibson County Middle School (math 58% / reading 42%, grade C, #20 of 333 statewide, top 6%, 800 students, 0% FRL); Gibson County High School (math 27% / reading 37%, grade F, #56 of 332 statewide, top 20%, 449 students, 0% FRL) — zoned schools average 0% FRL vs 33% district-wide (33 pts lower); this property's tenant base skews higher-income than the district average.
- Market conditions: 16 active listings in the ZIP; 155 units permitted in Gibson County in 2024 (0 in 5+ unit buildings).
Forward outlook
- In year one you build about $2k of equity ($1k loan paydown + $1k appreciation (0.6% local appreciation)).
- Gibson County population projected to shrink 8% by 2050 — rents likely to lag national; underwrite the cash flow, not the appreciation.
Negotiation context
- It's been on market 385 days — a 12% lower offer ($150k) is reasonable based on typical stale-listing flexibility.
- 2 sale attempts since 3y ago with the ask held roughly flat each time — persistent listings suggest the price (not the market) is what's stuck; bring a comps-based counter.
Risks & watch-outs
- Watch-outs: built in 1958 — expect roof / HVAC / electrical / plumbing capex.
- Climate carrying-cost: extreme-heat days projected 7→22/yr by 2055 (HVAC capex compounding) — expect insurance premiums to compound above CPI over the hold.
Questions for the listing agent
- What do current leases actually rent for vs. the listed asking? Can we see a recent rent roll and the last 12 months of T-12 income?
- It's been on market 385 days. Have you received any prior offers? Is the seller open to a 27% concession, seller financing, or rate buy-down credit?
- Built in 1958 — when were the roof, HVAC, electrical panel, plumbing, and water heater last replaced?
- Why hasn't it sold? Are there any deal-killer items the seller is aware of (foundation, flood, title, zoning, code violations)?
- Is there a deadline driving the sale (1031 exchange, divorce, estate, relocation)? That informs how much negotiation room exists.
- Schools are F-rated, which usually means shorter tenancies and higher turnover. Who's the typical renter profile here, and what's been the actual vacancy rate?
- The area grade is low — what's the realistic commute time and amenity access for the typical tenant pool here? Any planned neighborhood developments (good or bad) we should know about?
- What's the average days-on-market for RENTAL listings here right now (not sales)? A rising rental-DOM trend means longer vacancies and softer asking-rent achievability than the comps imply.
- What's the recent tenant-quality profile in this submarket — average credit score on applications, eviction rate, late-payment / NSF rate, and stable-employment percentage? A property-management company in the area should have these aggregated.
- How much new for-sale + rental construction is in the pipeline within 1–3 miles? Heavy new supply typically softens prices + rents 12–24 months out; constrained supply supports both.
Investment metrics
- 1% rule
- 0.73% ✗
- Cap rate
- 6.00%
- Cash-on-cash
- -1.05%
- DSCR
- 0.95
- GRM
- 11.4
CMA / ARV
- ARV (on-the-fly)
- $156,416
- Comps found
- 1
Show comp detail 1 sale within ~0.75 mi
| Address | Dist | Beds/Ba | Sqft | Sold | Price | $/sf | Match |
|---|---|---|---|---|---|---|---|
| 322 Hillcrest St | 0.68mi | 3/1.5 (-1) | 1,483 (-11%) | 15mo | $140,000 | $94 | 31 |
Match score weights: distance 35% · size 25% · config 20% · recency 20%. Top-matched comps best support the ARV.
Projected returns pro-forma
0.6% appreciation · 3.0% rent growth · sell at horizon
- IRR
- -1.2%
- Equity multiple
- 0.94×
- Total profit
- $-2,880
- Equity at exit
- $54,461
- IRR
- 3.9%
- Equity multiple
- 1.45×
- Total profit
- $21,642
- Equity at exit
- $69,711
Cash invested: $47,572 (down + closing). Projections, not guarantees.
Landlord ↔ Tenant lean methodology
- Overall (STATE)
- 87 Strongly Landlord-Friendly
- State Tennessee
- 87 Strongly Landlord-Friendly · R+13
- County
- — inherits STATE
- City
- — inherits STATE
ZIP-level market 38233
- Home prices YoY
- 0.3%
- Active inventory
- 16
- Price-to-rent
- 11.4×
Monthly cashflow live
- Estimated rent
- $1,238 medium interval (Pro) →
- Mortgage (P&I)
- −$891
- Tax from tax record
- −$58 /mo · $696/yr
- Insurance
- −$71
- HOA
- −$0
- Vacancy / Maint / Mgmt
- −$260
- Net cashflow
- $-42
Break-even live
Sensitivity live
| Price | -10% $55 | -5% $6 | +0% $-42 | +5% $-90 | +10% $-138 |
|---|---|---|---|---|---|
| Rent | -10% $-139 | -5% $-91 | +0% $-42 | +5% $7 | +10% $56 |
| Rate | -1.0pp $44 | -0.5pp $2 | base $-42 | +0.5pp $-86 | +1.0pp $-130 |
UW: 25.0% down · 7.5% · 30yr · 1.5% tax · 5.0% vac · 8.0% maint · 8.0% mgmt
Financing live
Cash to close
- Down payment
- $42,475
- Closing costs
- $5,097
- Reserves months
- —
- Total cash needed
- —
Loan-product check · same deal, 3 products live
Conventional
25% down · 7.5% · 30yr
- Down + closing
- —
- Monthly P&I
- —
- Monthly cashflow
- —
- DSCR
- —
- Eligible?
- —
Personal DTI + credit; lowest rate.
DSCR
20% down · 8.5% · 30yr
- Down + closing
- —
- Monthly P&I
- —
- Monthly cashflow
- —
- DSCR
- —
- Eligible?
- —
No personal income docs; deal must DSCR.
Hard money
10% down · 12.0% · 12mo
- Down + closing
- —
- Monthly P&I
- —
- Monthly cashflow
- —
- DSCR
- —
- Eligible?
- —
Short-term bridge; refi at stabilization.
Listing history 22 events
-
2026-06-21days on market $169,900 Active 385 DOM
-
2026-06-21days on market $169,900 Active 384 DOM
-
2026-06-18days on market $169,900 Active 382 DOM
-
2026-06-17days on market $169,900 Active 381 DOM
-
2026-06-16days on market $169,900 Active 380 DOM
-
2026-06-15days on market $169,900 Active 379 DOM
-
2026-06-13days on market $169,900 Active 377 DOM
-
2026-06-12days on market $169,900 Active 376 DOM
-
2026-06-09days on market $169,900 Active 373 DOM
-
2026-06-08days on market $169,900 Active 372 DOM
-
2026-06-08days on market $169,900 Active 371 DOM
-
2026-06-07days on market $169,900 Active 370 DOM
-
2026-06-03days on market $169,900 Active 367 DOM
-
2026-06-02days on market $169,900 Active 366 DOM
-
2026-06-01days on market $169,900 Active 365 DOM
-
2026-05-31days on market $169,900 Active 364 DOM
-
2025-06-01$169,900 Active
-
2023-10-05historical
-
2023-09-20price $25,000
-
2023-09-12price $30,000
-
2023-09-05price $37,500
-
2023-08-26$40,000 Active
ⓘ Source: listings_history table (triggers on properties + properties_extension) + one-shot
backfill from property_details.listing_events for pre-trigger history.
Tax reassessment forecast TN · Resets to sale price
- Current annual tax
- $696 · $58/mo
- Projected year-2 tax
- $1,206 · $101/mo
- Expected delta
- +$510/yr (+$43/mo · 73.3%)
ⓘ Screening estimate from a state-policy table — verify with the county assessor before closing.
Climate risk First Street
- Flood 3/10 Moderate FEMA zone X (unshaded) · 20% chance over 30 yrs
- Wildfire 1/10 Low
- Heat 6/10 Major 7 d/yr ≥109°F today · 22 d/yr by 30 yrs out
- Wind 4/10 Moderate 8% chance of damaging wind over 30 yrs
- Air quality 1/10 Low 0 unhealthy d/yr today · 0 by 30 yrs out
Nearby sold comps map
Loading sold comps map…
Walkable amenities ~0.75 mi
Loading nearby amenities…
Taxation est. · year 1
- Rental income
- $14,857
- − Mortgage interest
- −$9,517
- − Property taxes
- −$696
- − Insurance
- −$850
- − Repairs & maintenance
- −$1,189
- − Management
- −$1,189
- − Depreciation
- −$4,943
- Taxable loss
- −$3,525
- Est. tax savings @ 24.0%
- +$846
- After-tax cash flow
- $346/yr
For passive investors: Depreciation is non-cash, so a rental often shows a tax loss while cash-flowing — sheltering income. Rental losses are passive: they offset passive income freely, and up to $25,000/yr can offset ordinary (W-2) income if you actively participate and your MAGI is under $100k (phasing out to $0 by $150k); unused losses carry forward. On sale, claimed depreciation is recaptured at up to 25%, and gains may owe capital-gains tax (a 1031 exchange can defer both). Figures are a year-1 estimate at your 24.0% rate — not tax advice; consult a CPA.
Schools (NCES district)
- District
- Gibson County Sp District
- NCES district ID
- 4701400
- Math proficiency
- 47% ▼ -13.00%
- Reading proficiency
- 39% ▼ -5.00%
- Median HH income
- $47,868
- Composite
- 36.82/100
- National rank
- #4565
- State rank
- #11 of 139 in TN
Livability — Kenton
- Score
- 58/100
- State rank
- #309
- US rank
- #21028
Category grades
Schools grade is shown separately in the Schools card above.
Census & demographics
- Census place
- Kenton, TN
- Population (ZIP)
- 2,795
Population outlook (Gibson County) Hauer SSP2
- Today (2025)
- 48,793 people
- By 2030
- 48,221 · -1.2%
- By 2040
- 46,793 · -4.1%
- By 2050
- 44,909 · -8.0%
- By 2075
- 40,191 · -17.6%
- By 2100
- 33,574 · -31.2%
Race, ethnicity, and origin ACS 2023
- Neighborhood character
- Predominantly White (85%)
- Race & ethnicity
- White 85% Two or more races 9% Black 5%
- Common ancestry
- Slovak 2% Italian 1% Portuguese 1%
- Foreign-born
- 0%
- Languages at home
- 98% English-only · German/W. Germanic 1% Spanish 1%
Political lean MEDSL · Gibson
- 2024 margin
- Solid R (+52.0) · D 23.6% · R 75.5%
- 2008→2024 swing
- -23.2pp toward R · 2008: -28.8pp · 2024: -52.0pp
- All cycles
- 2024: R+52.0 2020: R+47.0 2016: R+43.8 2012: R+32.1 2008: R+28.8
Not yet ingested
- Civics
- —
Market trends
- HPI YoY
- ▲ 0.60%
- Current HPI
- 211.069
- Rent YoY
- —
- Metro
- —
- State GDP YoY
- ▲ 2.78%
- F500 in state
- 22
Industry mix (Fortune 500 HQ in TN)
| Industry | F500 HQs | Revenue |
|---|---|---|
| Healthcare | 3 | $91B |
|
||
| Retail | 3 | $72B |
|
||
| Transportation / Logistics | 1 | $88B |
|
||
| Paper / Packaging | 1 | $19B |
|
||
| Insurance | 1 | $13B |
|
||
| Energy | 1 | $12B |
|
||
Price history
+324.8% since first listed6 events — show timeline
- 2025-06-01 Listed $169,900 RRAR as distributed by MLS GRID
- 2023-10-05 Listing Removed — REALTRACS as Distributed by MLS Grid
- 2023-09-20 Price Changed $25,000 REALTRACS as Distributed by MLS Grid
- 2023-09-12 Price Changed $30,000 REALTRACS as Distributed by MLS Grid
- 2023-09-05 Price Changed $37,500 REALTRACS as Distributed by MLS Grid
- 2023-08-26 Listed $40,000 REALTRACS as Distributed by MLS Grid
Property tax history
-1.3%/yrLatest (2025): $696 · +2.5% YoY. Source: county tax records.
Cash-flow waterfall
monthlySold comps — $/sqft
last 12 mo · ≤1 miLoading sold comps…