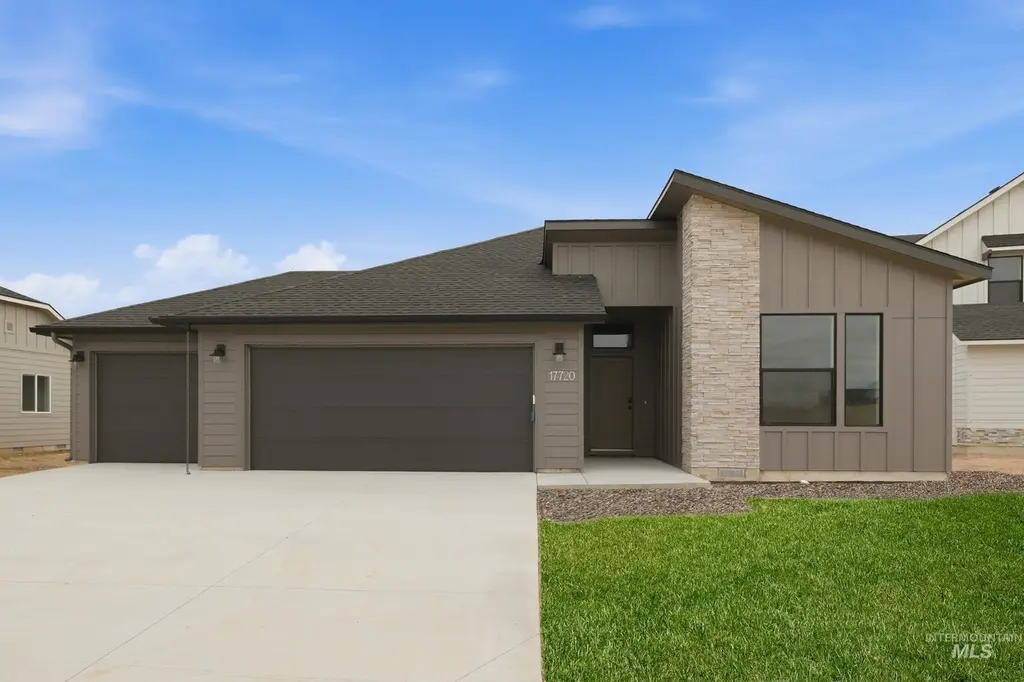
17720 N Hugh Glass Way · Nampa, ID
Flood risk 1/10 · Minimal
- FEMA flood zone
- X (unshaded)
- Chance of flooding over 30 yrs
- 0.0%
- Est. flood insurance / yr
- $507 – $1,088
Fire risk 1/10 · Minimal
- Est. fire insurance / yr
- $584 – $1,086
Heat risk 4/10 · Minor
- Hot days now (above 97°F)
- 7 days/yr
- Hot days in 30 yrs
- 17 days/yr
Wind risk 1/10 · Minimal
- Chance of severe wind over 30 yrs
- —
Air-quality risk 8/10 · Major
- Unhealthy air days now
- 12 days/yr
- Unhealthy air days in 30 yrs
- 18 days/yr
Risk factors via First Street. Map © Google.
Why this score? — see what drove the D grade
The composite is a weighted blend of 9 inputs, each scored 0–100. Each bar is that input's sub-score; the figure is the points it added to the 100-point composite (weight × sub-score).
- Cash flow +12.8/30.0
- ARV discount +7.5/15.0
- Condition / age +4.0/5.0
- 1% rule +3.8/10.0
- DSCR +3.8/10.0
- Schools +3.8/10.0
- Livability +3.6/5.0
- Rent growth +3.4/5.0
- Appreciation +0.0/10.0
$509,990
🖨 Deal sheet (PDF) 📄 Offer letter ✓ Due diligence
Listing remarks
Unlock your $25K now through May 31! Ask a Sales Specialist for details. Enter into a brand new home in Nampa, Idaho and enjoy its benefits and stress free living! The Preston 2126 is designed with easy living in mind, beginning with a dedicated entryway that leads into open living areas highlighted by vaulted ceilings and abundant natural light. The kitchen, living room, and dining room blend seamlessly to create an ideal space for hosting, relaxing, or gathering for everyday moments. The kitchen boasts upgraded finishes, including stainless steel appliances, a gas range, and stylish solid surface countertops. The primary suite is positioned at the rear of the home to offer a quiet retreat
Key facts
- Open living areas
- Upgraded finishes
- Dedicated entryway
Tags
Property features AI
Finance
- Other: Located in Nampa NE area (Spring Hollow Ranch)
- HOA & community: Homeowners association with annual fee of $650; Subdivision: Spring Hollow Ranch
Exterior
- Parking: Attached 3-car garage; Covered parking for 3 vehicles
- Utilities: City water service; Sewer connected; Gas available (natural gas heating, gas range, gas water heater)
- Home design: Single family residence; New construction (built 2026); Built by CBH Homes
- Construction: Frame construction with HardiPlank-type siding; Composition roof; New construction
- Exterior features: Partial fencing; Sidewalks; Automatic sprinkler system (partial/pressurized irrigation)
Interior
- Kitchen: Kitchen on main level; Kitchen approx. 10 x 10; Kitchen island; Pantry; Breakfast bar; Solid surface counters; Dishwasher; Microwave; Oven/Range (freestanding); Gas Range; Disposal
- Bedrooms: 4 bedrooms, all on the main level; Primary bedroom approx. 15 x 14; Second bedroom approx. 12 x 12 (listed 12 x 13); Third bedroom approx. 11 x 12; Fourth bedroom approx. 12 x 11
- Flooring: Carpet; Engineered vinyl plank
- Bathrooms: 2 bathrooms; Primary bath with double vanity
- Heating & cooling: Forced-air heating (natural gas); Central air conditioning
- Interior features: Primary bedroom on main level; Bath in primary bedroom; Split bedroom layout; Great room; Double vanity in bath; Walk-in closet(s); Breakfast bar; Pantry; Kitchen island; Solid surface counters
- Laundry & utility: Utility/laundry room on the main level; Gas water heater
Neighborhood map
What this means for you Summary
Snapshot
- This is a 4-bed/2.0-bath single-family listed at $510k. Condition is rated good.
Deal economics
- At list price, monthly cash flow is $-49 ($-586/yr) — negative.
- To cash-flow at today's rent, offer at most $503k (1.4% below list).
- To meet the 1% rule (rent ≥ 1% of price), the offer needs to be $447k (12.4% below list).
- Recommended offer: $447k (12.4% below list) — sets the bar for 1% rule.
- Cap rate 6.2% vs local median 3.2% in Nampa — top-decile yield for the area; either an underpriced asset or a hidden risk that comps aren't pricing in. Stress-test before assuming the spread holds.
Location & tenants
- Location reads 72/100 on livability (#47 in ID) — a middle-class / working-renter tenant base. Strengths: housing A+, health & safety A+, cost of living A-; Watch: employment C-, amenities F, commute F.
- Vallivue School District (rural): math 34% / reading 56% proficiency, ranked #48 of 92 in ID (top 52%) — families likely to look elsewhere, expect single-tenant / working-renter base with shorter leases.
- Zoned schools: East Canyon Elementary School (math 34% / reading 44%, grade F, #247 of 357 statewide, top 70%, 692 students, 33% FRL); Sage Valley Middle School (math 27% / reading 55%, grade F, #68 of 109 statewide, top 62%, 810 students, 28% FRL); Ridgevue High School (math 27% / reading 67%, grade D-, #55 of 169 statewide, top 34%, 1,578 students, 31% FRL) — zoned schools average 31% FRL vs 52% district-wide (21 pts lower); this property's tenant base skews higher-income than the district average.
- Market conditions: Rents rising (+3.4%/yr); 638 active listings in the ZIP; 10 comparable units currently listed for rent nearby; rentals at typical pace (median 17d on market — plan ~3-4 weeks tenant-placement turnaround); solid renter incomes; 3,620 units permitted in Canyon County in 2024 (196 in 5+ unit buildings).
- At $4,468/mo this rent would consume 70% of the median local household income ($77k/yr) (locally 683% of renters already pay >50% of income on rent) — very limited rent-growth headroom before tenants either downsize or default.
Forward outlook
- Local home prices are declining (-3.0%/yr); year-one equity from $4k of loan paydown is wiped out by about $15k of value loss. Plan a longer hold.
- Canyon County population projected at +41% by 2050 — long-run rental-demand tailwind backs the buy-and-hold thesis.
Negotiation context
- It's been on market 64 days — a 6% lower offer ($479k) is reasonable based on typical stale-listing flexibility.
Questions for the listing agent
- What do current leases actually rent for vs. the listed asking? Can we see a recent rent roll and the last 12 months of T-12 income?
- It's been on market 64 days. Have you received any prior offers? Is the seller open to a 12% concession, seller financing, or rate buy-down credit?
- What does the HOA fee cover, when was the last increase, and are there any pending special assessments or reserve-fund shortfalls?
- Why hasn't it sold? Are there any deal-killer items the seller is aware of (foundation, flood, title, zoning, code violations)?
- Is there a deadline driving the sale (1031 exchange, divorce, estate, relocation)? That informs how much negotiation room exists.
- Schools are D-rated, which usually means shorter tenancies and higher turnover. Who's the typical renter profile here, and what's been the actual vacancy rate?
- The area grade is low — what's the realistic commute time and amenity access for the typical tenant pool here? Any planned neighborhood developments (good or bad) we should know about?
- What's the average days-on-market for RENTAL listings here right now (not sales)? A rising rental-DOM trend means longer vacancies and softer asking-rent achievability than the comps imply.
- What's the recent tenant-quality profile in this submarket — average credit score on applications, eviction rate, late-payment / NSF rate, and stable-employment percentage? A property-management company in the area should have these aggregated.
- How much new for-sale + rental construction is in the pipeline within 1–3 miles? Heavy new supply typically softens prices + rents 12–24 months out; constrained supply supports both.
Investment metrics
- 1% rule
- 0.88% ✗
- Cap rate
- 6.18%
- Cash-on-cash
- -0.41%
- DSCR
- 0.98
- GRM
- 9.5
CMA / ARV
- ARV (on-the-fly)
- $510,240
- Comps found
- 12
Show comp detail 12 sales within ~0.75 mi
| Address | Dist | Beds/Ba | Sqft | Sold | Price | $/sf | Match |
|---|---|---|---|---|---|---|---|
| 5030 E Open Canyon Dr | 0.07mi | 4/2.0 | 2,023 (-5%) | 1mo | $469,990 | $232 | 88 |
| 5214 E Phelps Lake Dr | 0.09mi | 4/2.0 | 2,025 (-5%) | 1mo | $459,990 | $227 | 88 |
| 5200 E Phelps Lake Dr | 0.08mi | 4/2.0 | 2,023 (-5%) | 2mo | $479,990 | $237 | 87 |
| 5256 E Phelps Lake Dr | 0.13mi | 4/2.5 | 2,054 (-3%) | 0mo | $469,990 | $229 | 86 |
| 5072 E Open Canyon Dr | 0.05mi | 4/2.5 | 1,893 (-11%) | 0mo | $451,990 | $239 | 77 |
| 5127 E Open Canyon Dr | 0.03mi | 4/2.0 | 1,860 (-12%) | 0mo | $451,990 | $243 | 77 |
| 17691 N Boone Peak Ave | 0.04mi | 4/2.0 | 1,860 (-12%) | 1mo | $439,990 | $237 | 77 |
| 17663 N Boone Peak Ave | 0.05mi | 4/2.5 | 1,893 (-11%) | 2mo | $454,990 | $240 | 76 |
| 5268 E Open Canyon Dr | 0.16mi | 4/2.5 | 1,893 (-11%) | 1mo | $456,990 | $241 | 72 |
| 5576 E Garby St Lot 12 Block 7 | 0.57mi | 4/2.0 | 2,046 (-4%) | 1mo | $533,601 | $261 | 66 |
| 5564 E Garby St Lot 13 Block 7 | 0.57mi | 4/2.0 | 1,979 (-7%) | 1mo | $519,990 | $263 | 61 |
| 5552 E Garby St Lot 14 Block 7 | 0.57mi | 4/3.0 | 2,258 (+6%) | 1mo | $549,990 | $244 | 58 |
Match score weights: distance 35% · size 25% · config 20% · recency 20%. Top-matched comps best support the ARV.
Projected returns pro-forma
-3.0% appreciation · 3.44% rent growth · sell at horizon
- IRR
- -16.5%
- Equity multiple
- 0.41×
- Total profit
- $-83,665
- Equity at exit
- $76,041
- IRR
- -7.4%
- Equity multiple
- 0.52×
- Total profit
- $-68,227
- Equity at exit
- $44,095
Cash invested: $142,797 (down + closing). Projections, not guarantees.
Landlord ↔ Tenant lean methodology
- Overall (STATE)
- 91 Strongly Landlord-Friendly
- State Idaho
- 91 Strongly Landlord-Friendly · R+18
- County
- — inherits STATE
- City
- — inherits STATE
ZIP-level market 83687
- Home prices YoY
- -21.0%
- Rents YoY
- 3.4%
- Active inventory
- 638
- Price-to-rent
- 9.5×
Monthly cashflow live
- Estimated rent
- $4,468 high interval (Pro) →
- Mortgage (P&I)
- −$2,674
- Tax est. 1.5%
- −$637 /mo · $7,650/yr
- Insurance
- −$212
- HOA
- −$54
- Vacancy / Maint / Mgmt
- −$938
- Net cashflow
- $-49
Break-even live
Sensitivity live
| Price | -10% $304 | -5% $127 | +0% $-49 | +5% $-225 | +10% $-401 |
|---|---|---|---|---|---|
| Rent | -10% $-402 | -5% $-225 | +0% $-49 | +5% $128 | +10% $304 |
| Rate | -1.0pp $208 | -0.5pp $81 | base $-49 | +0.5pp $-181 | +1.0pp $-315 |
UW: 25.0% down · 7.5% · 30yr · 1.5% tax · 5.0% vac · 8.0% maint · 8.0% mgmt
Financing live
Cash to close
- Down payment
- $127,498
- Closing costs
- $15,300
- Reserves months
- —
- Total cash needed
- —
Loan-product check · same deal, 3 products live
Conventional
25% down · 7.5% · 30yr
- Down + closing
- —
- Monthly P&I
- —
- Monthly cashflow
- —
- DSCR
- —
- Eligible?
- —
Personal DTI + credit; lowest rate.
DSCR
20% down · 8.5% · 30yr
- Down + closing
- —
- Monthly P&I
- —
- Monthly cashflow
- —
- DSCR
- —
- Eligible?
- —
No personal income docs; deal must DSCR.
Hard money
10% down · 12.0% · 12mo
- Down + closing
- —
- Monthly P&I
- —
- Monthly cashflow
- —
- DSCR
- —
- Eligible?
- —
Short-term bridge; refi at stabilization.
Rent comps 10 comps
| Address | Beds | Baths | Sqft | Rent | $/sqft | DOM | Units | Dist |
|---|---|---|---|---|---|---|---|---|
| 5126 E Sylvan Hart Dr Unit 1322143P Nampa, ID | 5.0 | 2.5 | 2992 | $6,692 | $2.24 | 16d | 1 | 0.07mi |
| 5563 E Garby St Nampa, ID | 3.0 | 2.0 | 1408 | $2,195 | $1.56 | 23d | 1 | 0.57mi |
| 5553 E Bollo St Unit 1322139P Nampa, ID | 3.0 | 2.5 | 1991 | $3,376 | $1.70 | 13d | 1 | 0.81mi |
| 5643 E Bollo St Unit 1250641P Nampa, ID | 3.0 | 2.5 | 1797 | $3,396 | $1.89 | 13d | 1 | 0.85mi |
| 16852 Idaho Center Blvd Nampa, ID | 3.0 | 2.5 | 1558 | $1,762 | $1.13 | 5d | 3 | 1.13mi |
| 7003 W Redwood Creek Dr Meridian, ID | 4.0 | 2.0 | 2025 | $2,650 | $1.31 | 16d | 1 | 1.18mi |
| 6960 W Redwood Creek Dr Unit 1250677P Meridian, ID | 5.0 | 2.5 | 2798 | $6,915 | $2.47 | 16d | 1 | 1.22mi |
| 6670 W Yoke St Meridian, ID | 3.0 | 2.0 | 1903 | $2,500 | $1.31 | 25d | 1 | 1.24mi |
| 4289 N Glassford Ave Unit 1250678P Meridian, ID | 4.0 | 2.0 | 2195 | $5,366 | $2.44 | 13d | 1 | 1.28mi |
| 6643 W Redwood Creek Dr Meridian, ID | 3.0 | 2.0 | 1694 | $2,350 | $1.39 | 5d | 1 | 1.33mi |
HOA detail
- Monthly dues
- $54 · $648/yr
- Likely covers
- gas
Listing history 2 events
-
2026-05-21status Pending
-
2026-03-18$509,990 Active
ⓘ Source: listings_history table (triggers on properties + properties_extension) + one-shot
backfill from property_details.listing_events for pre-trigger history.
Climate risk First Street
- Flood 1/10 Low FEMA zone X (unshaded) · 0% chance over 30 yrs
- Wildfire 1/10 Low
- Heat 4/10 Moderate 7 d/yr ≥97°F today · 17 d/yr by 30 yrs out
- Wind 1/10 Low
- Air quality 8/10 Severe 12 unhealthy d/yr today · 18 by 30 yrs out
Nearby sold comps map
Loading sold comps map…
Walkable amenities ~0.75 mi
Loading nearby amenities…
Taxation est. · year 1
- Rental income
- $53,614
- − Mortgage interest
- −$28,567
- − Property taxes
- −$7,650
- − Insurance
- −$2,550
- − Repairs & maintenance
- −$4,289
- − Management
- −$4,289
- − HOA
- −$648
- − Depreciation
- −$14,836
- Taxable loss
- −$9,216
- Est. tax savings @ 24.0%
- +$2,212
- After-tax cash flow
- $1,625/yr
For passive investors: Depreciation is non-cash, so a rental often shows a tax loss while cash-flowing — sheltering income. Rental losses are passive: they offset passive income freely, and up to $25,000/yr can offset ordinary (W-2) income if you actively participate and your MAGI is under $100k (phasing out to $0 by $150k); unused losses carry forward. On sale, claimed depreciation is recaptured at up to 25%, and gains may owe capital-gains tax (a 1031 exchange can defer both). Figures are a year-1 estimate at your 24.0% rate — not tax advice; consult a CPA.
Condition & rehab AI · 13 photos
This home is in excellent condition with modern finishes and a fresh exterior. Minor touch-ups and maintenance would further enhance its curb appeal and rental value.
Value-add opportunities
- Resale Paint exterior trim — Enhances curb appeal and value
- Rental Inspect and clean gutters — Keeps property in good condition and reduces maintenance costs
Renovation cost estimate screening
Value-add ROI direction
- Resale Paint exterior trim — Enhances curb appeal and value ↑
- Rental Inspect and clean gutters — Keeps property in good condition and reduces maintenance costs ↑
ⓘ Cost ranges are severity-bucket heuristics (US national rule-of-thumb). Get contractor quotes + a written scope before underwriting a rehab budget.
Schools (NCES district)
- District
- Vallivue School District
- NCES district ID
- 1600600
- Math proficiency
- 34% ▼ -9.00%
- Reading proficiency
- 56% ▼ -1.00%
- Median HH income
- $47,377
- Composite
- 38.3/100
- National rank
- #4229
- State rank
- #48 of 92 in ID
Livability — Nampa
- Score
- 72/100
- State rank
- #47
- US rank
- #6250
Category grades
Schools grade is shown separately in the Schools card above.
Census & demographics
- Census place
- Nampa, ID
- County
- Canyon County · 235,358 people
- City population
- 142,249
- Metro
- Boise City, ID
- Population (ZIP)
- 43,135
- Household income
- $76,682
- Rent vs Own
- Severe rent burden
- 683.0
Population outlook (Canyon County) Hauer SSP2
- Today (2025)
- 248,853 people
- By 2030
- 269,596 · +8.3%
- By 2040
- 311,081 · +25.0%
- By 2050
- 350,809 · +41.0%
- By 2075
- 441,884 · +77.6%
- By 2100
- 505,641 · +103.2%
Race, ethnicity, and origin ACS 2023
- Neighborhood character
- Predominantly White (71%)
- Race & ethnicity
- White 71% Hispanic / Latino 21% Two or more races 11% Black 2% Native American 1%
- Hispanic origin (detail)
- Mexican 18%
- Common ancestry
- Italian 4% Slovak 3% Lithuanian 2%
- Foreign-born
- 7% · Canada
- Languages at home
- 85% English-only · Spanish 12% Russian/Polish/Slavic 1%
Political lean MEDSL · Canyon
- 2024 margin
- Solid R (+46.6) · D 25.4% · R 72.0% · Other 2.5%
- 2008→2024 swing
- -11.4pp toward R · 2008: -35.2pp · 2024: -46.6pp
- All cycles
- 2024: R+46.6 2020: R+39.7 2016: R+41.8 2012: R+37.1 2008: R+35.2
Not yet ingested
- Civics
- —
Market trends
- HPI YoY
- ▼ -103.50%
- Current HPI
- 388.8148
- Rent YoY
- ▲ 3.44%
- Metro
- Boise City, ID
- State GDP YoY
- ▲ 4.51%
- F500 in state
- 6
Industry mix (Fortune 500 HQ in ID)
| Industry | F500 HQs | Revenue |
|---|---|---|
| Retail | 1 | $79B |
|
||
| Technology | 1 | $25B |
|
||
| Food / Agriculture | 1 | $6B |
|
||
Price history
2 events — show timeline
- 2026-05-21 Pending — IMLS
- 2026-03-18 Listed $509,990 IMLS
Cash-flow waterfall
monthlySold comps — $/sqft
last 12 mo · ≤1 miLoading sold comps…