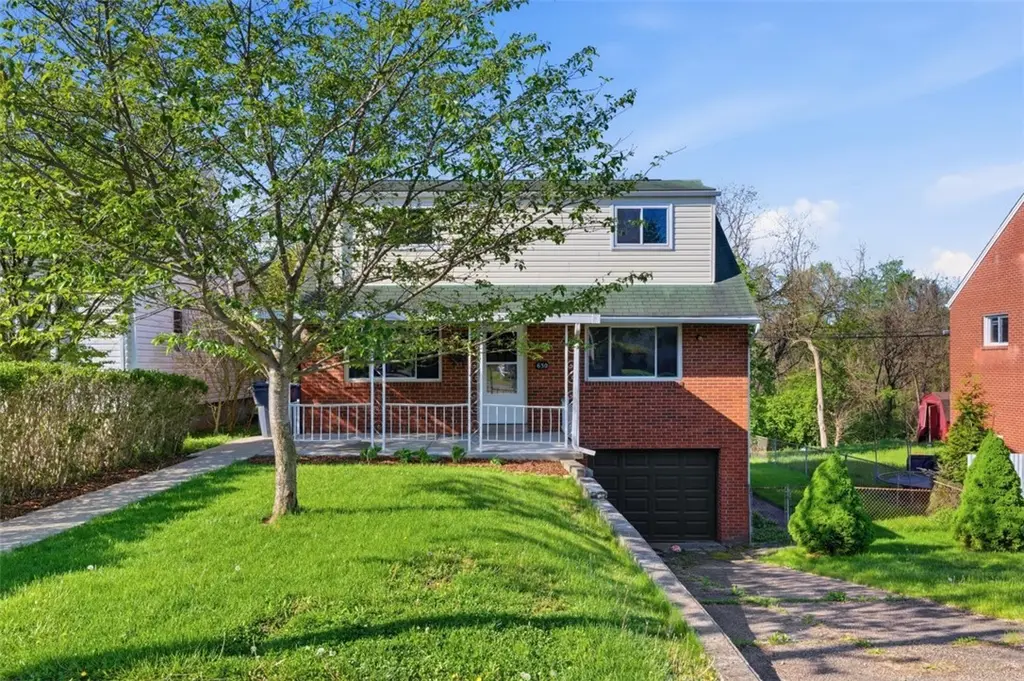
630 Hope St · Carnegie, PA
Flood risk 1/10 · Minimal
- FEMA flood zone
- X (unshaded)
- Chance of flooding over 30 yrs
- 0.0%
- Est. flood insurance / yr
- $473 – $860
Fire risk 1/10 · Minimal
- Est. fire insurance / yr
- $511 – $949
Heat risk 4/10 · Minor
- Hot days now (above 96°F)
- 7 days/yr
- Hot days in 30 yrs
- 17 days/yr
Wind risk 2/10 · Minimal
- Chance of severe wind over 30 yrs
- —
Air-quality risk 2/10 · Minimal
- Unhealthy air days now
- 0 days/yr
- Unhealthy air days in 30 yrs
- 3 days/yr
Risk factors via First Street. Map © Google.
Why this score? — see what drove the D+ grade
The composite is a weighted blend of 9 inputs, each scored 0–100. Each bar is that input's sub-score; the figure is the points it added to the 100-point composite (weight × sub-score).
- ARV discount +15.0/15.0
- Cash flow +12.5/30.0
- 1% rule +4.5/10.0
- Livability +4.3/5.0
- Schools +4.1/10.0
- DSCR +3.7/10.0
- Rent growth +3.0/5.0
- Condition / age +2.5/5.0
- Appreciation +0.0/10.0
$189,000
🖨 Deal sheet 📄 Offer letter ✓ Due diligence
Listing remarks MLS
* * Equal Housing * * Buyer pays both sides of transfer stamps, and a $725 addtl charge at closing * * VA contracts & addenduns Req, List hold $$.
Key facts
- Walk-out basement
- Outdoor space
- 6,499 sq ft lot
Tags
Neighborhood map
What this means for you Summary
Snapshot
- This is a 3-bed/1.0-bath single-family listed at $189k.
Deal economics
- At list price, monthly cash flow is $-26 ($-314/yr) — negative.
- To cash-flow at today's rent, offer at most $184k (2.4% below list).
- To meet the 1% rule (rent ≥ 1% of price), the offer needs to be $180k (4.9% below list).
- Recommended offer: $180k (4.9% below list) — sets the bar for 1% rule.
- Cap rate 6.1% vs local median 5.1% in Carnegie — meaningfully above typical; check what's discounted (condition, days-on-market, listing class) to confirm the premium yield is real.
Location & tenants
- Location reads 86/100 on livability (#55 in PA, #344 nationally) — a professional / high-income tenant draw. Strengths: crime A+, commute A+, cost of living A+; Watch: amenities D.
- Chartiers Valley SD (suburban): math 37% / reading 57% proficiency, ranked #221 of 539 in PA (top 41%) — families likely to look elsewhere, expect single-tenant / working-renter base with shorter leases.
- Market conditions: Rents rising (+2.0%/yr); 30 active listings in the ZIP; 16 comparable units currently listed for rent nearby; rentals leasing fast (median 5d on market — plan ~1-2 weeks tenant-placement turnaround); solid renter incomes; 2,996 units permitted in Allegheny County in 2024 (1,588 in 5+ unit buildings).
Forward outlook
- Local home prices are declining (-3.0%/yr); year-one equity from $1k of loan paydown is wiped out by about $6k of value loss. Plan a longer hold.
Negotiation context
- Only 4 days on market — expect competitive offers; lowballing is unlikely to land.
- 3 sale attempts since 32y ago with the ask held roughly flat each time — persistent listings suggest the price (not the market) is what's stuck; bring a comps-based counter.
- Current owner paid $86k; list at $189k implies a 120% gain — meaningful room to come down on a strong offer.
Questions for the listing agent
- What do current leases actually rent for vs. the listed asking? Can we see a recent rent roll and the last 12 months of T-12 income?
- Built in 1961 — when were the roof, HVAC, electrical panel, plumbing, and water heater last replaced?
- Is there a deadline driving the sale (1031 exchange, divorce, estate, relocation)? That informs how much negotiation room exists.
- The area grade is low — what's the realistic commute time and amenity access for the typical tenant pool here? Any planned neighborhood developments (good or bad) we should know about?
- What's the average days-on-market for RENTAL listings here right now (not sales)? A rising rental-DOM trend means longer vacancies and softer asking-rent achievability than the comps imply.
- What's the recent tenant-quality profile in this submarket — average credit score on applications, eviction rate, late-payment / NSF rate, and stable-employment percentage? A property-management company in the area should have these aggregated.
- How much new for-sale + rental construction is in the pipeline within 1–3 miles? Heavy new supply typically softens prices + rents 12–24 months out; constrained supply supports both.
Investment metrics
- 1% rule
- 0.95% ✗
- Cap rate
- 6.13%
- Cash-on-cash
- -0.59%
- DSCR
- 0.97
- GRM
- 8.8
CMA / ARV
- ARV (on-the-fly)
- $274,176
- Comps found
- 12
Show comp detail 12 sales within ~0.75 mi
| Address | Dist | Beds/Ba | Sqft | Sold | Price | $/sf | Match |
|---|---|---|---|---|---|---|---|
| 630 Hope St | 0.00mi | 4/1.5 (+1) | 1,428 (0%) | 1mo | $216,000 | $151 | 92 |
| 2142 Swallow Hill Rd | 0.09mi | 3/2.0 | 1,417 (-1%) | 7mo | $210,500 | $149 | 85 |
| 606 Hope St | 0.06mi | 3/2.0 | 1,295 (-9%) | 2mo | $229,900 | $178 | 76 |
| 59 Carol Dr | 0.52mi | 3/2.5 | 1,452 (+2%) | 2mo | $319,000 | $220 | 66 |
| 140 Foxcroft Rd | 0.35mi | 3/2.5 | 1,538 (+8%) | 1mo | $295,000 | $192 | 64 |
| 139 Grienbrier Dr | 0.53mi | 3/2.0 | 1,388 (-3%) | 5mo | $287,000 | $207 | 62 |
| 1012 Lindsay Rd | 0.56mi | 3/2.0 | 1,498 (+5%) | 4mo | $435,290 | $291 | 59 |
| 60 Swallow Hill Rd | 0.53mi | 2/2.0 (-1) | 1,525 (+7%) | 1mo | $372,000 | $244 | 54 |
| 319 Glenn Ave | 0.73mi | 4/2.0 (+1) | 1,536 (+8%) | 1mo | $225,000 | $146 | 44 |
| 930 Lindsay Rd | 0.47mi | 4/2.5 (+1) | 1,600 (+12%) | 4mo | $313,250 | $196 | 43 |
| 843 Library Ave | 0.65mi | 3/2.0 | 1,257 (-12%) | 3mo | $233,000 | $185 | 43 |
| 13 Annabelle St | 0.69mi | 2/1.0 (-1) | 1,282 (-10%) | 7mo | $103,300 | $81 | 40 |
Match score weights: distance 35% · size 25% · config 20% · recency 20%. Top-matched comps best support the ARV.
Projected returns pro-forma
-3.0% appreciation · 1.99% rent growth · sell at horizon
- IRR
- -18.5%
- Equity multiple
- 0.36×
- Total profit
- $-33,986
- Equity at exit
- $28,181
- IRR
- -13.1%
- Equity multiple
- 0.27×
- Total profit
- $-38,549
- Equity at exit
- $16,341
Cash invested: $52,920 (down + closing). Projections, not guarantees.
Landlord ↔ Tenant lean methodology
- Overall (STATE)
- 62 Landlord-Friendly
- State Pennsylvania
- 62 Landlord-Friendly · EVEN
- County
- — inherits STATE
- City
- — inherits STATE
ZIP-level market 15220
- Home prices YoY
- -28.2%
- Rents YoY
- 2.0%
- Active inventory
- 30
- Price-to-rent
- 8.8×
Monthly cashflow live
- Estimated rent
- $1,798 high interval (Pro) →
- Mortgage (P&I)
- −$991
- Tax from tax record
- −$377 /mo · $4,518/yr
- Insurance
- −$79
- HOA
- −$0
- Vacancy / Maint / Mgmt
- −$378
- Net cashflow
- $-26
Break-even live
UW: 25.0% down · 7.5% · 30yr · 1.5% tax · 5.0% vac · 8.0% maint · 8.0% mgmt
Financing live
Cash to close
- Down payment
- $47,250
- Closing costs
- $5,670
- Reserves months
- —
- Total cash needed
- —
Loan-product check · same deal, 3 products live
Conventional
25% down · 7.5% · 30yr
- Down + closing
- —
- Monthly P&I
- —
- Monthly cashflow
- —
- DSCR
- —
- Eligible?
- —
Personal DTI + credit; lowest rate.
DSCR
20% down · 8.5% · 30yr
- Down + closing
- —
- Monthly P&I
- —
- Monthly cashflow
- —
- DSCR
- —
- Eligible?
- —
No personal income docs; deal must DSCR.
Hard money
10% down · 12.0% · 12mo
- Down + closing
- —
- Monthly P&I
- —
- Monthly cashflow
- —
- DSCR
- —
- Eligible?
- —
Short-term bridge; refi at stabilization.
Rent comps 16 comps
| Address | Beds | Baths | Sqft | Rent | $/sqft | DOM | Units | Dist |
|---|---|---|---|---|---|---|---|---|
| 834 Washington Ave Carnegie, PA | 1.0–2.0 | 1.0–2.0 | 1026 | $1,638 | $1.60 | 3d | 11 | 0.59mi |
| 525 Carothers Ave Ste 2 Carnegie, PA | 3.0 | 1.0 | 1600 | $1,000 | $0.62 | 24d | 1 | 0.63mi |
| 851 Kennedy St Carnegie, PA | 3.0 | 1.0 | 1100 | $1,800 | $1.64 | 24d | 1 | 0.64mi |
| 135 Greenbriar Dr Pittsburgh, PA | 3.0 | 1.0 | 950 | $1,550 | $1.63 | 4d | 1 | 0.66mi |
| 230 Magazine St Unit 2 Carnegie, PA | 2.0 | 1.0 | 1200 | $1,295 | $1.08 | 44d | 1 | 0.76mi |
| 300 Chatham Park Dr Pittsburgh, PA | 3.0 | 1.0–2.5 | 890 | $2,040 | $2.29 | 2d | 49 | 1.16mi |
| 301 Chatham Park Dr Pittsburgh, PA | 1.0–2.0 | 1.0–1.5 | 772 | $1,789 | $2.32 | 2d | 15 | 1.17mi |
| 920 Margarite Dr Unit D Pittsburgh, PA | 2.0 | 1.0 | 996 | $1,400 | $1.41 | 44d | 1 | 1.17mi |
| 196 Jamestown Dr Pittsburgh, PA | 2.0 | 1.5 | 990 | $1,850 | $1.87 | 4d | 1 | 1.18mi |
| 312 Midland Ave Carnegie, PA | 3.0 | 1.0 | 1332 | $1,400 | $1.05 | 44d | 1 | 1.21mi |
| 1170 Bower Hill Rd Pittsburgh, PA | 1.0–3.0 | 1.0–2.0 | 1012 | $1,850 | $1.83 | 2d | 1 | 1.22mi |
| 651 Royce Ave Pittsburgh, PA | 3.0 | 1.5 | 1350 | $2,200 | $1.63 | 2d | 1 | 1.28mi |
| 1900 Tee Ct Presto, PA | 1.0–3.0 | 1.0–2.0 | 981 | $2,128 | $2.17 | 2d | 9 | 1.31mi |
| 100 Branch St Carnegie, PA | 3.0 | 1.0 | 1606 | $1,590 | $0.99 | 24d | 1 | 1.32mi |
| 303 Lexington Ct Carnegie, PA | 2.0 | 1.0 | 1144 | $1,200 | $1.05 | 10d | 1 | 1.35mi |
| 462 Greenhurst Dr Pittsburgh, PA | 4.0 | 4.0 | 1520 | $4,000 | $2.63 | 2d | 1 | 1.45mi |
Listing history 8 events
-
2026-04-27status Pending
-
2026-04-22$189,000 Active
-
2006-08-11soldstatus $86,000
-
2006-08-07soldstatus $86,000 155-char remark
Show marketing remark (155 chars)
* * Equal Housing * * Buyer pays both sides of transfer stamps, and a $725 addtl charge at closing * * VA contracts & addenduns Req, List hold $$.
-
2006-06-06$90,200 155-char remark
Show marketing remark (155 chars)
* * Equal Housing * * Buyer pays both sides of transfer stamps, and a $725 addtl charge at closing * * VA contracts & addenduns Req, List hold $$.
-
1995-01-10soldstatus $84,444
-
1995-01-06soldstatus $84,444 119-char remark
Show marketing remark (119 chars)
WONDERFUL NEIGHBORHOOD * 4 BEDROOMS FOR PRICE OF 3 * !! * $3000 DECOR/PAINT ALLOW * !! * AGENTS MOB #389-0245 * HARD
-
1994-07-29$84,444 119-char remark
Show marketing remark (119 chars)
WONDERFUL NEIGHBORHOOD * 4 BEDROOMS FOR PRICE OF 3 * !! * $3000 DECOR/PAINT ALLOW * !! * AGENTS MOB #389-0245 * HARD
ⓘ Source: listings_history table (triggers on properties + properties_extension) + one-shot
backfill from property_details.listing_events for pre-trigger history.
Tax reassessment forecast PA · Partial reset (capped growth)
- Current annual tax
- $4,518 · $377/mo
- Projected year-2 tax
- $4,518 · $377/mo
- Expected delta
- $0/yr ($0/mo · 0.0%)
ⓘ Screening estimate from a state-policy table — verify with the county assessor before closing.
Climate risk First Street
- Flood 1/10 Low FEMA zone X (unshaded) · 0% chance over 30 yrs
- Wildfire 1/10 Low
- Heat 4/10 Moderate 7 d/yr ≥96°F today · 17 d/yr by 30 yrs out
- Wind 2/10 Low
- Air quality 2/10 Low 0 unhealthy d/yr today · 3 by 30 yrs out
Nearby sold comps map
Loading sold comps map…
Walkable amenities ~0.75 mi
Loading nearby amenities…
Taxation est. · year 1
- Rental income
- $21,574
- − Mortgage interest
- −$10,587
- − Property taxes
- −$4,518
- − Insurance
- −$945
- − Repairs & maintenance
- −$1,726
- − Management
- −$1,726
- − Depreciation
- −$5,498
- Taxable loss
- −$3,426
- Est. tax savings @ 24.0%
- +$822
- After-tax cash flow
- $509/yr
For passive investors: Depreciation is non-cash, so a rental often shows a tax loss while cash-flowing — sheltering income. Rental losses are passive: they offset passive income freely, and up to $25,000/yr can offset ordinary (W-2) income if you actively participate and your MAGI is under $100k (phasing out to $0 by $150k); unused losses carry forward. On sale, claimed depreciation is recaptured at up to 25%, and gains may owe capital-gains tax (a 1031 exchange can defer both). Figures are a year-1 estimate at your 24.0% rate — not tax advice; consult a CPA.
Schools (NCES district)
- District
- Chartiers Valley SD
- NCES district ID
- 4205700
- Math proficiency
- 37% ▼ -16.00%
- Reading proficiency
- 57% ▼ -17.00%
- Median HH income
- $57,191
- Composite
- 40.91/100
- National rank
- #3614
- State rank
- #221 of 539 in PA
Livability — Carnegie
- Score
- 86/100
- State rank
- #55
- US rank
- #344
Category grades
Schools grade is shown separately in the Schools card above.
Census & demographics
- County
- Allegheny County · 1,022,028 people
- City population
- 19,244
- Metro
- Pittsburgh, PA
- Population (ZIP)
- 17,644
- Household income
- $75,611
- Rent vs Own
- Severe rent burden
- 503.0
Population outlook (Allegheny County) Hauer SSP2
- Today (2025)
- 1,250,282 people
- By 2030
- 1,256,482 · +0.5%
- By 2040
- 1,256,318 · +0.5%
- By 2050
- 1,244,169 · -0.5%
- By 2075
- 1,197,693 · -4.2%
- By 2100
- 1,093,187 · -12.6%
Race, ethnicity, and origin ACS 2023
- Neighborhood character
- Predominantly White (70%)
- Race & ethnicity
- White 70% Asian 16% Two or more races 7% Black 7%
- Common ancestry
- Romanian 7% Slovak 2% Subsaharan African 1%
- Foreign-born
- 18% · China, Canada, Vietnam
- Languages at home
- 81% English-only · Other Asian/Pacific 10% Other Indo-European 4% Arabic 1%
Political lean MEDSL · Allegheny
- 2024 margin
- Strong D (+20.3) · D 59.7% · R 39.4%
- 2008→2024 swing
- +4.8pp toward D · 2008: 15.5pp · 2024: 20.3pp
- All cycles
- 2024: D+20.3 2020: D+20.4 2016: D+16.4 2012: D+14.4 2008: D+15.5
Not yet ingested
- Civics
- —
Market trends
- HPI YoY
- ▼ -101.30%
- Current HPI
- 257.2796
- Rent YoY
- ▲ 1.99%
- Metro
- Pittsburgh, PA
- State GDP YoY
- ▲ 1.68%
- F500 in state
- 34
Industry mix (Fortune 500 HQ in PA)
| Industry | F500 HQs | Revenue |
|---|---|---|
| Healthcare | 2 | $309B |
|
||
| Insurance | 2 | $27B |
|
||
| Telecommunications / Media | 1 | $124B |
|
||
| Industrial Distribution | 1 | $22B |
|
||
| Financial Services | 1 | $20B |
|
||
| Chemicals / Materials | 1 | $18B |
|
||
Price history
+123.8% since first listed8 events — show timeline
- 2026-04-27 Pending — West Penn MLS
- 2026-04-22 Listed $189,000 West Penn MLS
- 2006-08-11 Sold (Public Records) $86,000 Public Records
- 2006-08-07 Sold (MLS) $86,000 West Penn MLS
- 2006-06-06 Listed $90,200 West Penn MLS
- 1995-01-10 Sold (Public Records) $84,444 Public Records
- 1995-01-06 Sold (MLS) $84,444 West Penn MLS
- 1994-07-29 Listed $84,444 West Penn MLS
Property tax history
+2.5%/yrLatest (2026): $4,518 · +0.0% YoY. Source: county tax records.
Cash-flow waterfall
monthlySold comps — $/sqft
last 12 mo · ≤1 miLoading sold comps…