 🌊 Lakefront
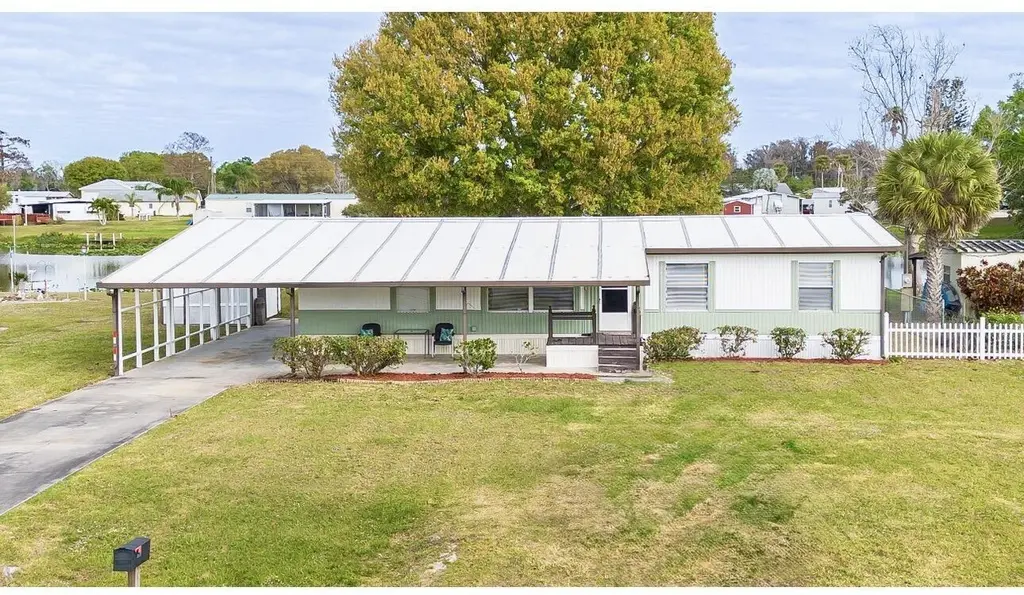
2027 SE 27th St · Taylor Creek, FL
Flood risk 1/10 · Minimal
- FEMA flood zone
- X (shaded)
- Chance of flooding over 30 yrs
- 0.0%
- Est. flood insurance / yr
- $507 – $1,088
Fire risk 3/10 · Minor
- Est. fire insurance / yr
- $947 – $1,759
Heat risk 9/10 · Severe
- Hot days now (above 108°F)
- 7 days/yr
- Hot days in 30 yrs
- 24 days/yr
Wind risk 10/10 · Severe
- Chance of severe wind over 30 yrs
- 99.0%
Air-quality risk 2/10 · Minimal
- Unhealthy air days now
- 1 days/yr
- Unhealthy air days in 30 yrs
- 2 days/yr
Risk factors via First Street. Map © Google.
Why this score? — see what drove the D+ grade
The composite is a weighted blend of 9 inputs, each scored 0–100. Each bar is that input's sub-score; the figure is the points it added to the 100-point composite (weight × sub-score).
- Cash flow +13.4/30.0
- ARV discount +12.9/15.0
- DSCR +4.0/10.0
- Schools +3.6/10.0
- 1% rule +3.4/10.0
- Livability +2.8/5.0
- Rent growth +2.5/5.0
- Condition / age +2.5/5.0
- Appreciation +0.0/10.0
$220,000
🖨 Deal sheet 📄 Offer letter ✓ Due diligence
Listing remarks
Welcome to waterfront living in Taylor Creek Isles. This beautifully updated 3-bedroom 2-bath manufactured home sits on a Captive lake and offers the perfect mix of comfort, charm, and outdoor space. Inside, you'll find a bright split floor plan with waterproof laminate flooring, updated bathrooms and all new appliances. The property features a large carport with extended driveway and additional circular drive with plenty of room for a boat or even an RV. This property is also on City water and sewer. This home is truly move in ready and ideal for full time living or a weekend retreat.
Key facts
- Circular drive
- Waterfront living
- Updated bathrooms
Tags
Property features AI
Finance
- Other: Pets allowed with no restrictions
- HOA & community: No association amenities
Exterior
- Parking: Attached covered carport (2 spaces); Circular driveway
- Utilities: Public water; Public sewer; Sewer available; Water available
- Home design: Manufactured home; Single-story; Resale property; Faces south
- Construction: Modular construction; Aluminum skirt; Other roof
- Exterior features: Patio; Shed(s); Waterfront property; Lot dimensions approximately 90 ft x 150 ft
Interior
- Kitchen: Electric range; Refrigerator
- Bedrooms: 3 bedrooms on the main level
- Flooring: Laminate flooring
- Bathrooms: 2 full bathrooms
- Heating & cooling: Central heating; Central air conditioning
- Interior features: Split bedroom layout
- Laundry & utility: Indoor laundry in a laundry closet
Neighborhood map
What this means for you Summary
Snapshot
- This is a 3-bed/2.0-bath manufactured listed at $220k.
Deal economics
- At list price, monthly cash flow is $6 ($69/yr) — positive.
- The deal already cash-flows at list — no discount required.
- To meet the 1% rule (rent ≥ 1% of price), the offer needs to be $184k (16.3% below list).
- Recommended offer: $184k (16.3% below list) — sets the bar for 1% rule.
- Cap rate 6.3% vs local median 4.1% in Taylor Creek — top-decile yield for the area; either an underpriced asset or a hidden risk that comps aren't pricing in. Stress-test before assuming the spread holds.
Location & tenants
- Location reads 56/100 on livability (#874 in FL) — a working-class tenant base; expect higher turnover. Strengths: cost of living A+, housing A+, crime B+; Watch: amenities F, commute F, employment F.
- Okeechobee (town): math 44% / reading 42% proficiency, ranked #58 of 73 in FL (top 80%) — families likely to look elsewhere, expect single-tenant / working-renter base with shorter leases; 72% free/reduced lunch — lower-income household profile, screen leases tightly.
- Zoned schools: South Elementary School (math 38% / reading 49%, grade F, #1,345 of 2,144 statewide, top 64%, 573 students, 61% FRL); Osceola Middle School (math 53% / reading 36%, grade D, #320 of 571 statewide, top 57%, 753 students, 67% FRL); Okeechobee High School (math 30% / reading 42%, grade F, #359 of 667 statewide, top 55%, 1,692 students, 62% FRL).
- Market conditions: 402 active listings in the ZIP; 18 units permitted in Okeechobee County in 2024 (0 in 5+ unit buildings).
- This rent runs 42% of the median local income ($53k/yr) — at the standard rent-burdened threshold; future hikes will face affordability resistance.
Forward outlook
- Local home prices are declining (-3.0%/yr); year-one equity from $2k of loan paydown is wiped out by about $7k of value loss. Plan a longer hold.
- Okeechobee County population projected at -21% by 2050 — secular population decline; favor cash flow + early exit over multi-decade hold.
Negotiation context
- It's been on market 21 days — a 2% lower offer ($217k) is reasonable based on typical stale-listing flexibility.
- 5 sale attempts since 4y ago; this cycle's ask has dropped $15k (6%) from the opening price — seller is motivated, your offer sets the floor, not the list.
- Current owner paid $115k; list at $220k implies a 91% gain — meaningful room to come down on a strong offer.
Risks & watch-outs
- Climate carrying-cost: severe wind risk, 99% chance of damaging wind over 30y; extreme-heat days projected 7→24/yr by 2055 (HVAC capex compounding) — expect insurance premiums to compound above CPI over the hold.
Questions for the listing agent
- Is there a deadline driving the sale (1031 exchange, divorce, estate, relocation)? That informs how much negotiation room exists.
- Schools are F-rated, which usually means shorter tenancies and higher turnover. Who's the typical renter profile here, and what's been the actual vacancy rate?
- The area grade is low — what's the realistic commute time and amenity access for the typical tenant pool here? Any planned neighborhood developments (good or bad) we should know about?
- This sits on a lake — are riparian / water-frontage rights deeded with the parcel? Any dock permits, shoreline easements, or HOA water-use restrictions?
- What's the documented flood / surge / shoreline-erosion history here (FEMA AND non-FEMA — e.g., storm surge, creek backup, septic-field saturation)?
- Any water-quality or seasonal algae-bloom issues that affect tenant satisfaction or short-term-rental demand?
- What's the average days-on-market for RENTAL listings here right now (not sales)? A rising rental-DOM trend means longer vacancies and softer asking-rent achievability than the comps imply.
- What's the recent tenant-quality profile in this submarket — average credit score on applications, eviction rate, late-payment / NSF rate, and stable-employment percentage? A property-management company in the area should have these aggregated.
- How much new for-sale + rental construction is in the pipeline within 1–3 miles? Heavy new supply typically softens prices + rents 12–24 months out; constrained supply supports both.
Investment metrics
- 1% rule
- 0.84% ✗
- Cap rate
- 6.32%
- Cash-on-cash
- 0.11%
- DSCR
- 1.00
- GRM
- 10.0
CMA / ARV
- ARV (on-the-fly)
- $250,120
- Comps found
- 12
Show comp detail 12 sales within ~0.75 mi
| Address | Dist | Beds/Ba | Sqft | Sold | Price | $/sf | Match |
|---|---|---|---|---|---|---|---|
| 2306 SE 31st St | 0.34mi | 3/2.0 | 1,362 (+1%) | 9mo | $275,000 | $202 | 76 |
| 2001 SE 27th St | 0.02mi | 2/2.0 (-1) | 1,476 (+9%) | 5mo | $197,000 | $133 | 75 |
| 2128 SE 32nd St | 0.35mi | 3/2.0 | 1,296 (-4%) | 4mo | $250,000 | $193 | 73 |
| 1903 SE 30th St S | 0.19mi | 2/2.0 (-1) | 1,441 (+7%) | 4mo | $267,000 | $185 | 72 |
| 2200 SE 24th Blvd | 0.24mi | 3/2.0 | 1,512 (+12%) | 2mo | $220,000 | $146 | 67 |
| 1930 SE 24th Blvd | 0.12mi | 3/2.0 | 1,200 (-11%) | 17mo | $255,000 | $213 | 62 |
| 2408 SE 32nd St | 0.43mi | 3/2.0 | 1,296 (-4%) | 15mo | $141,300 | $109 | 61 |
| 2224 SE 34th Ln | 0.51mi | 2/2.0 (-1) | 1,344 (-1%) | 14mo | $240,000 | $179 | 58 |
| 3009 SE 23rd St SE | 0.67mi | 3/2.0 | 1,248 (-8%) | 7mo | $140,000 | $112 | 50 |
| 2803 SE 19th Ct | 0.71mi | 3/2.0 | 1,479 (+9%) | 11mo | $275,000 | $186 | 42 |
| 3515 SE 25th Ter | 0.63mi | 2/2.0 (-1) | 1,173 (-13%) | 20mo | $287,000 | $245 | 27 |
| 3111 SE 28th St | 0.70mi | 2/2.0 (-1) | 1,152 (-15%) | 19mo | $165,000 | $143 | 22 |
Match score weights: distance 35% · size 25% · config 20% · recency 20%. Top-matched comps best support the ARV.
Projected returns pro-forma
-3.0% appreciation · 3.0% rent growth · sell at horizon
- IRR
- -16.1%
- Equity multiple
- 0.43×
- Total profit
- $-35,301
- Equity at exit
- $32,803
- IRR
- -7.8%
- Equity multiple
- 0.51×
- Total profit
- $-30,336
- Equity at exit
- $19,022
Cash invested: $61,600 (down + closing). Projections, not guarantees.
Landlord ↔ Tenant lean methodology
- Overall (STATE)
- 87 Strongly Landlord-Friendly
- State Florida
- 87 Strongly Landlord-Friendly · R+3
- County
- — inherits STATE
- City
- — inherits STATE
ZIP-level market 34974
- Home prices YoY
- -15.6%
- Active inventory
- 402
- Price-to-rent
- 10.0×
Monthly cashflow live
- Estimated rent
- $1,841 medium interval (Pro) →
- Mortgage (P&I)
- −$1,154
- Tax from tax record
- −$203 /mo · $2,438/yr
- Insurance
- −$92
- HOA
- −$0
- Vacancy / Maint / Mgmt
- −$387
- Net cashflow
- $6
Break-even live
UW: 25.0% down · 7.5% · 30yr · 1.5% tax · 5.0% vac · 8.0% maint · 8.0% mgmt
Financing live
Cash to close
- Down payment
- $55,000
- Closing costs
- $6,600
- Reserves months
- —
- Total cash needed
- —
Loan-product check · same deal, 3 products live
Conventional
25% down · 7.5% · 30yr
- Down + closing
- —
- Monthly P&I
- —
- Monthly cashflow
- —
- DSCR
- —
- Eligible?
- —
Personal DTI + credit; lowest rate.
DSCR
20% down · 8.5% · 30yr
- Down + closing
- —
- Monthly P&I
- —
- Monthly cashflow
- —
- DSCR
- —
- Eligible?
- —
No personal income docs; deal must DSCR.
Hard money
10% down · 12.0% · 12mo
- Down + closing
- —
- Monthly P&I
- —
- Monthly cashflow
- —
- DSCR
- —
- Eligible?
- —
Short-term bridge; refi at stabilization.
Listing history 29 events
-
2026-06-19days on market $220,000 Active 21 DOM
-
2026-06-18days on market $220,000 Active 20 DOM
-
2026-06-17days on market $220,000 Active 19 DOM
-
2026-06-16days on market $220,000 Active 18 DOM
-
2026-06-15days on market $220,000 Active 17 DOM
-
2026-06-14days on market $220,000 Active 15 DOM
-
2026-06-10days on market $220,000 Active 12 DOM
-
2026-06-09days on market $220,000 Active 11 DOM
-
2026-06-08days on market $220,000 Active 10 DOM
-
2026-06-07days on market $220,000 Active 9 DOM
-
2026-06-05days on market $220,000 Active 6 DOM
-
2026-06-03days on market $220,000 Active 5 DOM
-
2026-06-02days on market $220,000 Active 4 DOM
-
2026-06-01days on market $220,000 Active 3 DOM
-
2026-05-31days on market $220,000 Active 2 DOM
-
2026-03-01$235,000 Active
-
2025-08-01historical
-
2025-06-12price $244,900
-
2025-02-04$245,000 Active
-
2025-01-27historical
-
2024-11-08$255,350 Active
-
2024-07-02historical
-
2024-06-21price $269,000
-
2024-02-19$272,900 Active
-
2024-02-16historical
-
2022-07-17soldstatus $115,000 Closed
-
2022-06-27soldstatus $115,000
-
2022-05-12status Pending
-
2022-05-07$119,000 Active
ⓘ Source: listings_history table (triggers on properties + properties_extension) + one-shot
backfill from property_details.listing_events for pre-trigger history.
Tax reassessment forecast FL · Resets to sale price
- Current annual tax
- $2,438 · $203/mo
- Projected year-2 tax
- $2,438 · $203/mo
- Expected delta
- $0/yr ($0/mo · 0.0%)
ⓘ Screening estimate from a state-policy table — verify with the county assessor before closing.
Climate risk First Street
- Flood 1/10 Low FEMA zone X (shaded) · 0% chance over 30 yrs
- Wildfire 3/10 Moderate
- Heat 9/10 Extreme 7 d/yr ≥108°F today · 24 d/yr by 30 yrs out
- Wind 10/10 Extreme 99% chance of damaging wind over 30 yrs
- Air quality 2/10 Low 1 unhealthy d/yr today · 2 by 30 yrs out
Nearby sold comps map
Loading sold comps map…
Walkable amenities ~0.75 mi
Loading nearby amenities…
Taxation est. · year 1
- Rental income
- $22,090
- − Mortgage interest
- −$12,323
- − Property taxes
- −$2,438
- − Insurance
- −$1,100
- − Repairs & maintenance
- −$1,767
- − Management
- −$1,767
- − Depreciation
- −$6,400
- Taxable loss
- −$3,706
- Est. tax savings @ 24.0%
- +$889
- After-tax cash flow
- $958/yr
For passive investors: Depreciation is non-cash, so a rental often shows a tax loss while cash-flowing — sheltering income. Rental losses are passive: they offset passive income freely, and up to $25,000/yr can offset ordinary (W-2) income if you actively participate and your MAGI is under $100k (phasing out to $0 by $150k); unused losses carry forward. On sale, claimed depreciation is recaptured at up to 25%, and gains may owe capital-gains tax (a 1031 exchange can defer both). Figures are a year-1 estimate at your 24.0% rate — not tax advice; consult a CPA.
Schools (NCES district)
- District
- Okeechobee
- NCES district ID
- 1201410
- Math proficiency
- 44% ▼ -12.00%
- Reading proficiency
- 42% ▼ -4.00%
- Median HH income
- $36,710
- Composite
- 35.73/100
- National rank
- #4855
- State rank
- #58 of 73 in FL
Livability — Taylor Creek
- Score
- 56/100
- State rank
- #874
- US rank
- #23017
Category grades
Schools grade is shown separately in the Schools card above.
Census & demographics
- Census place
- Taylor Creek, FL
- County
- Okeechobee County · 23,975 people
- Metro
- Okeechobee, FL
- Population (ZIP)
- 23,975
- Household income
- $53,013
- Rent vs Own
- Severe rent burden
- 399.0
Population outlook (Okeechobee County) Hauer SSP2
- Today (2025)
- 37,273 people
- By 2030
- 35,885 · -3.7%
- By 2040
- 32,931 · -11.6%
- By 2050
- 29,433 · -21.0%
- By 2075
- 19,607 · -47.4%
- By 2100
- 11,814 · -68.3%
Race, ethnicity, and origin ACS 2023
- Neighborhood character
- Predominantly White (74%)
- Race & ethnicity
- White 74% Hispanic / Latino 19% Two or more races 8% Asian 2% Black 2% Native American 1%
- Hispanic origin (detail)
- Mexican 12% Puerto Rican 1% Cuban 2%
- Common ancestry
- Lithuanian 2% Iranian 2% Italian 2%
- Foreign-born
- 11% · Canada, Jamaica
- Languages at home
- 81% English-only · Spanish 16% French/Haitian/Cajun 1% Other Indo-European 1%
Political lean MEDSL · Okeechobee
- 2024 margin
- Solid R (+53.8) · D 22.9% · R 76.7%
- 2008→2024 swing
- -34.6pp toward R · 2008: -19.2pp · 2024: -53.8pp
- All cycles
- 2024: R+53.8 2020: R+44.4 2016: R+39.5 2012: R+20.0 2008: R+19.2
Not yet ingested
- Civics
- —
Market trends
- HPI YoY
- ▼ -64.47%
- Current HPI
- 348.6692
- Rent YoY
- —
- Metro
- Okeechobee, FL
- State GDP YoY
- ▲ 3.28%
- F500 in state
- 36
Industry mix (Fortune 500 HQ in FL)
| Industry | F500 HQs | Revenue |
|---|---|---|
| Industrial Technology | 2 | $29B |
|
||
| Insurance | 2 | $17B |
|
||
| Retail | 1 | $60B |
|
||
| Technology Distribution | 1 | $58B |
|
||
| Homebuilding | 1 | $35B |
|
||
| Technology Manufacturing | 1 | $35B |
|
||
Price history
+97.5% since first listed14 events — show timeline
- 2026-03-01 Listed $235,000 Beaches MLS
- 2025-08-01 Listing Removed — Beaches MLS
- 2025-06-12 Price Changed $244,900 Beaches MLS
- 2025-02-04 Listed $245,000 Beaches MLS
- 2025-01-27 Listing Removed — Beaches MLS
- 2024-11-08 Listed $255,350 Beaches MLS
- 2024-07-02 Listing Removed — Beaches MLS
- 2024-06-21 Price Changed $269,000 Beaches MLS
- 2024-02-19 Listed $272,900 Beaches MLS
- 2024-02-16 Coming Soon — Beaches MLS
- 2022-07-17 Sold (MLS) $115,000 Stellar MLS as Distributed by MLS Grid
- 2022-06-27 Sold (Public Records) $115,000 Public Records
- 2022-05-12 Pending — Stellar MLS as Distributed by MLS Grid
- 2022-05-07 Listed $119,000 Stellar MLS as Distributed by MLS Grid
Property tax history
+8.8%/yrLatest (2025): $2,438 · +4.9% YoY. Source: county tax records.
Cash-flow waterfall
monthlySold comps — $/sqft
last 12 mo · ≤1 miLoading sold comps…