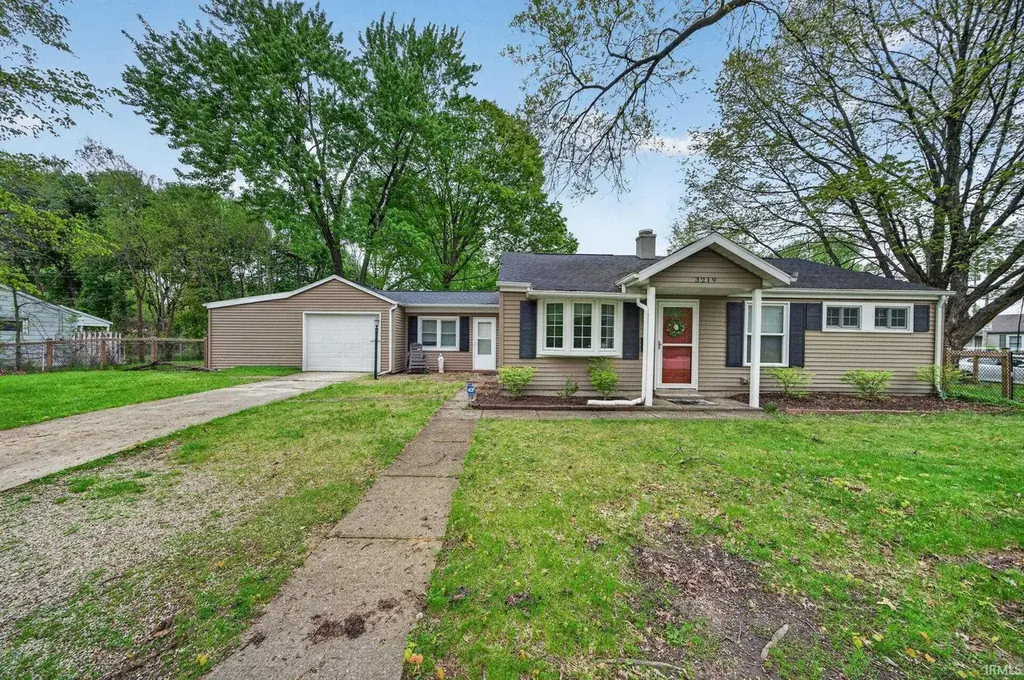
3219 Mckinley Ave · South Bend, IN
Flood risk 1/10 · Minimal
- FEMA flood zone
- X (unshaded)
- Chance of flooding over 30 yrs
- 0.0%
- Est. flood insurance / yr
- $507 – $1,088
Fire risk 2/10 · Minimal
- Est. fire insurance / yr
- $717 – $1,331
Heat risk 2/10 · Minimal
- Hot days now (above 99°F)
- 7 days/yr
- Hot days in 30 yrs
- 15 days/yr
Wind risk 2/10 · Minimal
- Chance of severe wind over 30 yrs
- —
Air-quality risk 3/10 · Minor
- Unhealthy air days now
- 2 days/yr
- Unhealthy air days in 30 yrs
- 3 days/yr
Risk factors via First Street. Map © Google.
Why this score? — see what drove the D grade
The composite is a weighted blend of 9 inputs, each scored 0–100. Each bar is that input's sub-score; the figure is the points it added to the 100-point composite (weight × sub-score).
- Cash flow +11.7/30.0
- ARV discount +11.2/15.0
- Rent growth +4.1/5.0
- DSCR +3.5/10.0
- Livability +3.2/5.0
- 1% rule +2.8/10.0
- Condition / age +2.5/5.0
- Schools +1.4/10.0
- Appreciation +0.0/10.0
$165,000
🖨 Deal sheet 📄 Offer letter ✓ Due diligence
Listing remarks MLS
Totally remodeled Full bath, updated kitchen includes appliances, greet finished breezeway for additional Sq ft, sunny LR, 3 bedrooms and oversized garage! Roof 2016, Furnace and A/C 2018, siding 2012. So close to shopping, dining, medical facilities.
Key facts
- Remolded bathroom
- Breezeway area
- Attached garage
Tags
Property features AI
Finance
- Other: Lot dimensions approximately 87 x 125 (0.25 acre)
Exterior
- Parking: Attached garage with 2 spaces; Garage door opener; Concrete driveway
- Utilities: Public water; Public sewer
- Home design: Single-family residence; Site-built home; One-story
- Construction: Vinyl siding; Asphalt roof; Slab with concrete perimeter foundation; Built as site-built construction
- Exterior features: Patio; Fully fenced wood yard
Interior
- Kitchen: Microwave; Refrigerator; Electric cooktop
- Bedrooms: Total of 6 rooms (includes bedrooms and living spaces)
- Flooring: Carpet; Tile; Vinyl
- Bathrooms: 1 full bathroom (main level)
- Heating & cooling: Central air; Ceiling fans; Natural gas forced air heating
- Interior features: Ceiling fans; Eat-in kitchen; Open floor plan; Laminate counters; One fireplace
- Laundry & utility: Washer included; Gas dryer hookup on main level
Neighborhood map
What this means for you Summary
Snapshot
- This is a 2-bed/1.5-bath single-family listed at $165k.
Deal economics
- At list price, monthly cash flow is $-47 ($-564/yr) — negative.
- To cash-flow at today's rent, offer at most $157k (5.0% below list).
- To meet the 1% rule (rent ≥ 1% of price), the offer needs to be $129k (21.7% below list).
- Recommended offer: $129k (21.7% below list) — sets the bar for 1% rule.
- Cap rate 6.0% vs local median 4.4% in South Bend — top-decile yield for the area; either an underpriced asset or a hidden risk that comps aren't pricing in. Stress-test before assuming the spread holds.
Location & tenants
- Location reads 64/100 on livability (#365 in IN) — a middle-class / working-renter tenant base. Strengths: cost of living A+, housing A+, health & safety A+; Watch: amenities D, employment D, crime F.
- South Bend Community School Corporation (urban): math 12% / reading 21% proficiency, ranked #284 of 301 in IN (top 94%) — low school quality limits family demand, transient renter base, plan for 1-2y turnover; 66% free/reduced lunch — lower-income household profile, screen leases tightly.
- Zoned schools: Edison Middle School (math 7% / reading 13%, grade F, #314 of 330 statewide, top 95%, 381 students, 84% FRL); Adams High School (math 28% / reading 57%, grade F, #195 of 369 statewide, top 53%, 1,976 students, 56% FRL) — zoned schools at 70% FRL track the district average.
- Market conditions: Rents rising fast (+6.3%/yr); 73 active listings in the ZIP; 20 comparable units currently listed for rent nearby; rentals leasing fast (median 14d on market — plan ~1-2 weeks tenant-placement turnaround); 754 units permitted in St. Joseph County in 2024 (460 in 5+ unit buildings).
Forward outlook
- Local home prices are declining (-3.0%/yr); year-one equity from $1k of loan paydown is wiped out by about $5k of value loss. Plan a longer hold.
Negotiation context
- Only 6 days on market — expect competitive offers; lowballing is unlikely to land.
- 2 sale attempts since 3y ago with the ask held roughly flat each time — persistent listings suggest the price (not the market) is what's stuck; bring a comps-based counter.
Risks & watch-outs
- Watch-outs: built in 1953 — expect roof / HVAC / electrical / plumbing capex.
Questions for the listing agent
- What do current leases actually rent for vs. the listed asking? Can we see a recent rent roll and the last 12 months of T-12 income?
- Built in 1953 — when were the roof, HVAC, electrical panel, plumbing, and water heater last replaced?
- Is there a deadline driving the sale (1031 exchange, divorce, estate, relocation)? That informs how much negotiation room exists.
- Schools are F-rated, which usually means shorter tenancies and higher turnover. Who's the typical renter profile here, and what's been the actual vacancy rate?
- Crime grade is F in this area — have there been break-ins, vandalism, or insurance claims at this property in the last 3 years? What carrier currently insures it and at what premium?
- The area grade is low — what's the realistic commute time and amenity access for the typical tenant pool here? Any planned neighborhood developments (good or bad) we should know about?
- What's the average days-on-market for RENTAL listings here right now (not sales)? A rising rental-DOM trend means longer vacancies and softer asking-rent achievability than the comps imply.
- What's the recent tenant-quality profile in this submarket — average credit score on applications, eviction rate, late-payment / NSF rate, and stable-employment percentage? A property-management company in the area should have these aggregated.
- How much new for-sale + rental construction is in the pipeline within 1–3 miles? Heavy new supply typically softens prices + rents 12–24 months out; constrained supply supports both.
Investment metrics
- 1% rule
- 0.78% ✗
- Cap rate
- 5.95%
- Cash-on-cash
- -1.22%
- DSCR
- 0.95
- GRM
- 10.6
CMA / ARV
- ARV (median comp)
- $179,971
- List price
- $165,000
- Delta
- -8.32%
- Verdict
- FAIR
- Comps
- 20 within 1.0 mi
Show comp detail 12 sales within ~0.75 mi
| Address | Dist | Beds/Ba | Sqft | Sold | Price | $/sf | Match |
|---|---|---|---|---|---|---|---|
| 3219 Mckinley Ave | 0.00mi | 3/1.0 (+1) | 952 (0%) | 0mo | $170,000 | $179 | 93 |
| 3113 Salem Dr | 0.44mi | 3/1.5 (+1) | 952 (0%) | 8mo | $154,500 | $162 | 68 |
| 3003 Wilder Dr | 0.31mi | 3/1.5 (+1) | 1,008 (+6%) | 9mo | $175,000 | $174 | 63 |
| 807 W Lowell Ave | 0.55mi | 3/1.0 (+1) | 925 (-3%) | 1mo | $164,900 | $178 | 62 |
| 915 W Borley Ave | 0.61mi | 2/2.0 | 960 (+1%) | 10mo | $120,000 | $125 | 60 |
| 526 S 30th St | 0.71mi | 2/1.0 | 978 (+3%) | 11mo | $78,000 | $80 | 51 |
| 1132 Manchester Dr | 0.71mi | 3/1.0 (+1) | 896 (-6%) | 2mo | $190,000 | $212 | 49 |
| 526 S 35th St | 0.71mi | 3/1.0 (+1) | 1,028 (+8%) | 2mo | $154,500 | $150 | 45 |
| 929 W Borley Ave | 0.59mi | 2/1.0 | 816 (-14%) | 9mo | $120,000 | $147 | 39 |
| 3215 Bentley Ln | 0.72mi | 3/1.0 (+1) | 1,064 (+12%) | 3mo | $180,000 | $169 | 38 |
| 527 Imus Dr | 0.70mi | 3/1.0 (+1) | 825 (-13%) | 4mo | $150,000 | $182 | 35 |
| 610 S 30th St | 0.74mi | 1/2.0 (-1) | 810 (-15%) | 10mo | $122,500 | $151 | 25 |
Match score weights: distance 35% · size 25% · config 20% · recency 20%. Top-matched comps best support the ARV.
Projected returns pro-forma
-3.0% appreciation · 6.27% rent growth · sell at horizon
- IRR
- -15.0%
- Equity multiple
- 0.45×
- Total profit
- $-25,366
- Equity at exit
- $24,602
- IRR
- -1.9%
- Equity multiple
- 0.85×
- Total profit
- $-6,773
- Equity at exit
- $14,266
Cash invested: $46,200 (down + closing). Projections, not guarantees.
Landlord ↔ Tenant lean methodology
- Overall (STATE)
- 90 Strongly Landlord-Friendly
- State Indiana
- 90 Strongly Landlord-Friendly · R+11
- County
- — inherits STATE
- City
- — inherits STATE
ZIP-level market 46615
- Home prices YoY
- -34.0%
- Rents YoY
- 6.3%
- Active inventory
- 73
- Price-to-rent
- 10.6×
Monthly cashflow live
- Estimated rent
- $1,292 high interval (Pro) →
- Mortgage (P&I)
- −$865
- Tax from tax record
- −$134 /mo · $1,608/yr
- Insurance
- −$69
- HOA
- −$0
- Vacancy / Maint / Mgmt
- −$271
- Net cashflow
- $-47
Break-even live
UW: 25.0% down · 7.5% · 30yr · 1.5% tax · 5.0% vac · 8.0% maint · 8.0% mgmt
Financing live
Cash to close
- Down payment
- $41,250
- Closing costs
- $4,950
- Reserves months
- —
- Total cash needed
- —
Loan-product check · same deal, 3 products live
Conventional
25% down · 7.5% · 30yr
- Down + closing
- —
- Monthly P&I
- —
- Monthly cashflow
- —
- DSCR
- —
- Eligible?
- —
Personal DTI + credit; lowest rate.
DSCR
20% down · 8.5% · 30yr
- Down + closing
- —
- Monthly P&I
- —
- Monthly cashflow
- —
- DSCR
- —
- Eligible?
- —
No personal income docs; deal must DSCR.
Hard money
10% down · 12.0% · 12mo
- Down + closing
- —
- Monthly P&I
- —
- Monthly cashflow
- —
- DSCR
- —
- Eligible?
- —
Short-term bridge; refi at stabilization.
Rent comps 20 comps
| Address | Beds | Baths | Sqft | Rent | $/sqft | DOM | Units | Dist |
|---|---|---|---|---|---|---|---|---|
| 3001 E Jefferson Blvd South Bend, IN | 1.0–2.0 | 1.0–2.0 | 848 | $1,329 | $1.57 | 13d | 21 | 0.43mi |
| 300 Pin Oak Cir Mishawaka, IN | 1.0–3.0 | 1.0–1.5 | 835 | $1,052 | $1.26 | 13d | 1 | 0.56mi |
| 427 S 27th St South Bend, IN | 2.0 | 1.0 | 840 | $950 | $1.13 | 43d | 1 | 0.74mi |
| 526 S 28th St South Bend, IN | 2.0 | 1.0 | 1000 | $1,350 | $1.35 | 13d | 1 | 0.78mi |
| 737 S 30th St South Bend, IN | 3.0 | 2.0 | 1000 | $1,600 | $1.60 | 43d | 1 | 0.91mi |
| 804 S 27th St South Bend, IN | 1.0 | 1.0 | 700 | $850 | $1.21 | 21d | 1 | 1.01mi |
| 754 S 23rd St South Bend, IN | 3.0 | 1.0 | 884 | $1,300 | $1.47 | 43d | 1 | 1.10mi |
| 117 Palau Ave Mishawaka, IN | 3.0 | 1.0 | 1100 | $1,650 | $1.50 | 13d | 1 | 1.15mi |
| 2508 E Mishawaka Ave Unit 3A South Bend, IN | 1.0 | 1.0 | 600 | $1,200 | $2.00 | 43d | 1 | 1.18mi |
| 1006 S 35th St South Bend, IN | 3.0 | 2.0 | 816 | $1,000 | $1.23 | 13d | 1 | 1.19mi |
| 303 Village Dr Mishawaka, IN | 1.0–3.0 | 1.0–1.5 | 918 | $1,619 | $1.76 | 13d | 25 | 1.30mi |
| 1512 Rosemary Ln South Bend, IN | 2.0 | 1.0 | 910 | $1,138 | $1.25 | 21d | 1 | 1.30mi |
| 724 Elizabeth St Mishawaka, IN | 1.0 | 1.0 | 850 | $875 | $1.03 | 13d | 1 | 1.34mi |
| 4312 Hickory Rd Mishawaka, IN | 2.0 | 1.0 | 591 | $1,171 | $1.98 | 13d | 44 | 1.37mi |
| 2530 Pleasant St Unit 3 South Bend, IN | 1.0 | 1.0 | 600 | $925 | $1.54 | 13d | 1 | 1.37mi |
| 1218 S 26th St South Bend, IN | 3.0 | 1.0 | 856 | $1,400 | $1.64 | 13d | 1 | 1.39mi |
| 302 Village Dr Mishawaka, IN | 1.0–3.0 | 1.0–1.5 | 950 | $1,591 | $1.67 | 13d | 33 | 1.39mi |
| 3530 Northside Blvd South Bend, IN | 1.0–2.0 | 1.0 | 850 | $1,200 | $1.41 | 13d | 1 | 1.41mi |
| 116 W Mishawaka Ave Mishawaka, IN | 3.0 | 1.0–2.0 | 948 | $1,914 | $2.02 | 13d | 31 | 1.42mi |
| 1106 S 20th St South Bend, IN | 1.0–3.0 | 1.0–2.0 | 885 | $924 | $1.04 | 13d | 1 | 1.47mi |
Listing history 5 events
-
2026-05-11status Pending 280-char remark
-
2026-05-05$165,000 Active 280-char remark
-
2023-11-20soldstatus $148,000 Closed 253-char remark
Show marketing remark (253 chars)
Totally remodeled Full bath, updated kitchen includes appliances, greet finished breezeway for additional Sq ft, sunny LR, 3 bedrooms and oversized garage! Roof 2016, Furnace and A/C 2018, siding 2012. So close to shopping, dining, medical facilities.
-
2023-10-07status Pending 253-char remark
Show marketing remark (253 chars)
Totally remodeled Full bath, updated kitchen includes appliances, greet finished breezeway for additional Sq ft, sunny LR, 3 bedrooms and oversized garage! Roof 2016, Furnace and A/C 2018, siding 2012. So close to shopping, dining, medical facilities.
-
2023-10-01$147,500 Active 253-char remark
Show marketing remark (253 chars)
Totally remodeled Full bath, updated kitchen includes appliances, greet finished breezeway for additional Sq ft, sunny LR, 3 bedrooms and oversized garage! Roof 2016, Furnace and A/C 2018, siding 2012. So close to shopping, dining, medical facilities.
ⓘ Source: listings_history table (triggers on properties + properties_extension) + one-shot
backfill from property_details.listing_events for pre-trigger history.
Tax reassessment forecast IN · Partial reset (capped growth)
- Current annual tax
- $1,608 · $134/mo
- Projected year-2 tax
- $1,608 · $134/mo
- Expected delta
- $0/yr ($0/mo · -0.0%)
ⓘ Screening estimate from a state-policy table — verify with the county assessor before closing.
Climate risk First Street
- Flood 1/10 Low FEMA zone X (unshaded) · 0% chance over 30 yrs
- Wildfire 2/10 Low
- Heat 2/10 Low 7 d/yr ≥99°F today · 15 d/yr by 30 yrs out
- Wind 2/10 Low
- Air quality 3/10 Moderate 2 unhealthy d/yr today · 3 by 30 yrs out
Nearby sold comps map
Loading sold comps map…
Walkable amenities ~0.75 mi
Loading nearby amenities…
Taxation est. · year 1
- Rental income
- $15,509
- − Mortgage interest
- −$9,243
- − Property taxes
- −$1,608
- − Insurance
- −$825
- − Repairs & maintenance
- −$1,241
- − Management
- −$1,241
- − Depreciation
- −$4,800
- Taxable loss
- −$3,448
- Est. tax savings @ 24.0%
- +$828
- After-tax cash flow
- $263/yr
For passive investors: Depreciation is non-cash, so a rental often shows a tax loss while cash-flowing — sheltering income. Rental losses are passive: they offset passive income freely, and up to $25,000/yr can offset ordinary (W-2) income if you actively participate and your MAGI is under $100k (phasing out to $0 by $150k); unused losses carry forward. On sale, claimed depreciation is recaptured at up to 25%, and gains may owe capital-gains tax (a 1031 exchange can defer both). Figures are a year-1 estimate at your 24.0% rate — not tax advice; consult a CPA.
Schools (NCES district)
- District
- South Bend Community School Corporation
- NCES district ID
- 1810290
- Math proficiency
- 12% ▼ -10.00%
- Reading proficiency
- 21% ▼ -6.00%
- Median HH income
- $41,935
- Composite
- 14.21/100
- National rank
- #9452
- State rank
- #284 of 301 in IN
Livability — South Bend
- Score
- 64/100
- State rank
- #365
- US rank
- #13730
Category grades
Schools grade is shown separately in the Schools card above.
Census & demographics
- Census place
- South Bend, IN
- County
- Saint Joseph County · 189,048 people
- City population
- 99,767
- Metro
- South Bend-Mishawaka, IN-MI
- Population (ZIP)
- 14,190
- Household income
- $62,964
- Rent vs Own
- Severe rent burden
- 420.0
Population outlook (St. Joseph County) Hauer SSP2
- Today (2025)
- 273,186 people
- By 2030
- 273,594 · +0.1%
- By 2040
- 271,641 · -0.6%
- By 2050
- 269,187 · -1.5%
- By 2075
- 263,136 · -3.7%
- By 2100
- 245,659 · -10.1%
Race, ethnicity, and origin ACS 2023
- Neighborhood character
- Predominantly White (65%)
- Race & ethnicity
- White 65% Black 14% Two or more races 11% Hispanic / Latino 10% Asian 3%
- Hispanic origin (detail)
- Mexican 8%
- Common ancestry
- Romanian 6% Italian 2% Serbian 2%
- Foreign-born
- 8% · Canada, Vietnam
- Languages at home
- 87% English-only · Spanish 7% Tagalog/Filipino 1% Other Indo-European 1%
Political lean MEDSL · St. Joseph
- 2024 margin
- Toss-up / Even · D 50.0% · R 48.5% · Other 1.5%
- 2008→2024 swing
- -15.6pp toward R · 2008: 17.1pp · 2024: 1.5pp
- All cycles
- 2024: D+1.5 2020: D+5.8 2016: D+0.2 2012: D+3.5 2008: D+17.1
Not yet ingested
- Civics
- —
Market trends
- HPI YoY
- ▼ -124.82%
- Current HPI
- 242.1938
- Rent YoY
- ▲ 6.27%
- Metro
- South Bend-Mishawaka, IN-MI
- State GDP YoY
- ▲ 2.90%
- F500 in state
- 18
Industry mix (Fortune 500 HQ in IN)
| Industry | F500 HQs | Revenue |
|---|---|---|
| Industrial Machinery | 2 | $37B |
|
||
| Healthcare | 1 | $177B |
|
||
| Pharmaceuticals | 1 | $45B |
|
||
| Metals / Steel | 1 | $18B |
|
||
| Agriculture | 1 | $17B |
|
||
| Packaging | 1 | $12B |
|
||
Price history
+15.3% since first listed6 events — show timeline
- 2026-06-08 Sold (MLS) $170,000 IRMLS
- 2026-05-11 Pending — IRMLS
- 2026-05-05 Listed $165,000 IRMLS
- 2023-11-20 Sold (MLS) $148,000 IRMLS
- 2023-10-07 Pending — IRMLS
- 2023-10-01 Listed $147,500 IRMLS
Property tax history
+6.1%/yrLatest (2025): $1,608 · -5.5% YoY. Source: county tax records.
Cash-flow waterfall
monthlySold comps — $/sqft
last 12 mo · ≤1 miLoading sold comps…