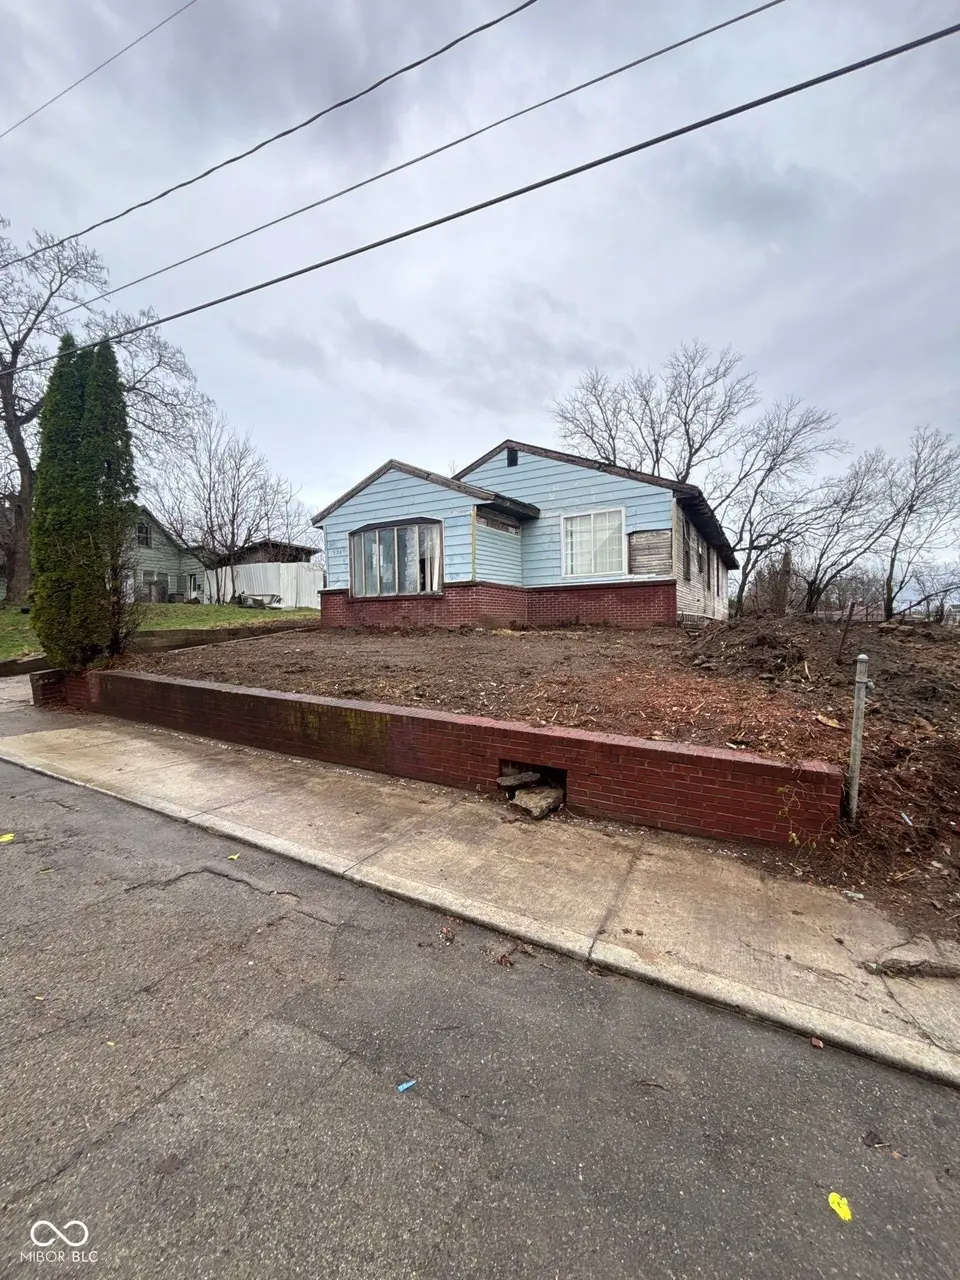
1528 W 20th St · Anderson, IN
Flood risk 1/10 · Minimal
- FEMA flood zone
- X (unshaded)
- Chance of flooding over 30 yrs
- 0.0%
- Est. flood insurance / yr
- $473 – $860
Fire risk 1/10 · Minimal
- Est. fire insurance / yr
- $717 – $1,331
Heat risk 3/10 · Minor
- Hot days now (above 100°F)
- 7 days/yr
- Hot days in 30 yrs
- 18 days/yr
Wind risk 2/10 · Minimal
- Chance of severe wind over 30 yrs
- 0.0%
Air-quality risk 3/10 · Minor
- Unhealthy air days now
- 2 days/yr
- Unhealthy air days in 30 yrs
- 3 days/yr
Risk factors via First Street. Map © Google.
Why this score? — see what drove the B+ grade
The composite is a weighted blend of 9 inputs, each scored 0–100. Each bar is that input's sub-score; the figure is the points it added to the 100-point composite (weight × sub-score).
- Cash flow +30.0/30.0
- ARV discount +15.0/15.0
- 1% rule +10.0/10.0
- DSCR +10.0/10.0
- Rent growth +4.5/5.0
- Livability +3.0/5.0
- Condition / age +2.5/5.0
- Schools +1.6/10.0
- Appreciation +0.0/10.0
$44,900
🖨 Deal sheet 📄 Offer letter ✓ Due diligence
Listing remarks MLS
FIXER UPPER/INVESTMENT OPPORTUNITY! Basement walls have been repaired and foundation has been repaired/replaced this year. Four additional lots nearby are included!
Key facts
- 6,350 sq ft lot
- Built 1915
- Listed 32 days
Property features AI
Exterior
- Utilities: Public water; Municipal sewer connected; No solid waste service listed
- Home design: Single-family residence; One story
- Construction: Aluminum siding and brick exterior; Block foundation
- Exterior features: Lot under 1/4 acre (approximately 0.15 acres)
Interior
- Kitchen: No appliances included
- Bedrooms: 3 bedrooms (all on main level)
- Bathrooms: 1 full bathroom (main level)
- Heating & cooling: Forced air heating; No central cooling
- Interior features: Attic access; Has basement
- Laundry & utility: Utility room in basement (approx. 25x25)
Neighborhood map
What this means for you Summary
Snapshot
- This is a 3-bed/2.0-bath single-family listed at $45k.
Deal economics
- At list price, monthly cash flow is $555 ($7k/yr) — positive.
- The deal already cash-flows at list — no discount required.
- Meets the 1% rule at list price ($1k rent vs $45k).
- Recommended offer: $44k (3.0% below list) — sets the bar for market timing.
- Cap rate 21.1% vs local median 6.5% in Anderson — top-decile yield for the area; either an underpriced asset or a hidden risk that comps aren't pricing in. Stress-test before assuming the spread holds.
Location & tenants
- Location reads 60/100 on livability (#521 in IN) — a middle-class / working-renter tenant base. Strengths: cost of living A+, housing A+; Watch: schools F, crime D-, amenities F.
- Anderson Community School Corporation (urban): math 15% / reading 23% proficiency, ranked #280 of 301 in IN (top 93%) — low school quality limits family demand, transient renter base, plan for 1-2y turnover; 70% free/reduced lunch — lower-income household profile, screen leases tightly.
- Market conditions: Rents rising fast (+7.9%/yr); 185 active listings in the ZIP; 40 comparable units currently listed for rent nearby; rentals at typical pace (median 24d on market — plan ~3-4 weeks tenant-placement turnaround); 48% of comp listings sitting > 30 days — soft ceiling on asking rent; lower-income renter base — watch delinquency; 184 units permitted in Madison County in 2024 (0 in 5+ unit buildings).
- This rent runs 36% of the median local income ($36k/yr) — at the standard rent-burdened threshold; future hikes will face affordability resistance.
Forward outlook
- Local home prices are declining (-3.0%/yr); year-one equity from $310 of loan paydown is wiped out by about $1k of value loss. Plan a longer hold.
- Madison County population projected at -14% by 2050 — secular population decline; favor cash flow + early exit over multi-decade hold.
- At projected returns (-3.0% appreciation + 7.9% rent growth), your $13k cash investment doubles in ~3 years — after that, you're playing with house money.
Negotiation context
- It's been on market 32 days — a 3% lower offer ($44k) is reasonable based on typical stale-listing flexibility.
- 7 sale attempts since 22y ago with the ask held roughly flat each time — persistent listings suggest the price (not the market) is what's stuck; bring a comps-based counter.
- Current owner paid $10k; list at $45k implies a 351% gain — meaningful room to come down on a strong offer.
Risks & watch-outs
- Watch-outs: built in 1915 — expect roof / HVAC / electrical / plumbing capex.
Questions for the listing agent
- It's been on market 32 days. Have you received any prior offers? Is the seller open to a 3% concession, seller financing, or rate buy-down credit?
- Built in 1915 — when were the roof, HVAC, electrical panel, plumbing, and water heater last replaced?
- Is there a deadline driving the sale (1031 exchange, divorce, estate, relocation)? That informs how much negotiation room exists.
- Schools are F-rated, which usually means shorter tenancies and higher turnover. Who's the typical renter profile here, and what's been the actual vacancy rate?
- Crime grade is D in this area — have there been break-ins, vandalism, or insurance claims at this property in the last 3 years? What carrier currently insures it and at what premium?
- What's the average days-on-market for RENTAL listings here right now (not sales)? A rising rental-DOM trend means longer vacancies and softer asking-rent achievability than the comps imply.
- What's the recent tenant-quality profile in this submarket — average credit score on applications, eviction rate, late-payment / NSF rate, and stable-employment percentage? A property-management company in the area should have these aggregated.
- How much new for-sale + rental construction is in the pipeline within 1–3 miles? Heavy new supply typically softens prices + rents 12–24 months out; constrained supply supports both.
Investment metrics
- 1% rule
- 2.38% ✓
- Cap rate
- 21.12%
- Cash-on-cash
- 52.95%
- DSCR
- 3.36
- GRM
- 3.5
CMA / ARV
- ARV (on-the-fly)
- $72,806
- Comps found
- 12
Show comp detail 12 sales within ~0.75 mi
| Address | Dist | Beds/Ba | Sqft | Sold | Price | $/sf | Match |
|---|---|---|---|---|---|---|---|
| 1805 W 21st St | 0.22mi | 4/1.5 (+1) | 1,225 (-1%) | 15mo | $52,000 | $42 | 69 |
| 1310 W 13th St | 0.48mi | 2/1.0 (-1) | 1,178 (-4%) | 1mo | $62,000 | $53 | 60 |
| 1227 W 9th St | 0.74mi | 3/1.0 | 1,158 (-6%) | 1mo | $84,000 | $73 | 50 |
| 815 W 22nd St | 0.52mi | 3/2.0 | 1,362 (+10%) | 12mo | $129,000 | $95 | 48 |
| 1404 Walton St | 0.54mi | 3/1.0 | 1,090 (-12%) | 8mo | $70,000 | $64 | 45 |
| 1430 W 14th St | 0.39mi | 2/1.0 (-1) | 1,404 (+14%) | 8mo | $141,000 | $100 | 44 |
| 1323 Nelle St | 0.43mi | 3/1.5 | 1,358 (+10%) | 23mo | $120,000 | $88 | 42 |
| 811 W 12th St | 0.69mi | 3/2.0 | 1,155 (-6%) | 21mo | $60,000 | $52 | 40 |
| 416 W 21st St | 0.74mi | 2/1.0 (-1) | 1,296 (+5%) | 12mo | $77,000 | $59 | 39 |
| 1628 Sherman St | 0.55mi | 2/1.0 (-1) | 1,106 (-10%) | 15mo | $55,000 | $50 | 36 |
| 2303 W 25th St | 0.65mi | 3/1.0 | 1,377 (+12%) | 16mo | $69,500 | $50 | 33 |
| 1511 Nichol Ave | 0.46mi | 2/1.0 (-1) | 1,070 (-13%) | 21mo | $63,000 | $59 | 30 |
Match score weights: distance 35% · size 25% · config 20% · recency 20%. Top-matched comps best support the ARV.
Projected returns pro-forma
-3.0% appreciation · 7.88% rent growth · sell at horizon
- IRR
- 56.3%
- Equity multiple
- 3.67×
- Total profit
- $33,561
- Equity at exit
- $6,695
- IRR
- 63.1%
- Equity multiple
- 8.93×
- Total profit
- $99,707
- Equity at exit
- $3,882
Cash invested: $12,572 (down + closing). Projections, not guarantees.
Landlord ↔ Tenant lean methodology
- Overall (STATE)
- 90 Strongly Landlord-Friendly
- State Indiana
- 90 Strongly Landlord-Friendly · R+11
- County
- — inherits STATE
- City
- — inherits STATE
ZIP-level market 46016
- Home prices YoY
- -3.5%
- Rents YoY
- 7.9%
- Active inventory
- 185
- Price-to-rent
- 3.5×
Monthly cashflow live
- Estimated rent
- $1,068 high interval (Pro) →
- Mortgage (P&I)
- −$235
- Tax from tax record
- −$35 /mo · $416/yr
- Insurance
- −$19
- HOA
- −$0
- Vacancy / Maint / Mgmt
- −$224
- Net cashflow
- $555
Break-even live
UW: 25.0% down · 7.5% · 30yr · 1.5% tax · 5.0% vac · 8.0% maint · 8.0% mgmt
Financing live
Cash to close
- Down payment
- $11,225
- Closing costs
- $1,347
- Reserves months
- —
- Total cash needed
- —
Loan-product check · same deal, 3 products live
Conventional
25% down · 7.5% · 30yr
- Down + closing
- —
- Monthly P&I
- —
- Monthly cashflow
- —
- DSCR
- —
- Eligible?
- —
Personal DTI + credit; lowest rate.
DSCR
20% down · 8.5% · 30yr
- Down + closing
- —
- Monthly P&I
- —
- Monthly cashflow
- —
- DSCR
- —
- Eligible?
- —
No personal income docs; deal must DSCR.
Hard money
10% down · 12.0% · 12mo
- Down + closing
- —
- Monthly P&I
- —
- Monthly cashflow
- —
- DSCR
- —
- Eligible?
- —
Short-term bridge; refi at stabilization.
Rent comps 40 comps
| Address | Beds | Baths | Sqft | Rent | $/sqft | DOM | Units | Dist |
|---|---|---|---|---|---|---|---|---|
| 2004 Arrow Ave Anderson, IN | 2.0 | 1.0 | 816 | $1,125 | $1.38 | 23d | 1 | 0.14mi |
| 1640 W 17th St Anderson, IN | 2.0 | 1.0 | 810 | $895 | $1.10 | 20d | 1 | 0.17mi |
| 1720 Nelle St Anderson, IN | 2.0 | 1.0 | 768 | $1,100 | $1.43 | 23d | 1 | 0.21mi |
| 1616 W 16th St Anderson, IN | 2.0 | 1.0 | 1038 | $1,050 | $1.01 | 43d | 1 | 0.21mi |
| 1502 Cedar St Anderson, IN | 2.0 | 1.0 | 1104 | $850 | $0.77 | 43d | 1 | 0.42mi |
| 1310 W 13th St Anderson, IN | 2.0 | 1.0 | 1178 | $895 | $0.76 | 2d | 1 | 0.45mi |
| 1532 Walton St Anderson, IN | 3.0 | 1.0 | 1342 | $1,100 | $0.82 | 43d | 1 | 0.48mi |
| 1404 Walton St Anderson, IN | 3.0 | 1.0 | 1090 | $995 | $0.91 | 43d | 1 | 0.53mi |
| 1222 Nichol Ave Unit 4 Anderson, IN | 3.0 | 1.0 | 1000 | $1,135 | $1.14 | 7d | 1 | 0.53mi |
| 2411 Hendricks St Anderson, IN | 3.0 | 1.0 | 860 | $1,000 | $1.16 | 23d | 1 | 0.55mi |
| 1123 Louise St Anderson, IN | 2.0 | 1.0 | 850 | $850 | $1.00 | 43d | 1 | 0.56mi |
| 1136 Irving Way Anderson, IN | 2.0 | 1.0 | 900 | $895 | $0.99 | 21d | 1 | 0.57mi |
| 2301 Sheridan St Anderson, IN | 2.0 | 1.0 | 900 | $950 | $1.06 | 43d | 1 | 0.60mi |
| 2613 Louise St Anderson, IN | 2.0 | 1.0 | 1096 | $950 | $0.87 | 21d | 1 | 0.60mi |
| 618 W 22nd St Anderson, IN | 3.0 | 1.0 | 900 | $1,250 | $1.39 | 43d | 1 | 0.61mi |
| 2233 Fairview St Anderson, IN | 3.0 | 1.5 | 1452 | $1,195 | $0.82 | 23d | 1 | 0.65mi |
| 2719 Dewey St Anderson, IN | 2.0 | 1.0 | 877 | $1,150 | $1.31 | 43d | 1 | 0.72mi |
| 2203 W 28th St Anderson, IN | 3.0 | 1.0 | 1068 | $1,000 | $0.94 | 43d | 1 | 0.78mi |
| 2705 Horton Dr Anderson, IN | 3.0 | 1.0 | 936 | $1,050 | $1.12 | 20d | 1 | 0.79mi |
| 2442 Morton St Anderson, IN | 2.0 | 1.0 | 862 | $1,125 | $1.31 | 23d | 1 | 0.80mi |
| 1631 W 7th St Anderson, IN | 3.0 | 1.0 | 900 | $1,000 | $1.11 | 43d | 1 | 0.82mi |
| 229 W 19th St Anderson, IN | 3.0 | 1.0 | 1200 | $1,000 | $0.83 | 43d | 1 | 0.82mi |
| 1312 W 8th St Unit 1332 F Anderson, IN | 2.0 | 1.0 | 850 | $979 | $1.15 | 43d | 1 | 0.84mi |
| 2324 Chase St Anderson, IN | 2.0 | 1.0 | 783 | $950 | $1.21 | 43d | 1 | 0.87mi |
| 2820 Fairview St Unit A Anderson, IN | 2.0 | 1.0 | 850 | $895 | $1.05 | 43d | 1 | 0.90mi |
| 2627 Chase St Anderson, IN | 3.0 | 1.0 | 1050 | $850 | $0.81 | 17d | 1 | 0.96mi |
| 820 W 7th St Apt A Anderson, IN | 2.0 | 2.0 | 1400 | $1,200 | $0.86 | 23d | 1 | 0.97mi |
| 1212 W 5th St Anderson, IN | 3.0 | 1.0 | 1252 | $1,295 | $1.03 | 12d | 1 | 0.99mi |
| 2904 Lincoln St Anderson, IN | 2.0 | 1.0 | 864 | $900 | $1.04 | 43d | 1 | 1.02mi |
| 120 W 10th St Anderson, IN | 1.0–3.0 | 1.0 | 1066 | $1,150 | $1.08 | 1d | 1 | 1.13mi |
| 1529 W 2nd St Anderson, IN | 3.0 | 1.0 | 884 | $1,200 | $1.36 | 23d | 1 | 1.13mi |
| 1317 Main St Anderson, IN | 2.0 | 1.0 | 750 | $800 | $1.07 | 43d | 1 | 1.16mi |
| 2111 Central Ave Anderson, IN | 3.0 | 1.0 | 1026 | $1,250 | $1.22 | 43d | 1 | 1.17mi |
| 3021 Delaware St Anderson, IN | 2.0 | 1.0 | 1154 | $1,150 | $1.00 | 7d | 1 | 1.19mi |
| 1010 W 2nd St Unit 2 Anderson, IN | 2.0 | 1.0 | 875 | $1,025 | $1.17 | 21d | 1 | 1.22mi |
| 1010 W 2nd St Unit 3 Anderson, IN | 3.0 | 1.0 | 1025 | $1,125 | $1.10 | 14d | 1 | 1.22mi |
| 2625 Main St Anderson, IN | 2.0 | 1.0 | 988 | $895 | $0.91 | 23d | 1 | 1.23mi |
| 1708 Euclid Dr Anderson, IN | 2.0 | 1.0 | 732 | $1,225 | $1.67 | 43d | 1 | 1.24mi |
| 2916 W 12th St Anderson, IN | 3.0 | 1.0 | 1271 | $1,295 | $1.02 | 43d | 1 | 1.27mi |
| 219 E 13th St Anderson, IN | 3.0 | 1.0 | 882 | $1,000 | $1.13 | 4d | 1 | 1.28mi |
Listing history 26 events
-
2026-06-18days on market $44,900 Active 32 DOM
-
2026-06-17days on market $44,900 Active 31 DOM
-
2026-06-16days on market $44,900 Active 30 DOM
-
2026-06-15days on market $44,900 Active 29 DOM
-
2026-06-13days on market $44,900 Active 27 DOM
-
2026-06-09days on market $44,900 Active 23 DOM
-
2026-06-08days on market $44,900 Active 22 DOM
-
2026-06-07days on market $44,900 Active 21 DOM
-
2026-06-05days on market $44,900 Active 18 DOM
-
2026-06-03days on market $44,900 Active 17 DOM
-
2026-06-02days on market $44,900 Active 16 DOM
-
2026-06-01days on market $44,900 Active 15 DOM
-
2026-05-31days on market $44,900 Active 14 DOM
-
2026-05-17$44,900 Active
-
2019-10-25soldstatus $9,950 Sold 164-char remark
Show marketing remark (164 chars)
FIXER UPPER/INVESTMENT OPPORTUNITY! Basement walls have been repaired and foundation has been repaired/replaced this year. Four additional lots nearby are included!
-
2019-10-02$9,950 Active 164-char remark
Show marketing remark (164 chars)
FIXER UPPER/INVESTMENT OPPORTUNITY! Basement walls have been repaired and foundation has been repaired/replaced this year. Four additional lots nearby are included!
-
2006-11-28soldstatus $1,536 450-char remark
Show marketing remark (450 chars)
GREAT INVESTMENT PROPERTY. READY TO BE REPAIRED. HOME IS A BANK-OWNED PROPERTY SOLD IN 'AS-IS' CONDITION. ALL OFFERS ACCOMPANIED BY SIGNED BANK ADDENDUM AND BUYER'S PRE-QUALIFICATION LETTER OR PROOF OF FUNDS. EARNEST MO NEY TO BE AT LEAST 3% OF PURCHASE PRICE...ALL ROOM DIMENSIONS ARE ESTIMATES. SELLER RESERVES THE RIGHT TO CHOOSE PLACE OF SETTLEMENT. SELLER RESERVES THE RIGHT TO ACCEPT THE OFFER OF THEIR CHOICE REGARDLESS OF ORDER RE CEIVED.BB
-
2006-10-01historical
-
2006-08-11$11,900 450-char remark
Show marketing remark (450 chars)
GREAT INVESTMENT PROPERTY. READY TO BE REPAIRED. HOME IS A BANK-OWNED PROPERTY SOLD IN 'AS-IS' CONDITION. ALL OFFERS ACCOMPANIED BY SIGNED BANK ADDENDUM AND BUYER'S PRE-QUALIFICATION LETTER OR PROOF OF FUNDS. EARNEST MO NEY TO BE AT LEAST 3% OF PURCHASE PRICE...ALL ROOM DIMENSIONS ARE ESTIMATES. SELLER RESERVES THE RIGHT TO CHOOSE PLACE OF SETTLEMENT. SELLER RESERVES THE RIGHT TO ACCEPT THE OFFER OF THEIR CHOICE REGARDLESS OF ORDER RE CEIVED.BB
-
2006-03-14historical
-
2006-02-17$14,900
-
2005-09-15$14,900
-
2005-08-09historical
-
2005-01-26$17,900
-
2004-12-09historical
-
2004-10-14$19,900
ⓘ Source: listings_history table (triggers on properties + properties_extension) + one-shot
backfill from property_details.listing_events for pre-trigger history.
Tax reassessment forecast IN · Partial reset (capped growth)
- Current annual tax
- $416 · $35/mo
- Projected year-2 tax
- $416 · $35/mo
- Expected delta
- $0/yr ($0/mo · 0.0%)
ⓘ Screening estimate from a state-policy table — verify with the county assessor before closing.
Climate risk First Street
- Flood 1/10 Low FEMA zone X (unshaded) · 0% chance over 30 yrs
- Wildfire 1/10 Low
- Heat 3/10 Moderate 7 d/yr ≥100°F today · 18 d/yr by 30 yrs out
- Wind 2/10 Low 0% chance of damaging wind over 30 yrs
- Air quality 3/10 Moderate 2 unhealthy d/yr today · 3 by 30 yrs out
Nearby sold comps map
Loading sold comps map…
Walkable amenities ~0.75 mi
Loading nearby amenities…
Taxation est. · year 1
- Rental income
- $12,813
- − Mortgage interest
- −$2,515
- − Property taxes
- −$416
- − Insurance
- −$224
- − Repairs & maintenance
- −$1,025
- − Management
- −$1,025
- − Depreciation
- −$1,306
- Taxable income
- $6,302
- Est. tax owed @ 24.0%
- −$1,512
- After-tax cash flow
- $5,145/yr
For passive investors: Depreciation is non-cash, so a rental often shows a tax loss while cash-flowing — sheltering income. Rental losses are passive: they offset passive income freely, and up to $25,000/yr can offset ordinary (W-2) income if you actively participate and your MAGI is under $100k (phasing out to $0 by $150k); unused losses carry forward. On sale, claimed depreciation is recaptured at up to 25%, and gains may owe capital-gains tax (a 1031 exchange can defer both). Figures are a year-1 estimate at your 24.0% rate — not tax advice; consult a CPA.
Schools (NCES district)
- District
- Anderson Community School Corporation
- NCES district ID
- 1800150
- Math proficiency
- 15% ▼ -14.00%
- Reading proficiency
- 23% ▼ -7.00%
- Median HH income
- $38,208
- Composite
- 15.93/100
- National rank
- #9250
- State rank
- #280 of 301 in IN
Livability — Anderson
- Score
- 60/100
- State rank
- #521
- US rank
- #18709
Category grades
Schools grade is shown separately in the Schools card above.
Census & demographics
- Census place
- Anderson, IN
- County
- Madison County · 69,445 people
- City population
- 57,762
- Metro
- Indianapolis-Carmel-Anderson, IN
- Population (ZIP)
- 17,834
- Household income
- $36,029
- Rent vs Own
- Severe rent burden
- 1193.0
Population outlook (Madison County) Hauer SSP2
- Today (2025)
- 125,800 people
- By 2030
- 122,640 · -2.5%
- By 2040
- 115,420 · -8.3%
- By 2050
- 108,148 · -14.0%
- By 2075
- 91,838 · -27.0%
- By 2100
- 75,670 · -39.8%
Race, ethnicity, and origin ACS 2023
- Neighborhood character
- Diverse neighborhood (Simpson 0.58)
- Race & ethnicity
- White 61% Black 18% Hispanic / Latino 13% Two or more races 11% Native American 1%
- Hispanic origin (detail)
- Mexican 10% Puerto Rican 1%
- Common ancestry
- Italian 2% Slovak 1% Iranian 1%
- Foreign-born
- 4% · Canada
- Languages at home
- 86% English-only · Spanish 12%
Political lean MEDSL · Madison
- 2024 margin
- Strong R (+26.9) · D 35.6% · R 62.5% · Other 1.9%
- 2008→2024 swing
- -33.5pp toward R · 2008: 6.5pp · 2024: -26.9pp
- All cycles
- 2024: R+26.9 2020: R+22.6 2016: R+25.7 2012: R+4.5 2008: D+6.5
Not yet ingested
- Civics
- —
Market trends
- HPI YoY
- ▼ -11.12%
- Current HPI
- 302.7437
- Rent YoY
- ▲ 7.88%
- Metro
- Indianapolis-Carmel-Anderson, IN
- State GDP YoY
- ▲ 2.90%
- F500 in state
- 18
Industry mix (Fortune 500 HQ in IN)
| Industry | F500 HQs | Revenue |
|---|---|---|
| Industrial Machinery | 2 | $37B |
|
||
| Healthcare | 1 | $177B |
|
||
| Pharmaceuticals | 1 | $45B |
|
||
| Metals / Steel | 1 | $18B |
|
||
| Agriculture | 1 | $17B |
|
||
| Packaging | 1 | $12B |
|
||
Price history
+125.6% since first listed13 events — show timeline
- 2026-05-17 Listed $44,900 MIBOR as Distributed by MLS Grid
- 2019-10-25 Sold (MLS) $9,950 MIBOR as Distributed by MLS Grid
- 2019-10-02 Listed $9,950 MIBOR as Distributed by MLS Grid
- 2006-11-28 Sold (MLS) $1,536 MIBOR as Distributed by MLS Grid
- 2006-10-01 Listing Removed — MIBOR as Distributed by MLS Grid
- 2006-08-11 Listed $11,900 MIBOR as Distributed by MLS Grid
- 2006-03-14 Listing Removed — MIBOR as Distributed by MLS Grid
- 2006-02-17 Listed $14,900 MIBOR as Distributed by MLS Grid
- 2005-09-15 Listed $14,900 MIBOR as Distributed by MLS Grid
- 2005-08-09 Listing Removed — MIBOR as Distributed by MLS Grid
- 2005-01-26 Listed $17,900 MIBOR as Distributed by MLS Grid
- 2004-12-09 Listing Removed — MIBOR as Distributed by MLS Grid
- 2004-10-14 Listed $19,900 MIBOR as Distributed by MLS Grid
Property tax history
-4.3%/yrLatest (2024): $416 · +7.4% YoY. Source: county tax records.
Cash-flow waterfall
monthlySold comps — $/sqft
last 12 mo · ≤1 miLoading sold comps…