 🌊 Lakefront
550 Captn Kate Ct #22 · Naples Park, FL
Flood risk 8/10 · Major
- FEMA flood zone
- X (shaded)
- Chance of flooding over 30 yrs
- 0.96%
- Est. flood insurance / yr
- $507 – $1,088
Fire risk 1/10 · Minimal
- Est. fire insurance / yr
- $947 – $1,759
Heat risk 10/10 · Severe
- Hot days now (above 107°F)
- 6 days/yr
- Hot days in 30 yrs
- 26 days/yr
Wind risk 10/10 · Severe
- Chance of severe wind over 30 yrs
- 99.0%
Air-quality risk 2/10 · Minimal
- Unhealthy air days now
- 1 days/yr
- Unhealthy air days in 30 yrs
- 1 days/yr
Risk factors via First Street. Map © Google.
Why this score? — see what drove the D grade
The composite is a weighted blend of 9 inputs, each scored 0–100. Each bar is that input's sub-score; the figure is the points it added to the 100-point composite (weight × sub-score).
- Cash flow +12.5/30.0
- ARV discount +7.5/15.0
- Schools +5.0/10.0
- DSCR +3.7/10.0
- 1% rule +3.5/10.0
- Livability +3.2/5.0
- Condition / age +2.5/5.0
- Rent growth +2.2/5.0
- Appreciation +0.0/10.0
$695,000
🖨 Deal sheet (PDF) 📄 Offer letter ✓ Due diligence
Listing remarks MLS
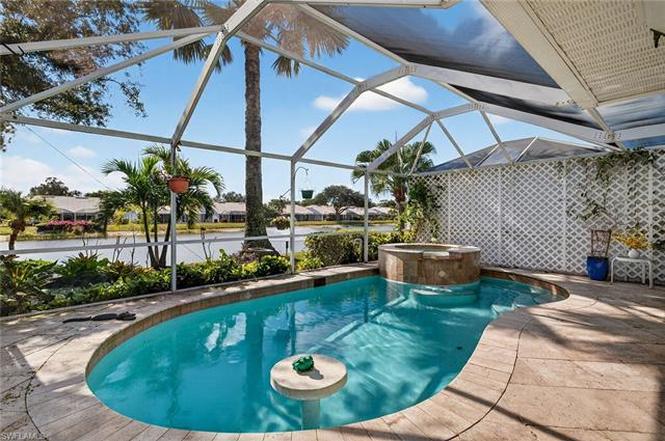
V. 1519 - Like new. Wonderful southern exposure in this 3/2 villa home with 2 car garage and private pool. Light & bright with large tile flooring in Kitchen, great room & 3rd bedroom and new designer carpet in master & 2nd guest bedroom. 3rd bedroom is perfect as a den/office too. Private sparkling pool has new heater and beautiful lanscaping makes this a great buy. Have peace of mind because this home has Electric Hurricane Shutters for storm protection & extra security when away. Easy walk or bike to the beach, less than a mile. Close to everything but quiet lakefront location. Oversized attached 2 car garage. Mr & Mrs clean vacationed here and have meticulously maintained this home. Satelite dish too! A must see.
Key facts
- Southern exposure
- Beautiful lake view
- Fountain
Tags
Property features AI
Finance
- Other: Property is part of a complex with 55 units (2 units per building); Possession at closing
- HOA & community: Mandatory HOA; Quarterly HOA fee of $1,250; Annual recurring HOA fees total $5,000; One-time fees total $125; Professional management; HOA covers lawn/land maintenance, legal/accounting, manager, security, and street maintenance; Community amenities include a community pool, sidewalks, streetlights, and underground utilities; Gated community
Exterior
- Parking: Attached 2-car garage; Driveway with paved parking for 2+ vehicles
- Security: Gated community; Secured garage
- Utilities: Central water; Central sewer; Cable available
- Home design: Residential attached villa; 1-story ranch, end-unit; Traditional style; Rear exposure faces south; Part of Northshore Lake Villas development; Lakefront setting with landscaped and water feature views
- Construction: Concrete block construction; Tile roof; Built in 1999; Foundation information not provided
- Exterior features: Privacy wall; Automatic sprinkler system; Water feature; Screened private pool (below ground) with equipment staying; Screened private spa with equipment staying; Stucco exterior; Single-hung windows; Electric shutters; Garage secured; Gated community
Interior
- Kitchen: Range; Microwave; Dishwasher; Disposal
- Bedrooms: 3 bedrooms; First-floor bedroom; Master bedroom on ground level
- Flooring: Carpet; Tile
- Bathrooms: 2 full bathrooms; Master bath with shower only
- Heating & cooling: Central electric heat; Central electric cooling; Ceiling fans
- Interior features: Custom mirrors; Foyer; Smoke detectors; Vaulted ceiling; Window coverings; Split bedroom floor plan; 6 rooms total; Guest bath; Screened lanai/porch
- Laundry & utility: Washer and dryer included; Washer/dryer hookup; Laundry in residence; Generator; Auto garage door
Neighborhood map
What this means for you Summary
Snapshot
- This is a 3-bed/2.0-bath condo listed at $695k.
Deal economics
- At list price, monthly cash flow is $-174 ($-2k/yr) — negative.
- To cash-flow at today's rent, offer at most $664k (4.4% below list).
- To meet the 1% rule (rent ≥ 1% of price), the offer needs to be $593k (14.7% below list).
- Recommended offer: $593k (14.7% below list) — sets the bar for 1% rule.
Location & tenants
- Location reads 64/100 on livability (#696 in FL) — a middle-class / working-renter tenant base. Strengths: crime A+, housing A-, employment B+; Watch: health & safety D, amenities F, commute F.
- Collier (suburban): math 60% / reading 56% proficiency, ranked #16 of 73 in FL (top 22%) — acceptable for families but not a draw, mixed tenant base, ~2y average lease.
- Zoned schools: Naples Park Elementary School (math 67% / reading 57%, grade B, #608 of 2,144 statewide, top 29%, 395 students, 48% FRL); North Naples Middle School (math 79% / reading 73%, grade A, #34 of 571 statewide, top 6%, 903 students, 25% FRL); Gulf Coast High School (math 57% / reading 68%, grade B-, #93 of 667 statewide, top 14%, 2,447 students, 20% FRL) — zoned schools average 31% FRL vs 55% district-wide (24 pts lower); this property's tenant base skews higher-income than the district average.
- Market conditions: Rents soft (-1.1%/yr); 593 active listings in the ZIP; 40 comparable units currently listed for rent nearby; rentals at typical pace (median 25d on market — plan ~3-4 weeks tenant-placement turnaround); solid renter incomes; 3,520 units permitted in Collier County in 2024 (959 in 5+ unit buildings).
- At $5,927/mo this rent would consume 73% of the median local household income ($98k/yr) (locally 1006% of renters already pay >50% of income on rent) — very limited rent-growth headroom before tenants either downsize or default.
Forward outlook
- Local home prices are declining (-3.0%/yr); year-one equity from $5k of loan paydown is wiped out by about $21k of value loss. Plan a longer hold.
- Collier County population projected at +30% by 2050 — long-run rental-demand tailwind backs the buy-and-hold thesis.
Negotiation context
- It's been on market 430 days — a 12% lower offer ($612k) is reasonable based on typical stale-listing flexibility.
- 3 sale attempts since 15y ago; this cycle's ask has dropped $100k (13%) from the opening price — seller is motivated, your offer sets the floor, not the list.
- Current owner paid $310k; list at $695k implies a 124% gain — meaningful room to come down on a strong offer.
Risks & watch-outs
- Watch-outs: flood insurance adds $66/mo.
- Climate carrying-cost: severe flood risk; severe wind risk, 99% chance of damaging wind over 30y; extreme-heat days projected 6→26/yr by 2055 (HVAC capex compounding) — expect insurance premiums to compound above CPI over the hold.
Questions for the listing agent
- What do current leases actually rent for vs. the listed asking? Can we see a recent rent roll and the last 12 months of T-12 income?
- It's been on market 430 days. Have you received any prior offers? Is the seller open to a 15% concession, seller financing, or rate buy-down credit?
- What's the actual annual flood-insurance premium (NFIP or private), and is the property in a SFHA with mandatory coverage?
- What does the HOA fee cover, when was the last increase, and are there any pending special assessments or reserve-fund shortfalls?
- Any open or pending special assessments — roof, HVAC, plumbing, elevator, façade? What's the per-unit balance and payoff schedule, and is the seller paying it off at close or rolling it to the buyer?
- Why hasn't it sold? Are there any deal-killer items the seller is aware of (foundation, flood, title, zoning, code violations)?
- Is there a deadline driving the sale (1031 exchange, divorce, estate, relocation)? That informs how much negotiation room exists.
- Schools are F-rated, which usually means shorter tenancies and higher turnover. Who's the typical renter profile here, and what's been the actual vacancy rate?
- The area grade is low — what's the realistic commute time and amenity access for the typical tenant pool here? Any planned neighborhood developments (good or bad) we should know about?
- This sits on a lake — are riparian / water-frontage rights deeded with the parcel? Any dock permits, shoreline easements, or HOA water-use restrictions?
- What's the documented flood / surge / shoreline-erosion history here (FEMA AND non-FEMA — e.g., storm surge, creek backup, septic-field saturation)?
- Any water-quality or seasonal algae-bloom issues that affect tenant satisfaction or short-term-rental demand?
- What's the average days-on-market for RENTAL listings here right now (not sales)? A rising rental-DOM trend means longer vacancies and softer asking-rent achievability than the comps imply.
- What's the recent tenant-quality profile in this submarket — average credit score on applications, eviction rate, late-payment / NSF rate, and stable-employment percentage? A property-management company in the area should have these aggregated.
- How much new apartment / multifamily construction is in the pipeline within 1–3 miles? Heavy new supply (>2% of stock underway) typically softens rents 12–24 months out; light construction supports rent growth.
Investment metrics
- 1% rule
- 0.85% ✗
- Cap rate
- 6.11%
- Cash-on-cash
- -0.67%
- DSCR
- 0.97
- GRM
- 9.8
CMA / ARV
No comps found within radius.
Projected returns pro-forma
-3.0% appreciation · 0.0% rent growth · sell at horizon
- IRR
- -21.5%
- Equity multiple
- 0.28×
- Total profit
- $-140,978
- Equity at exit
- $103,627
- IRR
- -24.7%
- Equity multiple
- -0.05×
- Total profit
- $-203,698
- Equity at exit
- $60,091
Cash invested: $194,600 (down + closing). Projections, not guarantees.
Landlord ↔ Tenant lean methodology
- Overall (STATE)
- 87 Strongly Landlord-Friendly
- State Florida
- 87 Strongly Landlord-Friendly · R+3
- County
- — inherits STATE
- City
- — inherits STATE
ZIP-level market 34110
- Rents YoY
- -1.1%
- Active inventory
- 593
- Price-to-rent
- 9.8×
Monthly cashflow live
- Estimated rent
- $5,927 high interval (Pro) →
- Mortgage (P&I)
- −$3,645
- Tax from tax record
- −$439 /mo · $5,270/yr
- Insurance
- −$290
- Flood insurance flood zone
- −$66 /mo · $798/yr
- HOA
- −$417
- Vacancy / Maint / Mgmt
- −$1,245
- Net cashflow
- $-174
Break-even live
Sensitivity live
| Price | -10% $219 | -5% $22 | +0% $-174 | +5% $-371 | +10% $-568 |
|---|---|---|---|---|---|
| Rent | -10% $-643 | -5% $-409 | +0% $-174 | +5% $60 | +10% $294 |
| Rate | -1.0pp $176 | -0.5pp $2 | base $-174 | +0.5pp $-355 | +1.0pp $-538 |
UW: 25.0% down · 7.5% · 30yr · 1.5% tax · 5.0% vac · 8.0% maint · 8.0% mgmt
Financing live
Cash to close
- Down payment
- $173,750
- Closing costs
- $20,850
- Reserves months
- —
- Total cash needed
- —
Loan-product check · same deal, 3 products live
Conventional
25% down · 7.5% · 30yr
- Down + closing
- —
- Monthly P&I
- —
- Monthly cashflow
- —
- DSCR
- —
- Eligible?
- —
Personal DTI + credit; lowest rate.
DSCR
20% down · 8.5% · 30yr
- Down + closing
- —
- Monthly P&I
- —
- Monthly cashflow
- —
- DSCR
- —
- Eligible?
- —
No personal income docs; deal must DSCR.
Hard money
10% down · 12.0% · 12mo
- Down + closing
- —
- Monthly P&I
- —
- Monthly cashflow
- —
- DSCR
- —
- Eligible?
- —
Short-term bridge; refi at stabilization.
Rent comps 40 comps
| Address | Beds | Baths | Sqft | Rent | $/sqft | DOM | Units | Dist |
|---|---|---|---|---|---|---|---|---|
| 519 Roma Ct Naples, FL | 3.0 | 2.0 | 1260 | $4,450 | $3.53 | 15d | 6 | 0.07mi |
| 509 Roma Ct Naples, FL | 3.0 | 2.0 | 1322 | $3,850 | $2.91 | 25d | 3 | 0.10mi |
| 602 111th Ave N Naples, FL | 2.0 | 2.0 | 1104 | $4,000 | $3.62 | 25d | 1 | 0.37mi |
| 527 109th Ave N Naples, FL | 2.0 | 2.0 | 990 | $2,750 | $2.78 | 25d | 1 | 0.43mi |
| 564 109th Ave N Naples, FL | 2.0 | 2.0 | 1080 | $16,000 | $14.81 | 25d | 1 | 0.46mi |
| 530 108th Ave N Naples, FL | 3.0 | 2.0 | 1350 | $15,000 | $11.11 | 25d | 1 | 0.52mi |
| 699 110th Ave N Unit A Naples, FL | 2.0 | 1.0 | 1000 | $2,150 | $2.15 | 25d | 1 | 0.53mi |
| 699 110th Ave N Unit B Naples, FL | 2.0 | 2.0 | 910 | $2,250 | $2.47 | 25d | 1 | 0.53mi |
| 706 111th Ave N Naples, FL | 2.0 | 2.0 | 1080 | $1,850 | $1.71 | 25d | 1 | 0.54mi |
| 17 Bluebill Ave #1102 Naples, FL | 2.0 | 2.0 | 1300 | $9,000 | $6.92 | 25d | 1 | 0.54mi |
| 17 Bluebill Ave #904 Naples, FL | 2.0 | 2.0 | 1214 | $8,000 | $6.59 | 25d | 1 | 0.54mi |
| 17 Bluebill Ave #903 Naples, FL | 2.0 | 2.0 | 1214 | $17,250 | $14.21 | 25d | 1 | 0.54mi |
| 25 Bluebill Ave #403 Naples, FL | 3.0 | 2.0 | 1613 | $8,000 | $4.96 | 15d | 1 | 0.55mi |
| 25 Bluebill Ave #1002 Naples, FL | 3.0 | 2.0 | 1613 | $9,000 | $5.58 | 25d | 1 | 0.55mi |
| 25 Bluebill Ave #1103 Naples, FL | 3.0 | 2.0 | 1613 | $9,500 | $5.89 | 25d | 1 | 0.55mi |
| 25 Bluebill Ave Unit A201 Naples, FL | 2.0 | 2.0 | 1506 | $4,500 | $2.99 | 15d | 1 | 0.55mi |
| 25 Bluebill Ave Unit 1263821P Naples, FL | 2.0 | 2.0 | 1485 | $5,079 | $3.42 | 22d | 1 | 0.55mi |
| 25 Bluebill Ave #301 Naples, FL | 2.0 | 2.0 | 1506 | $8,000 | $5.31 | 15d | 1 | 0.55mi |
| 21 Bluebill Ave #302 Naples, FL | 3.0 | 2.0 | 1613 | $10,500 | $6.51 | 22d | 1 | 0.57mi |
| 21 Bluebill Ave Unit B401 Naples, FL | 2.0 | 2.0 | 1804 | $8,000 | $4.43 | 15d | 1 | 0.57mi |
| 21 Bluebill Ave Unit B-303 Naples, FL | 3.0 | 2.0 | 1613 | $9,500 | $5.89 | 15d | 1 | 0.57mi |
| 35 Bluebill Ave Unit B-702 Naples, FL | 3.0 | 2.0 | 1626 | $9,000 | $5.54 | 15d | 1 | 0.59mi |
| 15 Bluebill Ave #805 Naples, FL | 2.0 | 2.0 | 1525 | $8,500 | $5.57 | 25d | 1 | 0.60mi |
| 15 Bluebill Ave Unit 103AA Naples, FL | 2.0 | 2.0 | 1569 | $2,995 | $1.91 | 25d | 1 | 0.60mi |
| 15 Bluebill Ave #406 Naples, FL | 2.0 | 2.0 | 1525 | $10,000 | $6.56 | 25d | 1 | 0.60mi |
| 15 Bluebill Ave Unit 103s Naples, FL | 2.0 | 2.0 | 1569 | $7,500 | $4.78 | 25d | 1 | 0.60mi |
| 15 Bluebill Ave #205 Naples, FL | 2.0 | 2.0 | 1525 | $7,900 | $5.18 | 25d | 1 | 0.60mi |
| 15 Bluebill Ave Unit 103AA Naples, FL | 2.0 | 2.0 | 1569 | $2,995 | $1.91 | 22d | 1 | 0.60mi |
| 15 Bluebill Ave #206 Naples, FL | 2.0 | 2.0 | 1493 | $6,500 | $4.35 | 25d | 1 | 0.60mi |
| 593 106th Ave N Naples, FL | 3.0 | 2.0 | 1800 | $9,000 | $5.00 | 25d | 1 | 0.63mi |
| 669 107th Ave N Unit 1504183P Naples, FL | 3.0 | 2.0 | 1614 | $3,571 | $2.21 | 25d | 1 | 0.64mi |
| 673 107th Ave N Naples, FL | 3.0 | 2.0 | 1428 | $3,850 | $2.70 | 25d | 1 | 0.64mi |
| 510 106th Ave N Unit 1387169P Naples, FL | 4.0 | 2.0 | 1646 | $7,553 | $4.59 | 15d | 1 | 0.65mi |
| 5 Bluebill Ave Unit 505/605 Naples, FL | 2.0 | 2.5 | 1035 | $6,500 | $6.28 | 25d | 1 | 0.65mi |
| 5 Bluebill Ave #201 Naples, FL | 3.0 | 2.0 | 1441 | $9,000 | $6.25 | 25d | 1 | 0.65mi |
| 5 Bluebill Ave Unit 305-405 Naples, FL | 2.0 | 2.5 | 1133 | $3,495 | $3.08 | 25d | 1 | 0.65mi |
| 5 Bluebill Ave #209 Naples, FL | 2.0 | 2.0 | 1076 | $8,500 | $7.90 | 25d | 1 | 0.65mi |
| 5 Bluebill Ave #403 Naples, FL | 2.0 | 2.0 | 1086 | $8,500 | $7.83 | 22d | 1 | 0.65mi |
| 5 Bluebill Ave Unit 303-1 Naples, FL | 2.0 | 2.0 | 1068 | $6,500 | $6.09 | 25d | 1 | 0.65mi |
| 5 Bluebill Ave #301 Naples, FL | 3.0 | 2.0 | 1494 | $7,500 | $5.02 | 25d | 1 | 0.65mi |
HOA detail condo
- Monthly dues
- $417 · $5,004/yr
- Likely covers
- electricpoolsecurity
- Assessments
- None detected in remarks — confirm with the listing agent.
Listing history 22 events
-
2026-06-22days on market $695,000 Active 430 DOM
-
2026-06-18days on market $695,000 Active 427 DOM
-
2026-06-17days on market $695,000 Active 426 DOM
-
2026-06-16days on market $695,000 Active 425 DOM
-
2026-06-15days on market $695,000 Active 424 DOM
-
2026-06-10days on market $695,000 Active 419 DOM
-
2026-06-09days on market $695,000 Active 418 DOM
-
2026-06-08days on market $695,000 Active 417 DOM
-
2026-06-07days on market $695,000 Active 416 DOM
-
2026-06-02days on market $695,000 Active 411 DOM
-
2026-06-01days on market $695,000 Active 410 DOM
-
2026-05-31days on market $695,000 Active 409 DOM
-
2026-05-30days on market $695,000 Active 408 DOM
-
2025-11-07price $695,000
-
2025-10-22price $729,000
-
2025-10-09status Active
-
2025-06-06historical
-
2025-02-20price $759,000
-
2024-12-13$795,000 Active
-
2011-07-05soldstatus $310,000
-
2011-06-30soldstatus $310,000 756-char remark
Show marketing remark (756 chars)
V. 1519 - Like new. Wonderful southern exposure in this 3/2 villa home with 2 car garage and private pool. Light & bright with large tile flooring in Kitchen, great room & 3rd bedroom and new designer carpet in master & 2nd guest bedroom. 3rd bedroom is perfect as a den/office too. Private sparkling pool has new heater and beautiful lanscaping makes this a great buy. Have peace of mind because this home has Electric Hurricane Shutters for storm protection & extra security when away. Easy walk or bike to the beach, less than a mile. Close to everything but quiet lakefront location. Oversized attached 2 car garage. Mr & Mrs clean vacationed here and have meticulously maintained this home. Satelite dish too! A must see.
-
2011-02-23$319,000 756-char remark
Show marketing remark (756 chars)
V. 1519 - Like new. Wonderful southern exposure in this 3/2 villa home with 2 car garage and private pool. Light & bright with large tile flooring in Kitchen, great room & 3rd bedroom and new designer carpet in master & 2nd guest bedroom. 3rd bedroom is perfect as a den/office too. Private sparkling pool has new heater and beautiful lanscaping makes this a great buy. Have peace of mind because this home has Electric Hurricane Shutters for storm protection & extra security when away. Easy walk or bike to the beach, less than a mile. Close to everything but quiet lakefront location. Oversized attached 2 car garage. Mr & Mrs clean vacationed here and have meticulously maintained this home. Satelite dish too! A must see.
ⓘ Source: listings_history table (triggers on properties + properties_extension) + one-shot
backfill from property_details.listing_events for pre-trigger history.
Tax reassessment forecast FL · Resets to sale price
- Current annual tax
- $5,270 · $439/mo
- Projected year-2 tax
- $5,768 · $481/mo
- Expected delta
- +$499/yr (+$42/mo · 9.5%)
ⓘ Screening estimate from a state-policy table — verify with the county assessor before closing.
Climate risk First Street
- Flood 8/10 Severe FEMA zone X (shaded) · 96% chance over 30 yrs
- Wildfire 1/10 Low
- Heat 10/10 Extreme 6 d/yr ≥107°F today · 26 d/yr by 30 yrs out
- Wind 10/10 Extreme 99% chance of damaging wind over 30 yrs
- Air quality 2/10 Low 1 unhealthy d/yr today · 1 by 30 yrs out
Nearby sold comps map
Loading sold comps map…
Walkable amenities ~0.75 mi
Loading nearby amenities…
Taxation est. · year 1
- Rental income
- $71,125
- − Mortgage interest
- −$38,931
- − Property taxes
- −$5,270
- − Insurance
- −$4,272
- − Repairs & maintenance
- −$5,690
- − Management
- −$5,690
- − HOA
- −$5,004
- − Depreciation
- −$20,218
- Taxable loss
- −$13,950
- Est. tax savings @ 24.0%
- +$3,348
- After-tax cash flow
- $1,255/yr
For passive investors: Depreciation is non-cash, so a rental often shows a tax loss while cash-flowing — sheltering income. Rental losses are passive: they offset passive income freely, and up to $25,000/yr can offset ordinary (W-2) income if you actively participate and your MAGI is under $100k (phasing out to $0 by $150k); unused losses carry forward. On sale, claimed depreciation is recaptured at up to 25%, and gains may owe capital-gains tax (a 1031 exchange can defer both). Figures are a year-1 estimate at your 24.0% rate — not tax advice; consult a CPA.
Schools (NCES district)
- District
- Collier
- NCES district ID
- 1200330
- Math proficiency
- 60% ▼ -4.00%
- Reading proficiency
- 56% ▼ -2.00%
- Median HH income
- $58,275
- Composite
- 50.23/100
- National rank
- #1892
- State rank
- #16 of 73 in FL
Livability — Naples Park
- Score
- 64/100
- State rank
- #696
- US rank
- #14564
Category grades
Schools grade is shown separately in the Schools card above.
Census & demographics
- County
- Collier County · 396,295 people
- Metro
- Naples-Marco Island, FL
- Population (ZIP)
- 25,630
- Household income
- $97,564
- Rent vs Own
- Severe rent burden
- 1006.0
Population outlook (Collier County) Hauer SSP2
- Today (2025)
- 420,858 people
- By 2030
- 450,054 · +6.9%
- By 2040
- 502,232 · +19.3%
- By 2050
- 544,932 · +29.5%
- By 2075
- 627,203 · +49.0%
- By 2100
- 659,015 · +56.6%
Race, ethnicity, and origin ACS 2023
- Neighborhood character
- Predominantly White (84%)
- Race & ethnicity
- White 84% Hispanic / Latino 10% Two or more races 9% Asian 2% Black 1%
- Hispanic origin (detail)
- Mexican 2% Puerto Rican 1% Cuban 3%
- Common ancestry
- Romanian 4% Lithuanian 3% Slovak 2%
- Foreign-born
- 11% · Canada, South Korea
- Languages at home
- 87% English-only · Spanish 7% Other Indo-European 3% French/Haitian/Cajun 1%
Political lean MEDSL · Collier
- 2024 margin
- Solid R (+33.1) · D 33.1% · R 66.2%
- 2008→2024 swing
- -10.6pp toward R · 2008: -22.5pp · 2024: -33.1pp
- All cycles
- 2024: R+33.1 2020: R+24.7 2016: R+26.0 2012: R+30.1 2008: R+22.5
Not yet ingested
- Civics
- —
Market trends
- HPI YoY
- ▼ -172.68%
- Current HPI
- 267.4644
- Rent YoY
- ▼ -1.06%
- Metro
- Naples-Marco Island, FL
- State GDP YoY
- ▲ 3.28%
- F500 in state
- 36
Industry mix (Fortune 500 HQ in FL)
| Industry | F500 HQs | Revenue |
|---|---|---|
| Industrial Technology | 2 | $29B |
|
||
| Insurance | 2 | $17B |
|
||
| Retail | 1 | $60B |
|
||
| Technology Distribution | 1 | $58B |
|
||
| Homebuilding | 1 | $35B |
|
||
| Technology Manufacturing | 1 | $35B |
|
||
Price history
+117.9% since first listed9 events — show timeline
- 2025-11-07 Price Changed $695,000 NAPLESMLS
- 2025-10-22 Price Changed $729,000 NAPLESMLS
- 2025-10-09 Relisted — NAPLESMLS
- 2025-06-06 Listing Removed — NAPLESMLS
- 2025-02-20 Price Changed $759,000 NAPLESMLS
- 2024-12-13 Listed $795,000 NAPLESMLS
- 2011-07-05 Sold (Public Records) $310,000 Public Records
- 2011-06-30 Sold (MLS) $310,000 NAPLESMLS
- 2011-02-23 Listed $319,000 NAPLESMLS
Property tax history
+4.4%/yrLatest (2025): $5,270 · +47.7% YoY. Source: county tax records.
Cash-flow waterfall
monthlySold comps — $/sqft
last 12 mo · ≤1 miLoading sold comps…