 Multi-family
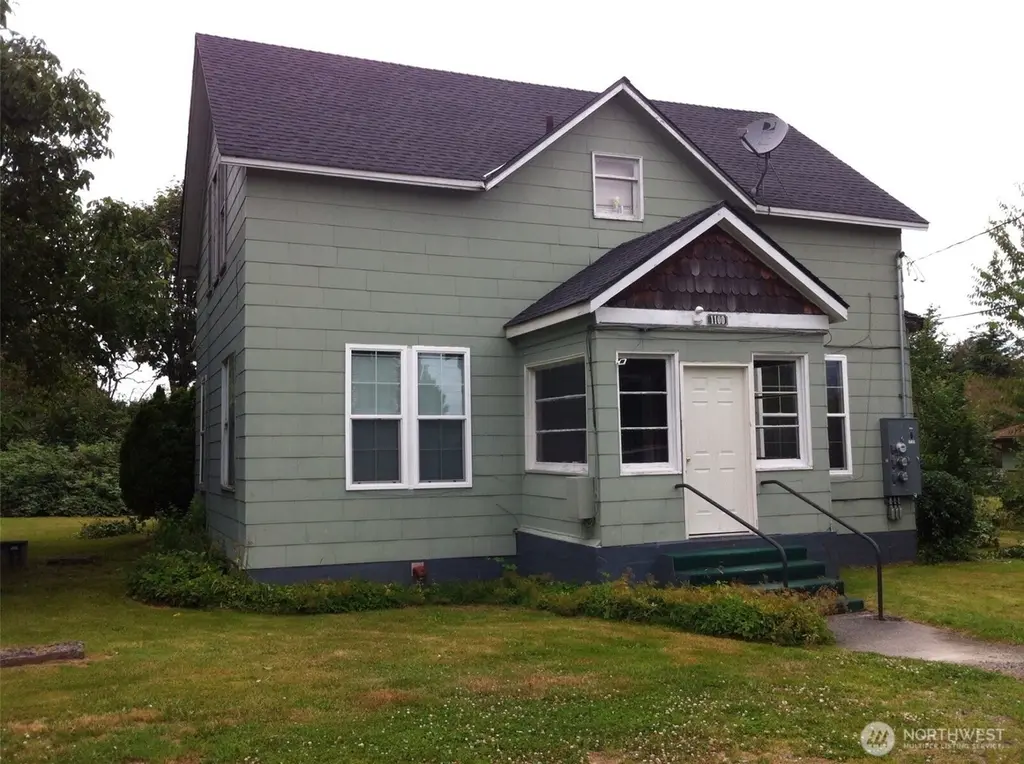
1100 Borseth St · Sedro-Woolley, WA
Flood risk 1/10 · Minimal
- FEMA flood zone
- X
- Chance of flooding over 30 yrs
- 0.0%
- Est. flood insurance / yr
- $507 – $1,088
Fire risk 3/10 · Minor
- Est. fire insurance / yr
- $604 – $1,122
Heat risk 2/10 · Minimal
- Hot days now (above 83°F)
- 7 days/yr
- Hot days in 30 yrs
- 19 days/yr
Wind risk 1/10 · Minimal
- Chance of severe wind over 30 yrs
- —
Air-quality risk 6/10 · Moderate
- Unhealthy air days now
- 9 days/yr
- Unhealthy air days in 30 yrs
- 10 days/yr
Risk factors via First Street. Map © Google.
Why this score? — see what drove the C+ grade
The composite is a weighted blend of 9 inputs, each scored 0–100. Each bar is that input's sub-score; the figure is the points it added to the 100-point composite (weight × sub-score).
- Cash flow +21.5/30.0
- Appreciation +10.0/10.0
- ARV discount +8.1/15.0
- DSCR +6.8/10.0
- 1% rule +4.7/10.0
- Schools +4.7/10.0
- Rent growth +2.5/5.0
- Livability +2.5/5.0
- Condition / age +2.5/5.0
$619,000
🖨 Deal sheet 📄 Offer letter ✓ Due diligence
Multi-family units
County records classify this as Multi-Family (2-4 Unit). Listing-text estimate: 1 unit. estimate disagrees with records
Listing remarks MLS
Development potential awaits on this . 55 acre multi family zoned property in the heart of desirable Sedro Woolley WA. The county says 3 more triplexes may be built here. The current triplex is always fully occupied. New appliances and floor coverings were installed in 2021 including stacked washer/dryers in each unit.
Key facts
- 3 separate units
- Multi family home
- Zoned for tri plexes
Tags
Neighborhood map
What this means for you Summary
Snapshot
- This is a 5-bed/3.0-bath multifamily listed at $619k.
Deal economics
- At list price, monthly cash flow is $924 ($11k/yr) — positive.
- The deal already cash-flows at list — no discount required.
- To meet the 1% rule (rent ≥ 1% of price), the offer needs to be $598k (3.4% below list).
- Recommended offer: $545k (12.0% below list) — sets the bar for market timing.
- Cap rate 8.1% vs local median 2.4% in Sedro-Woolley — top-decile yield for the area; either an underpriced asset or a hidden risk that comps aren't pricing in. Stress-test before assuming the spread holds.
Location & tenants
- Location reads: area grade C — affects rentability + tenant quality, not the cash-flow math above.
- Sedro-Woolley School District (suburban): math 47% / reading 58% proficiency, ranked #117 of 291 in WA (top 40%) — acceptable for families but not a draw, mixed tenant base, ~2y average lease.
- Market conditions: 226 active listings in the ZIP; solid renter incomes; 561 units permitted in Skagit County in 2024 (270 in 5+ unit buildings).
- At $5,982/mo this rent would consume 77% of the median local household income ($93k/yr) (locally 502% of renters already pay >50% of income on rent) — very limited rent-growth headroom before tenants either downsize or default.
Forward outlook
- In year one you build about $66k of equity ($4k loan paydown + $62k appreciation (10.0% local appreciation)).
- Skagit County population projected at +11% by 2050 — modest demand growth; plan on rents tracking national, not racing it.
- At projected returns (10.0% appreciation + 3.0% rent growth), your $173k cash investment doubles in ~3 years — after that, you're playing with house money.
- By year 2, paydown + projected appreciation supports a ~$106k cash-out refi (75% LTV) — recoverable capital for the next deal without selling this one.
Negotiation context
- It's been on market 129 days — a 12% lower offer ($545k) is reasonable based on typical stale-listing flexibility.
- 4 sale attempts since 2y ago with the ask held roughly flat each time — persistent listings suggest the price (not the market) is what's stuck; bring a comps-based counter.
Risks & watch-outs
- Watch-outs: built in 1900 — expect roof / HVAC / electrical / plumbing capex.
Questions for the listing agent
- It's been on market 129 days. Have you received any prior offers? Is the seller open to a 12% concession, seller financing, or rate buy-down credit?
- Built in 1900 — when were the roof, HVAC, electrical panel, plumbing, and water heater last replaced?
- Why hasn't it sold? Are there any deal-killer items the seller is aware of (foundation, flood, title, zoning, code violations)?
- Is there a deadline driving the sale (1031 exchange, divorce, estate, relocation)? That informs how much negotiation room exists.
- What's the average days-on-market for RENTAL listings here right now (not sales)? A rising rental-DOM trend means longer vacancies and softer asking-rent achievability than the comps imply.
- What's the recent tenant-quality profile in this submarket — average credit score on applications, eviction rate, late-payment / NSF rate, and stable-employment percentage? A property-management company in the area should have these aggregated.
- How much new apartment / multifamily construction is in the pipeline within 1–3 miles? Heavy new supply (>2% of stock underway) typically softens rents 12–24 months out; light construction supports rent growth.
Investment metrics
- 1% rule
- 0.97% ✗
- Cap rate
- 8.08%
- Cash-on-cash
- 6.40%
- DSCR
- 1.28
- GRM
- 8.6
CMA / ARV
- ARV (median comp)
- $627,984
- List price
- $619,000
- Delta
- -1.43%
- Verdict
- FAIR
- Comps
- 3 within 1.0 mi
Projected returns pro-forma
10.0% appreciation · 3.0% rent growth · sell at horizon
- IRR
- 28.9%
- Equity multiple
- 3.28×
- Total profit
- $395,783
- Equity at exit
- $557,644
- IRR
- 25.1%
- Equity multiple
- 7.46×
- Total profit
- $1,118,824
- Equity at exit
- $1,202,581
Cash invested: $173,320 (down + closing). Projections, not guarantees.
Landlord ↔ Tenant lean methodology
- Overall (STATE)
- 28 Tenant-Leaning
- State Washington
- 28 Tenant-Leaning · D+8
- County
- — inherits STATE
- City
- — inherits STATE
ZIP-level market 98284
- Home prices YoY
- 3.5%
- Active inventory
- 226
- Price-to-rent
- 24.3×
Monthly cashflow live
- Estimated rent
- $5,982 high interval (Pro) →
- Mortgage (P&I)
- −$3,246
- Tax from tax record
- −$298 /mo · $3,571/yr
- Insurance
- −$258
- HOA
- −$0
- Vacancy / Maint / Mgmt
- −$1,256
- Net cashflow
- $924
Break-even live
3-unit breakdown (identical units grouped — click to expand)
| Units | Beds | Baths | Est. rent |
|---|---|---|---|
| 2× units | 2 | 1 | $4,244 |
| #1 | 2 | 1 | $2,122 |
| #2 | 2 | 1 | $2,122 |
| 1× unit | 1 | 1 | $1,738 |
| Total (3 units) | $5,982 | ||
UW: 25.0% down · 7.5% · 30yr · 1.5% tax · 5.0% vac · 8.0% maint · 8.0% mgmt
Financing live
Cash to close
- Down payment
- $154,750
- Closing costs
- $18,570
- Reserves months
- —
- Total cash needed
- —
Loan-product check · same deal, 3 products live
Conventional
25% down · 7.5% · 30yr
- Down + closing
- —
- Monthly P&I
- —
- Monthly cashflow
- —
- DSCR
- —
- Eligible?
- —
Personal DTI + credit; lowest rate.
DSCR
20% down · 8.5% · 30yr
- Down + closing
- —
- Monthly P&I
- —
- Monthly cashflow
- —
- DSCR
- —
- Eligible?
- —
No personal income docs; deal must DSCR.
Hard money
10% down · 12.0% · 12mo
- Down + closing
- —
- Monthly P&I
- —
- Monthly cashflow
- —
- DSCR
- —
- Eligible?
- —
Short-term bridge; refi at stabilization.
Listing history 22 events
-
2026-06-19days on market $619,000 Active 129 DOM
-
2026-06-18days on market $619,000 Active 128 DOM
-
2026-06-17days on market $619,000 Active 127 DOM
-
2026-06-16days on market $619,000 Active 126 DOM
-
2026-06-15days on market $619,000 Active 125 DOM
-
2026-06-14days on market $619,000 Active 123 DOM
-
2026-06-13days on market $619,000 Active 122 DOM
-
2026-06-10days on market $619,000 Active 120 DOM
-
2026-06-09days on market $619,000 Active 119 DOM
-
2026-06-08days on market $619,000 Active 118 DOM
-
2026-06-07days on market $619,000 Active 117 DOM
-
2026-06-05days on market $619,000 Active 114 DOM
-
2026-06-02days on market $619,000 Active 112 DOM
-
2026-06-01days on market $619,000 Active 111 DOM
-
2026-05-31days on market $619,000 Active 110 DOM
-
2026-05-30days on market $619,000 Active 109 DOM
-
2026-02-10$619,000 Active
-
2026-01-30$619,000 Active 320-char remark
Show marketing remark (320 chars)
Development potential awaits on this . 55 acre multi family zoned property in the heart of desirable Sedro Woolley WA. The county says 3 more triplexes may be built here. The current triplex is always fully occupied. New appliances and floor coverings were installed in 2021 including stacked washer/dryers in each unit.
-
2024-03-14historical $1,500
-
2024-01-18$1,500
-
2024-01-08historical $1,500
-
2024-01-04$1,500
ⓘ Source: listings_history table (triggers on properties + properties_extension) + one-shot
backfill from property_details.listing_events for pre-trigger history.
Tax reassessment forecast WA · Resets to sale price
- Current annual tax
- $3,571 · $298/mo
- Projected year-2 tax
- $6,066 · $506/mo
- Expected delta
- +$2,495/yr (+$208/mo · 69.9%)
ⓘ Screening estimate from a state-policy table — verify with the county assessor before closing.
Climate risk First Street
- Flood 1/10 Low FEMA zone X · 0% chance over 30 yrs
- Wildfire 3/10 Moderate
- Heat 2/10 Low 7 d/yr ≥83°F today · 19 d/yr by 30 yrs out
- Wind 1/10 Low
- Air quality 6/10 Major 9 unhealthy d/yr today · 10 by 30 yrs out
Nearby sold comps map
Loading sold comps map…
Walkable amenities ~0.75 mi
Loading nearby amenities…
Taxation est. · year 1
- Rental income
- $71,784
- − Mortgage interest
- −$34,674
- − Property taxes
- −$3,571
- − Insurance
- −$3,095
- − Repairs & maintenance
- −$5,743
- − Management
- −$5,743
- − Depreciation
- −$18,007
- Taxable income
- $952
- Est. tax owed @ 24.0%
- −$228
- After-tax cash flow
- $10,862/yr
For passive investors: Depreciation is non-cash, so a rental often shows a tax loss while cash-flowing — sheltering income. Rental losses are passive: they offset passive income freely, and up to $25,000/yr can offset ordinary (W-2) income if you actively participate and your MAGI is under $100k (phasing out to $0 by $150k); unused losses carry forward. On sale, claimed depreciation is recaptured at up to 25%, and gains may owe capital-gains tax (a 1031 exchange can defer both). Figures are a year-1 estimate at your 24.0% rate — not tax advice; consult a CPA.
Schools (NCES district)
- District
- Sedro-Woolley School District
- NCES district ID
- 5307740
- Math proficiency
- 47% ▼ -2.00%
- Reading proficiency
- 58% ▬ 0.00%
- Median HH income
- $57,385
- Composite
- 47.45/100
- National rank
- #5005
- State rank
- #117 of 291 in WA
Livability — Sedro-Woolley
No livability data for this city. (Only ~50 U.S. cities are tracked.)
Census & demographics
- Census place
- Sedro-Woolley, WA
- County
- Skagit County · 118,108 people
- Metro
- Mount Vernon-Anacortes, WA
- Population (ZIP)
- 27,835
- Household income
- $93,006
- Rent vs Own
- Severe rent burden
- 502.0
Population outlook (Skagit County) Hauer SSP2
- Today (2025)
- 131,498 people
- By 2030
- 135,556 · +3.1%
- By 2040
- 141,717 · +7.8%
- By 2050
- 145,714 · +10.8%
- By 2075
- 152,201 · +15.7%
- By 2100
- 147,980 · +12.5%
Race, ethnicity, and origin ACS 2023
- Neighborhood character
- Predominantly White (76%)
- Race & ethnicity
- White 76% Hispanic / Latino 14% Two or more races 8% Asian 2% Native American 1%
- Hispanic origin (detail)
- Mexican 12% Puerto Rican 1%
- Common ancestry
- Portuguese 6% Slovak 4% Italian 3%
- Foreign-born
- 5% · Canada, China
- Languages at home
- 88% English-only · Spanish 10% German/W. Germanic 1%
Political lean MEDSL · Skagit
- 2024 margin
- Lean D (+8.9) · D 52.9% · R 44.0% · Other 3.0%
- 2008→2024 swing
- -0.7pp no change · 2008: 9.6pp · 2024: 8.9pp
- All cycles
- 2024: D+8.9 2020: D+7.5 2016: D+3.2 2012: D+5.8 2008: D+9.6
Not yet ingested
- Civics
- —
Market trends
- HPI YoY
- ▲ 43.42%
- Current HPI
- 1280.83
- Rent YoY
- —
- Metro
- Mount Vernon-Anacortes, WA
- State GDP YoY
- ▲ 4.65%
- F500 in state
- 22
Industry mix (Fortune 500 HQ in WA)
| Industry | F500 HQs | Revenue |
|---|---|---|
| Retail | 2 | $269B |
|
||
| Technology / Retail | 1 | $638B |
|
||
| Technology | 1 | $245B |
|
||
| Telecommunications | 1 | $38B |
|
||
| Food / Beverage | 1 | $36B |
|
||
| Automotive / Trucks | 1 | $34B |
|
||
Price history
+41166.7% since first listed6 events — show timeline
- 2026-02-10 Listed $619,000 NWMLS as Distributed by MLS Grid
- 2026-01-30 Listed $619,000 ForSaleByOwner.com
- 2024-03-14 Rental Removed $1,500 APPFOLIO
- 2024-01-18 Listed for Rent $1,500 APPFOLIO
- 2024-01-08 Rental Removed $1,500 APPFOLIO
- 2024-01-04 Listed for Rent $1,500 APPFOLIO
Property tax history
+3.1%/yrLatest (2026): $3,571 · -1.8% YoY. Source: county tax records.
Cash-flow waterfall
monthlySold comps — $/sqft
last 12 mo · ≤1 miLoading sold comps…