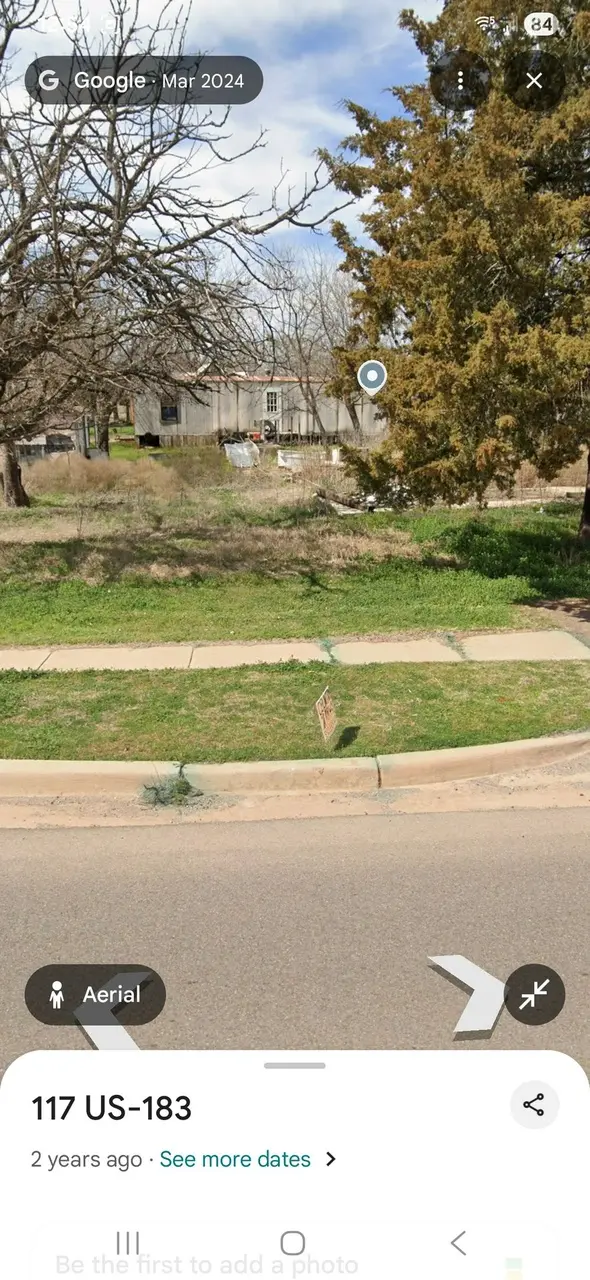
117 S Mather Ave · Manitou, OK
Flood risk 1/10 · Minimal
- FEMA flood zone
- X
- Chance of flooding over 30 yrs
- 0.0%
- Est. flood insurance / yr
- $507 – $1,088
Fire risk 4/10 · Minor
- Est. fire insurance / yr
- $2,463 – $4,575
Heat risk 7/10 · Major
- Hot days now (above 108°F)
- 7 days/yr
- Hot days in 30 yrs
- 20 days/yr
Wind risk 3/10 · Minor
- Chance of severe wind over 30 yrs
- 5.0%
Air-quality risk 1/10 · Minimal
- Unhealthy air days now
- 0 days/yr
- Unhealthy air days in 30 yrs
- 0 days/yr
Risk factors via First Street. Map © Google.
Why this score? — see what drove the D+ grade
The composite is a weighted blend of 9 inputs, each scored 0–100. Each bar is that input's sub-score; the figure is the points it added to the 100-point composite (weight × sub-score).
- Cash flow +15.0/30.0
- ARV discount +7.5/15.0
- 1% rule +5.0/10.0
- DSCR +5.0/10.0
- Appreciation +5.0/10.0
- Livability +2.6/5.0
- Rent growth +2.5/5.0
- Condition / age +2.5/5.0
- Schools +1.6/10.0
$20,000
🖨 Deal sheet (PDF) 📄 Offer letter ✓ Due diligence
Listing remarks
117 S. Mather Manitou, Oklahoma 73555 To be sold as is. 3 bed, 2 bath mobile home. 980 sq ft Built: 1980 Lot size: 3,500 sq ft This property will need some heavy remodeling. Perfect for a DIY and/or someone who has time. It would make a great starter property for a young couple. $20,000 or best offer. Willing to negotiate and sell fast. Extremely cheap annual taxes. Selling on behalf of my in-laws as I manage their properties. Please contact: Shawn Watson 254-413-4551
Key facts
- 3,500 sq ft lot
- Built 1980
- Listed 13 days
Property features AI
Exterior
- Home design: House
- Construction: 980 sq ft living area
- Exterior features: 3500 sq ft lot
Neighborhood map
What this means for you Summary
Snapshot
- This is a 3-bed/2.0-bath manufactured listed at $20k.
Deal economics
- At list price, monthly cash flow is $659 ($8k/yr) — positive.
- The deal already cash-flows at list — no discount required.
- Meets the 1% rule at list price ($985 rent vs $20k).
Location & tenants
- Location reads 51/100 on livability (#648 in OK) — a working-class tenant base; expect higher turnover. Strengths: cost of living A+, crime A; Watch: amenities F, commute F, employment F.
- Tipton (rural): math 15% / reading 15% proficiency, ranked #471 of 513 in OK (top 92%) — low school quality limits family demand, transient renter base, plan for 1-2y turnover; 68% free/reduced lunch — lower-income household profile, screen leases tightly.
- Zoned schools: Tipton Es (math 8% / reading 17%, grade F, #652 of 845 statewide, top 79%, 149 students, 0% FRL); Tipton Hs (math 24% / reading 24%, grade F, #150 of 447 statewide, top 48%, 75 students, 0% FRL) — zoned schools average 0% FRL vs 68% district-wide (68 pts lower); this property's tenant base skews higher-income than the district average.
- Market conditions: 2 active listings in the ZIP.
Forward outlook
- In year one you build about $738 of equity ($138 loan paydown + $600 appreciation (3.0% local appreciation)).
- Tillman County population projected to shrink 8% by 2050 — rents likely to lag national; underwrite the cash flow, not the appreciation.
- At projected returns (3.0% appreciation + 3.0% rent growth), your $6k cash investment doubles in ~1 year — after that, you're playing with house money.
Negotiation context
- Only 13 days on market — expect competitive offers; lowballing is unlikely to land.
- Current owner paid $6k; list at $20k implies a 233% gain — meaningful room to come down on a strong offer.
Risks & watch-outs
- Climate carrying-cost: extreme-heat days projected 7→20/yr by 2055 (HVAC capex compounding) — expect insurance premiums to compound above CPI over the hold.
Questions for the listing agent
- Is there a deadline driving the sale (1031 exchange, divorce, estate, relocation)? That informs how much negotiation room exists.
- Schools are D-rated, which usually means shorter tenancies and higher turnover. Who's the typical renter profile here, and what's been the actual vacancy rate?
- The area grade is low — what's the realistic commute time and amenity access for the typical tenant pool here? Any planned neighborhood developments (good or bad) we should know about?
- What's the average days-on-market for RENTAL listings here right now (not sales)? A rising rental-DOM trend means longer vacancies and softer asking-rent achievability than the comps imply.
- What's the recent tenant-quality profile in this submarket — average credit score on applications, eviction rate, late-payment / NSF rate, and stable-employment percentage? A property-management company in the area should have these aggregated.
- How much new for-sale + rental construction is in the pipeline within 1–3 miles? Heavy new supply typically softens prices + rents 12–24 months out; constrained supply supports both.
Investment metrics
- 1% rule
- 4.93% ✓
- Cap rate
- 45.83%
- Cash-on-cash
- 141.19%
- DSCR
- 7.28
- GRM
- 1.7
CMA / ARV
No comps found within radius.
Projected returns pro-forma
3.0% appreciation · 3.0% rent growth · sell at horizon
- IRR
- —
- Equity multiple
- 8.92×
- Total profit
- $44,378
- Equity at exit
- $8,993
- IRR
- —
- Equity multiple
- 18.71×
- Total profit
- $99,175
- Equity at exit
- $13,859
Cash invested: $5,600 (down + closing). Projections, not guarantees.
Landlord ↔ Tenant lean methodology
- Overall (STATE)
- 83 Strongly Landlord-Friendly
- State Oklahoma
- 83 Strongly Landlord-Friendly · R+20
- County
- — inherits STATE
- City
- — inherits STATE
ZIP-level market 73555
- Active inventory
- 2
- Price-to-rent
- 1.7×
Monthly cashflow live
- Estimated rent
- $985 medium interval (Pro) →
- Mortgage (P&I)
- −$105
- Tax from tax record
- −$6 /mo · $73/yr
- Insurance
- −$8
- HOA
- −$0
- Vacancy / Maint / Mgmt
- −$207
- Net cashflow
- $659
Break-even live
Sensitivity live
| Price | -10% $670 | -5% $665 | +0% $659 | +5% $653 | +10% $648 |
|---|---|---|---|---|---|
| Rent | -10% $581 | -5% $620 | +0% $659 | +5% $698 | +10% $737 |
| Rate | -1.0pp $669 | -0.5pp $664 | base $659 | +0.5pp $654 | +1.0pp $648 |
UW: 25.0% down · 7.5% · 30yr · 1.5% tax · 5.0% vac · 8.0% maint · 8.0% mgmt
Financing live
Cash to close
- Down payment
- $5,000
- Closing costs
- $600
- Reserves months
- —
- Total cash needed
- —
Loan-product check · same deal, 3 products live
Conventional
25% down · 7.5% · 30yr
- Down + closing
- —
- Monthly P&I
- —
- Monthly cashflow
- —
- DSCR
- —
- Eligible?
- —
Personal DTI + credit; lowest rate.
DSCR
20% down · 8.5% · 30yr
- Down + closing
- —
- Monthly P&I
- —
- Monthly cashflow
- —
- DSCR
- —
- Eligible?
- —
No personal income docs; deal must DSCR.
Hard money
10% down · 12.0% · 12mo
- Down + closing
- —
- Monthly P&I
- —
- Monthly cashflow
- —
- DSCR
- —
- Eligible?
- —
Short-term bridge; refi at stabilization.
Listing history 10 events
-
2026-06-21days on market $20,000 Active 13 DOM
-
2026-06-21days on market $20,000 Active 12 DOM
-
2026-06-18days on market $20,000 Active 10 DOM
-
2026-06-17days on market $20,000 Active 9 DOM
-
2026-06-16days on market $20,000 Active 8 DOM
-
2026-06-15days on market $20,000 Active 7 DOM
-
2026-06-13days on market $20,000 Active 5 DOM
-
2026-06-12days on market $20,000 Active 4 DOM
-
2026-06-08remarks 474-char remark
-
2026-06-08$20,000 Active 1 DOM
ⓘ Source: listings_history table (triggers on properties + properties_extension) + one-shot
backfill from property_details.listing_events for pre-trigger history.
Tax reassessment forecast OK · Resets to sale price
- Current annual tax
- $73 · $6/mo
- Projected year-2 tax
- $180 · $15/mo
- Expected delta
- +$107/yr (+$9/mo · 146.6%)
ⓘ Screening estimate from a state-policy table — verify with the county assessor before closing.
Climate risk First Street
- Flood 1/10 Low FEMA zone X · 0% chance over 30 yrs
- Wildfire 4/10 Moderate
- Heat 7/10 Severe 7 d/yr ≥108°F today · 20 d/yr by 30 yrs out
- Wind 3/10 Moderate 5% chance of damaging wind over 30 yrs
- Air quality 1/10 Low 0 unhealthy d/yr today · 0 by 30 yrs out
Nearby sold comps map
Loading sold comps map…
Walkable amenities ~0.75 mi
Loading nearby amenities…
Taxation est. · year 1
- Rental income
- $11,821
- − Mortgage interest
- −$1,120
- − Property taxes
- −$73
- − Insurance
- −$100
- − Repairs & maintenance
- −$946
- − Management
- −$946
- − Depreciation
- −$582
- Taxable income
- $8,054
- Est. tax owed @ 24.0%
- −$1,933
- After-tax cash flow
- $5,974/yr
For passive investors: Depreciation is non-cash, so a rental often shows a tax loss while cash-flowing — sheltering income. Rental losses are passive: they offset passive income freely, and up to $25,000/yr can offset ordinary (W-2) income if you actively participate and your MAGI is under $100k (phasing out to $0 by $150k); unused losses carry forward. On sale, claimed depreciation is recaptured at up to 25%, and gains may owe capital-gains tax (a 1031 exchange can defer both). Figures are a year-1 estimate at your 24.0% rate — not tax advice; consult a CPA.
Schools (NCES district)
- District
- Tipton
- NCES district ID
- 4030030
- Math proficiency
- 15% ▬ 0.00%
- Reading proficiency
- 15% ▼ -10.00%
- Median HH income
- $38,655
- Composite
- 16.13/100
- National rank
- #14284
- State rank
- #471 of 513 in OK
Livability — Manitou
- Score
- 51/100
- State rank
- #648
- US rank
- #25139
Category grades
Schools grade is shown separately in the Schools card above.
Census & demographics
- Census place
- Manitou, OK
- Population (ZIP)
- 235
Population outlook (Tillman County) Hauer SSP2
- Today (2025)
- 6,949 people
- By 2030
- 6,737 · -3.1%
- By 2040
- 6,402 · -7.9%
- By 2050
- 6,364 · -8.4%
- By 2075
- 7,335 · +5.6%
- By 2100
- 9,166 · +31.9%
Race, ethnicity, and origin ACS 2023
- Neighborhood character
- Diverse neighborhood (Simpson 0.64)
- Race & ethnicity
- White 57% Two or more races 22% Hispanic / Latino 17% Native American 7% Black 7%
- Hispanic origin (detail)
- Mexican 4% Puerto Rican 8%
- Common ancestry
- Slovak 3% Scottish 2% Iranian 1%
- Languages at home
- 97% English-only · Spanish 3%
Political lean MEDSL · Tillman
- 2024 margin
- Solid R (+59.5) · D 19.7% · R 79.2% · Other 1.1%
- 2008→2024 swing
- -23.8pp toward R · 2008: -35.6pp · 2024: -59.5pp
- All cycles
- 2024: R+59.5 2020: R+54.6 2016: R+47.6 2012: R+33.4 2008: R+35.6
Not yet ingested
- Civics
- —
Market trends
- HPI YoY
- —
- Current HPI
- —
- Rent YoY
- —
- Metro
- —
- State GDP YoY
- ▲ 1.55%
- F500 in state
- 6
Industry mix (Fortune 500 HQ in OK)
| Industry | F500 HQs | Revenue |
|---|---|---|
| Energy | 3 | $48B |
|
||
Price history
+233.3% since first listed2 events — show timeline
- 2026-06-08 Listed $20,000 ForSaleByOwner.com
- 2000-11-30 Sold (Public Records) $6,000 Public Records
Property tax history
+1.4%/yrLatest (2025): $73 · +4.3% YoY. Source: county tax records.
Cash-flow waterfall
monthlySold comps — $/sqft
last 12 mo · ≤1 miLoading sold comps…