 🏷️ Likely Rental
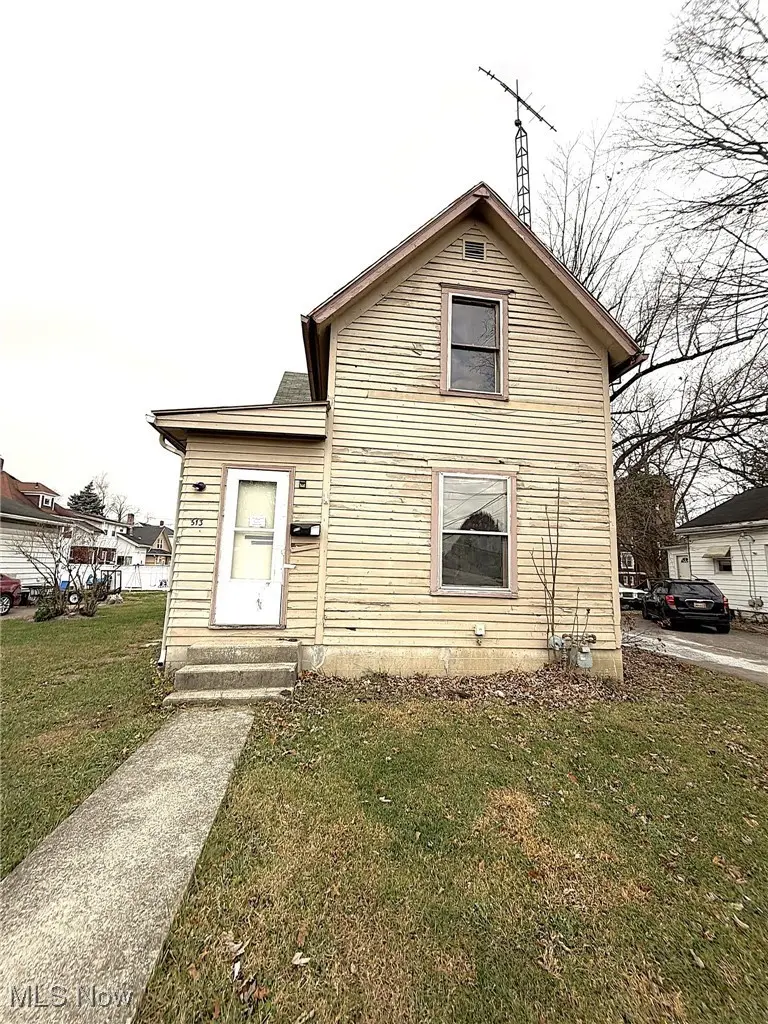
513 N Charles St · Lima, OH
Flood risk 1/10 · Minimal
- FEMA flood zone
- X (unshaded)
- Chance of flooding over 30 yrs
- 0.0%
- Est. flood insurance / yr
- $473 – $860
Fire risk 1/10 · Minimal
- Est. fire insurance / yr
- $713 – $1,323
Heat risk 3/10 · Minor
- Hot days now (above 100°F)
- 7 days/yr
- Hot days in 30 yrs
- 18 days/yr
Wind risk 2/10 · Minimal
- Chance of severe wind over 30 yrs
- —
Air-quality risk 2/10 · Minimal
- Unhealthy air days now
- 1 days/yr
- Unhealthy air days in 30 yrs
- 2 days/yr
Risk factors via First Street. Map © Google.
Why this score? — see what drove the B+ grade
The composite is a weighted blend of 9 inputs, each scored 0–100. Each bar is that input's sub-score; the figure is the points it added to the 100-point composite (weight × sub-score).
- Cash flow +30.0/30.0
- ARV discount +15.0/15.0
- 1% rule +10.0/10.0
- DSCR +10.0/10.0
- Livability +3.2/5.0
- Schools +2.6/10.0
- Rent growth +2.5/5.0
- Condition / age +2.5/5.0
- Appreciation +0.0/10.0
$59,000
🖨 Deal sheet 📄 Offer letter ✓ Due diligence
Listing remarks MLS
Investors! Finish off this value add property to your liking! This 3 bedroom, one full bath home offers 980 square feet and a 50 x 107 lot! Fantastic ARV value! Roof year unknown, no leaks. Nice Long Driveway! Partially fenced in back yard! Selling AS IS, Where Is. No Seller financing. Close to downtown Lima, parks, restaurants, shopping, hospital, freeway access and more! There are 27 other single family home properties for sale that are either tenant occupied or value add investments! Reach out to listing agent via email for info.
Key facts
- Close to parks
- Close to restaurants
- Long driveway
Tags
Neighborhood map
What this means for you Summary
Snapshot
- This is a 3-bed/1.0-bath single-family listed at $59k.
Deal economics
- At list price, monthly cash flow is $581 ($7k/yr) — positive.
- The deal already cash-flows at list — no discount required.
- Meets the 1% rule at list price ($1k rent vs $59k).
- Recommended offer: $52k (12.0% below list) — sets the bar for market timing.
- Cap rate 18.1% vs local median 7.7% in Lima — top-decile yield for the area; either an underpriced asset or a hidden risk that comps aren't pricing in. Stress-test before assuming the spread holds.
Location & tenants
- Location reads 64/100 on livability (#787 in OH) — a middle-class / working-renter tenant base. Strengths: cost of living A+, housing A+, health & safety A-; Watch: crime F, amenities F, commute F.
- Lima City (urban): math 29% / reading 36% proficiency, ranked #575 of 656 in OH (top 88%) — families likely to look elsewhere, expect single-tenant / working-renter base with shorter leases; 83% free/reduced lunch — lower-income household profile, screen leases tightly.
- Market conditions: 105 active listings in the ZIP; 3 comparable units currently listed for rent nearby; rentals lingering (median 44d on market — plan ~5-8 weeks vacancy on turnover, expect pricing pressure); 100% of comp listings sitting > 30 days — soft ceiling on asking rent; 88 units permitted in Allen County in 2024 (0 in 5+ unit buildings).
Forward outlook
- Local home prices are declining (-3.0%/yr); year-one equity from $408 of loan paydown is wiped out by about $2k of value loss. Plan a longer hold.
- Allen County population projected at -14% by 2050 — secular population decline; favor cash flow + early exit over multi-decade hold.
- At projected returns (-3.0% appreciation + 3.0% rent growth), your $17k cash investment doubles in ~3 years — after that, you're playing with house money.
Negotiation context
- It's been on market 140 days — a 12% lower offer ($52k) is reasonable based on typical stale-listing flexibility.
- 4 sale attempts since 5y ago; this cycle's ask has dropped $8k (12%) from the opening price — seller is motivated, your offer sets the floor, not the list.
Risks & watch-outs
- Watch-outs: built in 1909 — expect roof / HVAC / electrical / plumbing capex.
Questions for the listing agent
- It's been on market 140 days. Have you received any prior offers? Is the seller open to a 12% concession, seller financing, or rate buy-down credit?
- Built in 1909 — when were the roof, HVAC, electrical panel, plumbing, and water heater last replaced?
- Why hasn't it sold? Are there any deal-killer items the seller is aware of (foundation, flood, title, zoning, code violations)?
- Is there a deadline driving the sale (1031 exchange, divorce, estate, relocation)? That informs how much negotiation room exists.
- Crime grade is F in this area — have there been break-ins, vandalism, or insurance claims at this property in the last 3 years? What carrier currently insures it and at what premium?
- What's the average days-on-market for RENTAL listings here right now (not sales)? A rising rental-DOM trend means longer vacancies and softer asking-rent achievability than the comps imply.
- What's the recent tenant-quality profile in this submarket — average credit score on applications, eviction rate, late-payment / NSF rate, and stable-employment percentage? A property-management company in the area should have these aggregated.
- How much new for-sale + rental construction is in the pipeline within 1–3 miles? Heavy new supply typically softens prices + rents 12–24 months out; constrained supply supports both.
Investment metrics
- 1% rule
- 2.06% ✓
- Cap rate
- 18.11%
- Cash-on-cash
- 42.20%
- DSCR
- 2.88
- GRM
- 4.0
CMA / ARV
- ARV (median comp)
- $105,376
- List price
- $59,000
- Delta
- -44.01%
- Verdict
- UNDERPRICED
- Comps
- 20 within 1.0 mi
Show comp detail 12 sales within ~0.75 mi
| Address | Dist | Beds/Ba | Sqft | Sold | Price | $/sf | Match |
|---|---|---|---|---|---|---|---|
| 809 Rice Ave | 0.20mi | 2/1.0 (-1) | 936 (-4%) | 1mo | $60,000 | $64 | 77 |
| 806 Ewing Ave | 0.48mi | 3/1.0 | 992 (+1%) | 1mo | $31,000 | $31 | 75 |
| 638 Hazel Ave | 0.37mi | 2/1.5 (-1) | 960 (-2%) | 1mo | $130,000 | $135 | 71 |
| 765 Ewing Ave | 0.49mi | 3/1.0 | 1,006 (+3%) | 4mo | $157,000 | $156 | 69 |
| 1245 Latham Ave | 0.47mi | 3/1.0 | 1,066 (+9%) | 1mo | $145,000 | $136 | 62 |
| 1120 Melrose St | 0.59mi | 3/1.0 | 1,040 (+6%) | 2mo | $165,000 | $159 | 61 |
| 612 N Metcalf St | 0.53mi | 3/1.0 | 1,038 (+6%) | 6mo | $75,000 | $72 | 60 |
| 1407 Latham Ave | 0.53mi | 3/1.0 | 1,066 (+9%) | 2mo | $130,000 | $122 | 59 |
| 753 Brice Ave | 0.36mi | 3/1.5 | 1,108 (+13%) | 3mo | $85,000 | $77 | 57 |
| 1027 Sherman Ave | 0.70mi | 3/1.0 | 1,052 (+7%) | 4mo | $130,000 | $124 | 52 |
| 315 N Nixon Ave | 0.69mi | 3/1.0 | 1,070 (+9%) | 8mo | $151,000 | $141 | 45 |
| 812 W Ashton Ave W | 0.72mi | 2/1.0 (-1) | 1,084 (+11%) | 5mo | $184,000 | $170 | 40 |
Match score weights: distance 35% · size 25% · config 20% · recency 20%. Top-matched comps best support the ARV.
Projected returns pro-forma
-3.0% appreciation · 3.0% rent growth · sell at horizon
- IRR
- 38.9%
- Equity multiple
- 2.66×
- Total profit
- $27,440
- Equity at exit
- $8,797
- IRR
- 45.3%
- Equity multiple
- 5.33×
- Total profit
- $71,542
- Equity at exit
- $5,101
Cash invested: $16,520 (down + closing). Projections, not guarantees.
Landlord ↔ Tenant lean methodology
- Overall (STATE)
- 73 Landlord-Friendly
- State Ohio
- 73 Landlord-Friendly · R+6
- County
- — inherits STATE
- City
- — inherits STATE
ZIP-level market 45805
- Active inventory
- 105
- Price-to-rent
- 4.0×
Monthly cashflow live
- Estimated rent
- $1,217 medium interval (Pro) →
- Mortgage (P&I)
- −$309
- Tax from tax record
- −$47 /mo · $558/yr
- Insurance
- −$25
- HOA
- −$0
- Vacancy / Maint / Mgmt
- −$256
- Net cashflow
- $581
Break-even live
UW: 25.0% down · 7.5% · 30yr · 1.5% tax · 5.0% vac · 8.0% maint · 8.0% mgmt
Financing live
Cash to close
- Down payment
- $14,750
- Closing costs
- $1,770
- Reserves months
- —
- Total cash needed
- —
Loan-product check · same deal, 3 products live
Conventional
25% down · 7.5% · 30yr
- Down + closing
- —
- Monthly P&I
- —
- Monthly cashflow
- —
- DSCR
- —
- Eligible?
- —
Personal DTI + credit; lowest rate.
DSCR
20% down · 8.5% · 30yr
- Down + closing
- —
- Monthly P&I
- —
- Monthly cashflow
- —
- DSCR
- —
- Eligible?
- —
No personal income docs; deal must DSCR.
Hard money
10% down · 12.0% · 12mo
- Down + closing
- —
- Monthly P&I
- —
- Monthly cashflow
- —
- DSCR
- —
- Eligible?
- —
Short-term bridge; refi at stabilization.
Rent comps 3 comps
| Address | Beds | Baths | Sqft | Rent | $/sqft | DOM | Units | Dist |
|---|---|---|---|---|---|---|---|---|
| 1014 W Market St Apt 3 Lima, OH | 2.0 | 1.0 | 800 | $1,400 | $1.75 | 43d | 1 | 0.41mi |
| 545 W Market St Unit 340 1/2 Mcpheron Lima, OH | 2.0 | 1.0 | 900 | $800 | $0.89 | 43d | 1 | 0.71mi |
| 43 Town Sq Lima, OH | 2.0–3.0 | 1.0–2.0 | 1100 | $1,413 | $1.28 | 43d | 9 | 1.00mi |
Listing history 28 events
-
2026-06-19days on market $59,000 Active 140 DOM
-
2026-06-18days on market $59,000 Active 139 DOM
-
2026-06-17days on market $59,000 Active 138 DOM
-
2026-06-16days on market $59,000 Active 137 DOM
-
2026-06-15days on market $59,000 Active 136 DOM
-
2026-06-14days on market $59,000 Active 134 DOM
-
2026-06-12days on market $59,000 Active 133 DOM
-
2026-06-09days on market $59,000 Active 130 DOM
-
2026-06-08days on market $59,000 Active 129 DOM
-
2026-06-07days on market $59,000 Active 128 DOM
-
2026-06-07days on market $59,000 Active 127 DOM
-
2026-06-04days on market $59,000 Active 124 DOM
-
2026-06-02days on market $59,000 Active 123 DOM
-
2026-06-01days on market $59,000 Active 122 DOM
-
2026-05-31days on market $59,000 Active 121 DOM
-
2026-05-31days on market $59,000 Active 120 DOM
-
2026-04-25price $59,000 538-char remark
Show marketing remark (538 chars)
Investors! Finish off this value add property to your liking! This 3 bedroom, one full bath home offers 980 square feet and a 50 x 107 lot! Fantastic ARV value! Roof year unknown, no leaks. Nice Long Driveway! Partially fenced in back yard! Selling AS IS, Where Is. No Seller financing. Close to downtown Lima, parks, restaurants, shopping, hospital, freeway access and more! There are 27 other single family home properties for sale that are either tenant occupied or value add investments! Reach out to listing agent via email for info.
-
2026-03-03price $63,000 538-char remark
Show marketing remark (538 chars)
Investors! Finish off this value add property to your liking! This 3 bedroom, one full bath home offers 980 square feet and a 50 x 107 lot! Fantastic ARV value! Roof year unknown, no leaks. Nice Long Driveway! Partially fenced in back yard! Selling AS IS, Where Is. No Seller financing. Close to downtown Lima, parks, restaurants, shopping, hospital, freeway access and more! There are 27 other single family home properties for sale that are either tenant occupied or value add investments! Reach out to listing agent via email for info.
-
2026-02-21price $65,000 538-char remark
Show marketing remark (538 chars)
Investors! Finish off this value add property to your liking! This 3 bedroom, one full bath home offers 980 square feet and a 50 x 107 lot! Fantastic ARV value! Roof year unknown, no leaks. Nice Long Driveway! Partially fenced in back yard! Selling AS IS, Where Is. No Seller financing. Close to downtown Lima, parks, restaurants, shopping, hospital, freeway access and more! There are 27 other single family home properties for sale that are either tenant occupied or value add investments! Reach out to listing agent via email for info.
-
2026-01-30$67,000 Active 538-char remark
Show marketing remark (538 chars)
Investors! Finish off this value add property to your liking! This 3 bedroom, one full bath home offers 980 square feet and a 50 x 107 lot! Fantastic ARV value! Roof year unknown, no leaks. Nice Long Driveway! Partially fenced in back yard! Selling AS IS, Where Is. No Seller financing. Close to downtown Lima, parks, restaurants, shopping, hospital, freeway access and more! There are 27 other single family home properties for sale that are either tenant occupied or value add investments! Reach out to listing agent via email for info.
-
2025-07-09price $1
-
2025-05-21price $35,000
-
2025-04-30$45,000 Active
-
2023-12-07$80,000 Active
-
2022-03-29soldstatus $196,000
-
2022-03-22soldstatus $25,236
-
2021-06-23$49,900
-
2013-01-31soldstatus $4,000
ⓘ Source: listings_history table (triggers on properties + properties_extension) + one-shot
backfill from property_details.listing_events for pre-trigger history.
Tax reassessment forecast OH · Partial reset (capped growth)
- Current annual tax
- $558 · $47/mo
- Projected year-2 tax
- $739 · $62/mo
- Expected delta
- +$181/yr (+$15/mo · 32.5%)
ⓘ Screening estimate from a state-policy table — verify with the county assessor before closing.
Climate risk First Street
- Flood 1/10 Low FEMA zone X (unshaded) · 0% chance over 30 yrs
- Wildfire 1/10 Low
- Heat 3/10 Moderate 7 d/yr ≥100°F today · 18 d/yr by 30 yrs out
- Wind 2/10 Low
- Air quality 2/10 Low 1 unhealthy d/yr today · 2 by 30 yrs out
Nearby sold comps map
Loading sold comps map…
Walkable amenities ~0.75 mi
Loading nearby amenities…
Taxation est. · year 1
- Rental income
- $14,604
- − Mortgage interest
- −$3,305
- − Property taxes
- −$558
- − Insurance
- −$295
- − Repairs & maintenance
- −$1,168
- − Management
- −$1,168
- − Depreciation
- −$1,716
- Taxable income
- $6,393
- Est. tax owed @ 24.0%
- −$1,534
- After-tax cash flow
- $5,437/yr
For passive investors: Depreciation is non-cash, so a rental often shows a tax loss while cash-flowing — sheltering income. Rental losses are passive: they offset passive income freely, and up to $25,000/yr can offset ordinary (W-2) income if you actively participate and your MAGI is under $100k (phasing out to $0 by $150k); unused losses carry forward. On sale, claimed depreciation is recaptured at up to 25%, and gains may owe capital-gains tax (a 1031 exchange can defer both). Figures are a year-1 estimate at your 24.0% rate — not tax advice; consult a CPA.
Schools (NCES district)
- District
- Lima City
- NCES district ID
- 3904422
- Math proficiency
- 29% ▼ -13.00%
- Reading proficiency
- 36% ▼ -6.00%
- Median HH income
- $29,685
- Composite
- 26.31/100
- National rank
- #7243
- State rank
- #575 of 656 in OH
Livability — Lima
- Score
- 64/100
- State rank
- #787
- US rank
- #14288
Category grades
Schools grade is shown separately in the Schools card above.
Census & demographics
- Census place
- Lima, OH
- County
- Allen · 98,169 people
- City population
- 21,739
- Metro
- Lima, OH
- Population (ZIP)
- 24,746
- Household income
- $65,954
- Rent vs Own
- Severe rent burden
- 8.0
Population outlook (Allen County) Hauer SSP2
- Today (2025)
- 100,321 people
- By 2030
- 97,693 · -2.6%
- By 2040
- 91,802 · -8.5%
- By 2050
- 86,152 · -14.1%
- By 2075
- 73,659 · -26.6%
- By 2100
- 58,716 · -41.5%
Race, ethnicity, and origin ACS 2023
- Neighborhood character
- Predominantly White (74%)
- Race & ethnicity
- White 74% Black 15% Two or more races 6% Hispanic / Latino 4% Asian 1%
- Common ancestry
- Italian 2% Slovak 2% Romanian 2%
- Foreign-born
- 2% · Canada, Vietnam
- Languages at home
- 96% English-only · Spanish 1% Vietnamese 1%
Political lean MEDSL · Allen
- 2024 margin
- Solid R (+44.1) · D 27.5% · R 71.6%
- 2008→2024 swing
- -23.4pp toward R · 2008: -20.7pp · 2024: -44.1pp
- All cycles
- 2024: R+44.1 2020: R+39.5 2016: R+38.2 2012: R+25.7 2008: R+20.7
Not yet ingested
- Civics
- —
Market trends
- HPI YoY
- ▼ -156.78%
- Current HPI
- 210.6397
- Rent YoY
- —
- Metro
- —
- State GDP YoY
- ▲ 1.98%
- F500 in state
- 48
Industry mix (Fortune 500 HQ in OH)
| Industry | F500 HQs | Revenue |
|---|---|---|
| Insurance | 3 | $145B |
|
||
| Industrial Machinery | 3 | $49B |
|
||
| Financial Services | 3 | $24B |
|
||
| Consumer Goods | 2 | $93B |
|
||
| Aerospace / Defense | 2 | $47B |
|
||
| Utilities | 2 | $33B |
|
||
Price history
+1375.0% since first listed12 events — show timeline
- 2026-04-25 Price Changed $59,000 MLSNOW
- 2026-03-03 Price Changed $63,000 MLSNOW
- 2026-02-21 Price Changed $65,000 MLSNOW
- 2026-01-30 Listed $67,000 MLSNOW
- 2025-07-09 Price Changed $1 MARMLS
- 2025-05-21 Price Changed $35,000 MARMLS
- 2025-04-30 Listed $45,000 MARMLS
- 2023-12-07 Listed $80,000 WCARE
- 2022-03-29 Sold (Public Records) $196,000 Public Records
- 2022-03-22 Sold (MLS) $25,236 WCARE
- 2021-06-23 Listed $49,900 WCARE
- 2013-01-31 Sold (Public Records) $4,000 Public Records
Property tax history
-1.5%/yrLatest (2025): $558 · -8.1% YoY. Source: county tax records.
Cash-flow waterfall
monthlySold comps — $/sqft
last 12 mo · ≤1 miLoading sold comps…