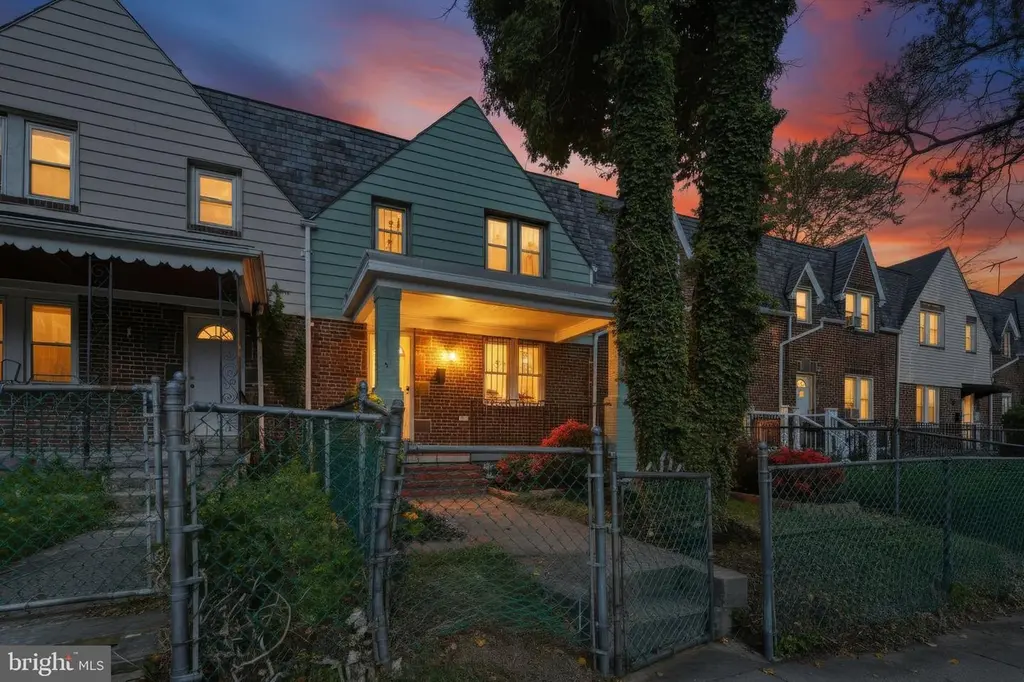
12 N Rosedale St · Baltimore, MD
Flood risk 1/10 · Minimal
- FEMA flood zone
- X (unshaded)
- Chance of flooding over 30 yrs
- 0.0%
- Est. flood insurance / yr
- $473 – $860
Fire risk 1/10 · Minimal
- Est. fire insurance / yr
- $755 – $1,403
Heat risk 7/10 · Major
- Hot days now (above 103°F)
- 7 days/yr
- Hot days in 30 yrs
- 15 days/yr
Wind risk 6/10 · Moderate
- Chance of severe wind over 30 yrs
- 27.0%
Air-quality risk 3/10 · Minor
- Unhealthy air days now
- 3 days/yr
- Unhealthy air days in 30 yrs
- 4 days/yr
Risk factors via First Street. Map © Google.
Why this score? — see what drove the C grade
The composite is a weighted blend of 9 inputs, each scored 0–100. Each bar is that input's sub-score; the figure is the points it added to the 100-point composite (weight × sub-score).
- Cash flow +23.8/30.0
- DSCR +7.7/10.0
- ARV discount +7.4/15.0
- 1% rule +6.0/10.0
- Rent growth +3.8/5.0
- Livability +3.8/5.0
- Condition / age +2.5/5.0
- Schools +1.0/10.0
- Appreciation +0.0/10.0
$160,000
🖨 Deal sheet (PDF) 📄 Offer letter ✓ Due diligence
Listing remarks
Please Check Comps before Showing. Beautifully Renovated 3 Bedroom One and 1/2 Bath Home. Stainless Steel Appliances, Granite Counter Tops and Island. High End Cabinetry with Slow Close Doors and Drawers. All New Flooring and Paint. Off Street Paring in Rear. Shed for Extra Storage. Recessed Lighting. Custom Trim. All New Door Hardware.
Key facts
- Off street parking
- Recessed lighting
- Granite counter tops
Tags
Property features AI
Finance
- Other: Ownership: ground rent
- Financial info: Ground rent exists (amount paid semi-annually)
Exterior
- Parking: Private paved concrete driveway; Off-street and on-street parking available; One total garage/parking space and one off-street space
- Utilities: Public water; Public sewer; 120/240V electric with 100 amp service; Natural gas available; Cable TV available; Phone available; Municipal trash service
- Home design: Interior townhouse/rowhouse; Flat roof; Building not winterized; Ground rent exists (semi-annual payment)
- Construction: Brick construction; Stone foundation; Estimated year of major renovation 2026; Year built estimated
- Exterior features: Front and rear yard; Landscaping; Level lot; Sidewalks; Road frontage; Chain link fencing; Shed
Interior
- Kitchen: Built-in microwave; Dishwasher; Disposal; Self-cleaning oven; Gas range; Refrigerator; Stainless steel appliances; Kitchen island
- Basement: Full, partially finished daylight basement with outside/rear entrance and walkout stairs; Basement has windows
- Bedrooms: Three bedrooms on the upper level
- Bathrooms: One full bathroom (upper level); One half bathroom (lower level)
- Fireplace: Two fireplaces with stone and brick features
- Heating & cooling: Radiant heating; Natural gas heating fuel
- Interior features: Attic; Tub/shower; Combination kitchen/dining area; Separate dining area; Traditional floor plan; Eat-in kitchen with island; Recessed lighting; Six-panel doors; Estimated living area
- Laundry & utility: Washer and dryer (dryer is electric); Laundry in basement; Water heater (60+ gallon tank, natural gas)
Neighborhood map
What this means for you Summary
Snapshot
- This is a 3-bed/1.5-bath townhouse listed at $160k.
Deal economics
- At list price, monthly cash flow is $307 ($4k/yr) — positive.
- The deal already cash-flows at list — no discount required.
- Meets the 1% rule at list price ($2k rent vs $160k).
- Cap rate 8.6% vs local median 6.0% in Baltimore — top-decile yield for the area; either an underpriced asset or a hidden risk that comps aren't pricing in. Stress-test before assuming the spread holds.
Location & tenants
- Location reads 76/100 on livability (#90 in MD, #3,396 nationally) — a middle-class / working-renter tenant base. Strengths: amenities A+, commute A+, housing A+; Watch: schools D, crime F.
- Baltimore City Public Schools (urban): math 7% / reading 16% proficiency, ranked #24 of 24 in MD (top 100%) — low school quality limits family demand, transient renter base, plan for 1-2y turnover; 79% free/reduced lunch — lower-income household profile, screen leases tightly.
- Market conditions: Rents rising fast (+5.4%/yr); 252 active listings in the ZIP; 40 comparable units currently listed for rent nearby; rentals at typical pace (median 25d on market — plan ~3-4 weeks tenant-placement turnaround); 1,273 units permitted in Baltimore city in 2024 (1,104 in 5+ unit buildings).
- This rent runs 35% of the median local income ($60k/yr) — at the standard rent-burdened threshold; future hikes will face affordability resistance.
Forward outlook
- Local home prices are declining (-3.0%/yr); year-one equity from $1k of loan paydown is wiped out by about $5k of value loss. Plan a longer hold.
- Baltimore County population projected to shrink 4% by 2050 — rents likely to lag national; underwrite the cash flow, not the appreciation.
- At projected returns (-3.0% appreciation + 5.4% rent growth), your $45k cash investment doubles in ~10 years — after that, you're playing with house money.
Negotiation context
- Only 12 days on market — expect competitive offers; lowballing is unlikely to land.
- 2 sale attempts; this cycle's ask is 7% above the opening price — seller raised mid-cycle; expect resistance to lowballs.
Risks & watch-outs
- Watch-outs: built in 1936 — expect roof / HVAC / electrical / plumbing capex.
- Climate carrying-cost: major wind risk, 27% chance of damaging wind over 30y; extreme-heat days projected 7→15/yr by 2055 (HVAC capex compounding) — expect insurance premiums to compound above CPI over the hold.
Questions for the listing agent
- Built in 1936 — when were the roof, HVAC, electrical panel, plumbing, and water heater last replaced?
- Is there a deadline driving the sale (1031 exchange, divorce, estate, relocation)? That informs how much negotiation room exists.
- Schools are D-rated, which usually means shorter tenancies and higher turnover. Who's the typical renter profile here, and what's been the actual vacancy rate?
- Crime grade is F in this area — have there been break-ins, vandalism, or insurance claims at this property in the last 3 years? What carrier currently insures it and at what premium?
- What's the average days-on-market for RENTAL listings here right now (not sales)? A rising rental-DOM trend means longer vacancies and softer asking-rent achievability than the comps imply.
- What's the recent tenant-quality profile in this submarket — average credit score on applications, eviction rate, late-payment / NSF rate, and stable-employment percentage? A property-management company in the area should have these aggregated.
- How much new for-sale + rental construction is in the pipeline within 1–3 miles? Heavy new supply typically softens prices + rents 12–24 months out; constrained supply supports both.
Investment metrics
- 1% rule
- 1.10% ✓
- Cap rate
- 8.60%
- Cash-on-cash
- 8.23%
- DSCR
- 1.37
- GRM
- 7.6
CMA / ARV
- ARV (median comp)
- $159,587
- List price
- $160,000
- Delta
- 0.26%
- Verdict
- FAIR
- Comps
- 20 within 1.0 mi
Show comp detail 12 sales within ~0.75 mi
| Address | Dist | Beds/Ba | Sqft | Sold | Price | $/sf | Match |
|---|---|---|---|---|---|---|---|
| 222 N Hilton St | 0.28mi | 3/1.0 | 1,120 (-3%) | 1mo | $89,775 | $80 | 79 |
| 5 Rosedale St S | 0.05mi | 3/2.0 | 1,280 (+10%) | 1mo | $110,000 | $86 | 78 |
| 28 S Bernice Ave | 0.10mi | 3/1.0 | 1,280 (+10%) | 1mo | $147,000 | $115 | 75 |
| 119 Hilton St | 0.17mi | 2/2.0 (-1) | 1,040 (-10%) | 0mo | $211,000 | $203 | 68 |
| 537 Longwood St | 0.56mi | 4/2.0 (+1) | 1,176 (+1%) | 0mo | $60,000 | $51 | 64 |
| 107 N Monastery Ave | 0.38mi | 2/1.5 (-1) | 1,080 (-7%) | 2mo | $65,000 | $60 | 64 |
| 300 Denison St | 0.43mi | 3/2.0 | 1,260 (+9%) | 2mo | $205,000 | $163 | 62 |
| 21 Culver St | 0.40mi | 2/2.0 (-1) | 1,260 (+9%) | 1mo | $210,000 | $167 | 59 |
| 156 S Hilton St | 0.27mi | 4/1.5 (+1) | 1,320 (+14%) | 2mo | $195,000 | $148 | 58 |
| 209 Mount Holly St | 0.60mi | 3/2.0 | 1,080 (-7%) | 2mo | $228,000 | $211 | 57 |
| 3039 Harlem Ave | 0.65mi | 3/1.0 | 1,070 (-8%) | 1mo | $27,500 | $26 | 54 |
| 3017 Frederick Ave | 0.45mi | 4/3.0 (+1) | 1,260 (+9%) | 2mo | $217,000 | $172 | 52 |
Match score weights: distance 35% · size 25% · config 20% · recency 20%. Top-matched comps best support the ARV.
Projected returns pro-forma
-3.0% appreciation · 5.38% rent growth · sell at horizon
- IRR
- -1.2%
- Equity multiple
- 0.95×
- Total profit
- $-2,024
- Equity at exit
- $23,857
- IRR
- 10.9%
- Equity multiple
- 1.94×
- Total profit
- $42,100
- Equity at exit
- $13,834
Cash invested: $44,800 (down + closing). Projections, not guarantees.
Landlord ↔ Tenant lean methodology
- Overall (CITY)
- 12 Strongly Tenant-Friendly
- State Maryland
- 27 Tenant-Leaning · D+14
- County
- — inherits STATE
- City Baltimore
- 12 Strongly Tenant-Friendly · D+58
ZIP-level market 21229
- Rents YoY
- 5.4%
- Active inventory
- 252
- Price-to-rent
- 7.6×
Monthly cashflow live
- Estimated rent
- $1,762 high interval (Pro) →
- Mortgage (P&I)
- −$839
- Tax from tax record
- −$179 /mo · $2,145/yr
- Insurance
- −$67
- HOA
- −$0
- Vacancy / Maint / Mgmt
- −$370
- Net cashflow
- $307
Break-even live
Sensitivity live
| Price | -10% $398 | -5% $353 | +0% $307 | +5% $262 | +10% $217 |
|---|---|---|---|---|---|
| Rent | -10% $168 | -5% $238 | +0% $307 | +5% $377 | +10% $446 |
| Rate | -1.0pp $388 | -0.5pp $348 | base $307 | +0.5pp $266 | +1.0pp $224 |
UW: 25.0% down · 7.5% · 30yr · 1.5% tax · 5.0% vac · 8.0% maint · 8.0% mgmt
Financing live
Cash to close
- Down payment
- $40,000
- Closing costs
- $4,800
- Reserves months
- —
- Total cash needed
- —
Loan-product check · same deal, 3 products live
Conventional
25% down · 7.5% · 30yr
- Down + closing
- —
- Monthly P&I
- —
- Monthly cashflow
- —
- DSCR
- —
- Eligible?
- —
Personal DTI + credit; lowest rate.
DSCR
20% down · 8.5% · 30yr
- Down + closing
- —
- Monthly P&I
- —
- Monthly cashflow
- —
- DSCR
- —
- Eligible?
- —
No personal income docs; deal must DSCR.
Hard money
10% down · 12.0% · 12mo
- Down + closing
- —
- Monthly P&I
- —
- Monthly cashflow
- —
- DSCR
- —
- Eligible?
- —
Short-term bridge; refi at stabilization.
Rent comps 40 comps
| Address | Beds | Baths | Sqft | Rent | $/sqft | DOM | Units | Dist |
|---|---|---|---|---|---|---|---|---|
| 3336 W Caton Ave Baltimore, MD | 3.0 | 2.0 | 1236 | $1,625 | $1.31 | 24d | 1 | 0.23mi |
| 3310 Elbert St Baltimore, MD | 2.0 | 1.0 | 920 | $1,550 | $1.68 | 24d | 1 | 0.24mi |
| 41 N Kossuth St Baltimore, MD | 3.0 | 2.0 | 1216 | $1,800 | $1.48 | 24d | 1 | 0.29mi |
| 3130 Stafford St Baltimore, MD | 3.0 | 1.0 | 1200 | $1,500 | $1.25 | 21d | 1 | 0.44mi |
| 3607 W Lexington St Baltimore, MD | 3.0 | 2.0 | 1050 | $1,895 | $1.80 | 5d | 1 | 0.52mi |
| 405 N Edgewood St Baltimore, MD | 4.0 | 2.0 | 1408 | $2,950 | $2.10 | 5d | 1 | 0.54mi |
| 2815 W Mulberry St Baltimore, MD | 4.0 | 2.0 | 1040 | $2,050 | $1.97 | 44d | 1 | 0.56mi |
| 2537 Hollins St Baltimore, MD | 3.0 | 2.0 | 1200 | $1,450 | $1.21 | 24d | 1 | 0.62mi |
| 3423 Edmondson Ave Baltimore, MD | 2.0 | 1.5 | 1400 | $1,710 | $1.22 | 44d | 1 | 0.62mi |
| 332 S Franklintown Rd Unit 2 Baltimore, MD | 2.0 | 1.0 | 776 | $795 | $1.02 | 24d | 1 | 0.64mi |
| 2516 Hollins St Baltimore, MD | 3.0 | 2.0 | 1100 | $1,700 | $1.55 | 44d | 1 | 0.65mi |
| 3507 Edmondson Ave Baltimore, MD | 4.0 | 2.0 | 1428 | $2,300 | $1.61 | 44d | 1 | 0.65mi |
| 2540 Frederick Ave Baltimore, MD | 3.0 | 1.0 | 1075 | $1,400 | $1.30 | 24d | 1 | 0.68mi |
| 110 S Catherine St Unit 1 Baltimore, MD | 2.0 | 1.0 | 1330 | $1,500 | $1.13 | 44d | 1 | 0.69mi |
| 2657 Lehman St Unit 1 Baltimore, MD | 2.0 | 1.0 | 1056 | $1,000 | $0.95 | 44d | 1 | 0.70mi |
| 709 Denison St Baltimore, MD | 2.0 | 2.0 | 840 | $1,630 | $1.94 | 24d | 1 | 0.71mi |
| 3706 W Franklin St Unit 1 Baltimore, MD | 2.0 | 1.0 | 735 | $1,100 | $1.50 | 5d | 1 | 0.71mi |
| 3015 Rayner Ave Baltimore, MD | 3.0 | 1.0 | 1152 | $1,350 | $1.17 | 44d | 1 | 0.72mi |
| 2636 Lauretta Ave Baltimore, MD | 3.0 | 2.5 | 1232 | $1,900 | $1.54 | 44d | 1 | 0.72mi |
| 2609 Lauretta Ave Baltimore, MD | 3.0 | 1.0 | 1286 | $1,675 | $1.30 | 24d | 1 | 0.73mi |
| 212 S Loudon Ave Baltimore, MD | 3.0 | 1.5 | 1310 | $1,550 | $1.18 | 44d | 1 | 0.74mi |
| 2738 Wilkens Ave Baltimore, MD | 3.0 | 1.0 | 1183 | $1,500 | $1.27 | 44d | 1 | 0.75mi |
| 623 N Grantley St Baltimore, MD | 4.0 | 2.0 | 1250 | $2,000 | $1.60 | 24d | 1 | 0.76mi |
| 4018 Massachusetts Ave Baltimore, MD | 3.0 | 1.0 | 1050 | $1,400 | $1.33 | 24d | 1 | 0.77mi |
| 2737 Wilkens Ave Baltimore, MD | 3.0 | 1.5 | 1232 | $1,650 | $1.34 | 5d | 1 | 0.77mi |
| 2671 Saint Benedict St Baltimore, MD | 2.0 | 1.0 | 1144 | $1,325 | $1.16 | 44d | 1 | 0.77mi |
| 730 Linnard St Unit 1 Baltimore, MD | 4.0 | 1.0 | 1360 | $1,750 | $1.29 | 24d | 1 | 0.79mi |
| 780 Linnard St Baltimore, MD | 3.0 | 2.0 | 1224 | $1,590 | $1.30 | 44d | 1 | 0.82mi |
| 62 N Gorman Ave Baltimore, MD | 3.0 | 2.0 | 1100 | $2,500 | $2.27 | 18d | 1 | 0.84mi |
| 787 N Grantley St Baltimore, MD | 3.0 | 1.0 | 1116 | $1,575 | $1.41 | 24d | 1 | 0.84mi |
| 2509 Christian St Baltimore, MD | 4.0 | 2.0 | 1248 | $1,699 | $1.36 | 4d | 1 | 0.86mi |
| 304 Collins Ave Unit 2 Baltimore, MD | 3.0 | 1.0 | 1016 | $2,100 | $2.07 | 44d | 1 | 0.86mi |
| 798 N Grantley St Baltimore, MD | 3.0 | 2.0 | 1360 | $2,295 | $1.69 | 24d | 1 | 0.87mi |
| 3712 Gelston Dr Baltimore, MD | 3.0 | 2.0 | 1250 | $2,500 | $2.00 | 24d | 1 | 0.87mi |
| 3392 Saint Benedict St Baltimore, MD | 2.0 | 1.0 | 864 | $1,450 | $1.68 | 24d | 1 | 0.88mi |
| 2514 Wilkens Ave Baltimore, MD | 4.0 | 1.0 | 1344 | $1,800 | $1.34 | 11d | 1 | 0.88mi |
| 2514 Wilkens Ave Baltimore, MD | 4.0 | 1.0 | 1344 | $1,800 | $1.34 | 44d | 1 | 0.88mi |
| 2232 W Baltimore St Baltimore, MD | 3.0 | 1.0 | 1250 | $1,875 | $1.50 | 24d | 1 | 0.90mi |
| 2225 W Baltimore St Baltimore, MD | 3.0 | 2.5 | 1200 | $1,600 | $1.33 | 24d | 1 | 0.91mi |
| 2 S Woodington Rd Baltimore, MD | 2.0 | 1.0 | 856 | $1,160 | $1.36 | 15d | 1 | 0.96mi |
Listing history 7 events
-
2026-05-06status Pending 338-char remark
-
2026-04-30price $160,000 338-char remark
-
2026-04-24$150,000 Active 338-char remark
-
2025-10-13historical
-
2025-09-26$110,000 Active
-
2025-09-24soldstatus $70,000
-
1995-07-14soldstatus $5,600
ⓘ Source: listings_history table (triggers on properties + properties_extension) + one-shot
backfill from property_details.listing_events for pre-trigger history.
Tax reassessment forecast MD · Partial reset (capped growth)
- Current annual tax
- $2,145 · $179/mo
- Projected year-2 tax
- $2,145 · $179/mo
- Expected delta
- $0/yr ($0/mo · 0.0%)
ⓘ Screening estimate from a state-policy table — verify with the county assessor before closing.
Climate risk First Street
- Flood 1/10 Low FEMA zone X (unshaded) · 0% chance over 30 yrs
- Wildfire 1/10 Low
- Heat 7/10 Severe 7 d/yr ≥103°F today · 15 d/yr by 30 yrs out
- Wind 6/10 Major 27% chance of damaging wind over 30 yrs
- Air quality 3/10 Moderate 3 unhealthy d/yr today · 4 by 30 yrs out
Nearby sold comps map
Loading sold comps map…
Walkable amenities ~0.75 mi
Loading nearby amenities…
Taxation est. · year 1
- Rental income
- $21,141
- − Mortgage interest
- −$8,962
- − Property taxes
- −$2,145
- − Insurance
- −$800
- − Repairs & maintenance
- −$1,691
- − Management
- −$1,691
- − Depreciation
- −$4,655
- Taxable income
- $1,196
- Est. tax owed @ 24.0%
- −$287
- After-tax cash flow
- $3,400/yr
For passive investors: Depreciation is non-cash, so a rental often shows a tax loss while cash-flowing — sheltering income. Rental losses are passive: they offset passive income freely, and up to $25,000/yr can offset ordinary (W-2) income if you actively participate and your MAGI is under $100k (phasing out to $0 by $150k); unused losses carry forward. On sale, claimed depreciation is recaptured at up to 25%, and gains may owe capital-gains tax (a 1031 exchange can defer both). Figures are a year-1 estimate at your 24.0% rate — not tax advice; consult a CPA.
Schools (NCES district)
- District
- Baltimore City Public Schools
- NCES district ID
- 2400090
- Math proficiency
- 7% ▼ -9.00%
- Reading proficiency
- 16% ▼ -5.00%
- Median HH income
- $42,108
- Composite
- 10.08/100
- National rank
- #9805
- State rank
- #24 of 24 in MD
Livability — Baltimore
- Score
- 76/100
- State rank
- #90
- US rank
- #3396
Category grades
Schools grade is shown separately in the Schools card above.
Census & demographics
- Census place
- Baltimore, MD
- County
- Baltimore City · 558,601 people
- City population
- 588,727
- Metro
- Baltimore-Columbia-Towson, MD
- Population (ZIP)
- 46,679
- Household income
- $60,047
- Rent vs Own
- Severe rent burden
- 2776.0
Population outlook (Baltimore County) Hauer SSP2
- Today (2025)
- 624,249 people
- By 2030
- 621,541 · -0.4%
- By 2040
- 609,756 · -2.3%
- By 2050
- 597,249 · -4.3%
- By 2075
- 552,236 · -11.5%
- By 2100
- 513,934 · -17.7%
Race, ethnicity, and origin ACS 2023
- Neighborhood character
- Predominantly Black (73%)
- Race & ethnicity
- Black 73% White 15% Hispanic / Latino 6% Two or more races 4% Asian 3%
- Hispanic origin (detail)
- Common ancestry
- Lithuanian 1% Romanian 1% Serbian 1%
- Foreign-born
- 5% · Canada, Philippines
- Languages at home
- 91% English-only · Spanish 4% Other Indo-European 2% Other Asian/Pacific 1%
Political lean MEDSL · Baltimore
- 2024 margin
- Solid D (+73.0) · D 85.2% · R 12.2% · Other 2.6%
- 2008→2024 swing
- -2.5pp toward R · 2008: 75.5pp · 2024: 73.0pp
- All cycles
- 2024: D+73.0 2020: D+76.6 2016: D+74.6 2012: D+76.4 2008: D+75.5
Not yet ingested
- Civics
- —
Market trends
- HPI YoY
- ▼ -259.07%
- Current HPI
- 226.896
- Rent YoY
- ▲ 5.38%
- Metro
- Baltimore-Columbia-Towson, MD
- State GDP YoY
- ▲ 2.97%
- F500 in state
- 12
Industry mix (Fortune 500 HQ in MD)
| Industry | F500 HQs | Revenue |
|---|---|---|
| Aerospace / Defense | 1 | $71B |
|
||
| Utilities | 1 | $25B |
|
||
| Hotels | 1 | $24B |
|
||
| Consumer Goods | 1 | $7B |
|
||
| Real Estate | 1 | $6B |
|
||
| Chemicals | 1 | $2B |
|
||
Price history
+2757.1% since first listed8 events — show timeline
- 2026-06-04 Sold (MLS) $160,000 BRIGHT MLS
- 2026-05-06 Pending — BRIGHT MLS
- 2026-04-30 Price Changed $160,000 BRIGHT MLS
- 2026-04-24 Listed $150,000 BRIGHT MLS
- 2025-10-13 Listing Removed — BRIGHT MLS
- 2025-09-26 Listed $110,000 BRIGHT MLS
- 2025-09-24 Sold (Public Records) $70,000 Public Records
- 1995-07-14 Sold (Public Records) $5,600 Public Records
Property tax history
+1.0%/yrLatest (2025): $2,145 · +49.7% YoY. Source: county tax records.
Cash-flow waterfall
monthlySold comps — $/sqft
last 12 mo · ≤1 miLoading sold comps…