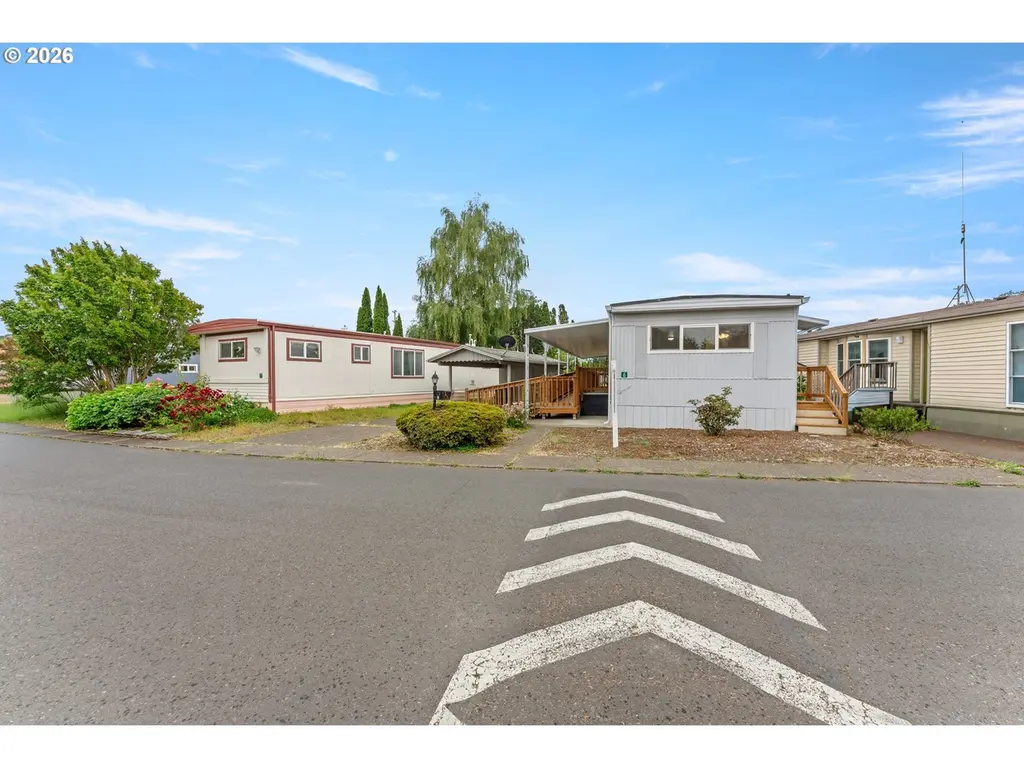
570 N 10th Ave #6 · Cornelius, OR
Flood risk 1/10 · Minimal
- FEMA flood zone
- X (unshaded)
- Chance of flooding over 30 yrs
- 0.0%
- Est. flood insurance / yr
- $507 – $1,088
Fire risk 3/10 · Minor
- Est. fire insurance / yr
- $498 – $926
Heat risk 3/10 · Minor
- Hot days now (above 92°F)
- 7 days/yr
- Hot days in 30 yrs
- 13 days/yr
Wind risk 1/10 · Minimal
- Chance of severe wind over 30 yrs
- —
Air-quality risk 7/10 · Major
- Unhealthy air days now
- 9 days/yr
- Unhealthy air days in 30 yrs
- 10 days/yr
Risk factors via First Street. Map © Google.
Why this score? — see what drove the B+ grade
The composite is a weighted blend of 9 inputs, each scored 0–100. Each bar is that input's sub-score; the figure is the points it added to the 100-point composite (weight × sub-score).
- Cash flow +30.0/30.0
- ARV discount +13.2/15.0
- 1% rule +10.0/10.0
- DSCR +10.0/10.0
- Livability +4.1/5.0
- Schools +3.6/10.0
- Rent growth +2.5/5.0
- Condition / age +2.5/5.0
- Appreciation +0.0/10.0
$49,900
🖨 Deal sheet (PDF) 📄 Offer letter ✓ Due diligence
Listing remarks
Welcome home to this beautifully remodeled single-wide manufactured home in a desirable 55+ community in the heart of Cornelius. This move-in-ready home features a new roof, new flooring, energy-efficient windows, stunning countertops, and a full set of newer appliances. The bright and inviting interior offers modern finishes and comfortable living spaces designed for easy maintenance and everyday enjoyment. Living here will give you clubhouse access featuring a library and fitness center, providing excellent opportunities for recreation and social activities. Monthly space rent is $1,305 and includes garbage service. Conveniently located near many local amenities. Schedule your showing tod
Key facts
- Fitness center
- Clubhouse access
- New roof
Tags
Property features AI
Finance
- Other: Property manufactured by Olympian; Main level living area approximately 812
- HOA & community: Park amenities include recreation facilities and trash service; Located in a senior community (Forest Hills Mobile Estates); Lot rent charged monthly
Exterior
- Parking: Covered carport
- Utilities: Public water; Public sewer; Electric service
- Home design: Manufactured home in a park (residential); Single-story (one level); Resale; No view
- Construction: Built in 1971; Skirting foundation; Membrane roof
- Exterior features: Tool shed; Yard; Paved road access; Metal siding
Interior
- Kitchen: Island; Quartz countertops; Dishwasher; Disposal; Free-standing range; Free-standing refrigerator
- Bedrooms: Primary bedroom (main level); Second bedroom (main level)
- Flooring: Laminate flooring
- Bathrooms: 1 full bathroom (main level)
- Heating & cooling: Forced air heating; Central air conditioning
- Interior features: Accessible approach with ramp; One-level living; Walk-in shower; Laminate flooring; Laundry area; Double pane windows with vinyl frames; Crawl space basement/skirting
- Laundry & utility: Laundry area; Electric hot water
Neighborhood map
What this means for you Summary
Snapshot
- This is a 2-bed/1.0-bath manufactured listed at $50k.
Deal economics
- At list price, monthly cash flow is $911 ($11k/yr) — positive.
- The deal already cash-flows at list — no discount required.
- Meets the 1% rule at list price ($2k rent vs $50k).
- Cap rate 28.2% vs local median 2.9% in Cornelius — top-decile yield for the area; either an underpriced asset or a hidden risk that comps aren't pricing in. Stress-test before assuming the spread holds.
Location & tenants
- Location reads 82/100 on livability (#47 in OR, #1,193 nationally) — a professional / high-income tenant draw. Strengths: commute A+, employment A+, housing A+; Watch: amenities C-, cost of living C-.
- Forest Grove SD 15 (suburban): math 32% / reading 46% proficiency, ranked #111 of 183 in OR (top 61%) — families likely to look elsewhere, expect single-tenant / working-renter base with shorter leases.
- Zoned schools: Echo Shaw Elementary School (377 students, 72% FRL); Neil Armstrong Middle School (math 24% / reading 75%, grade C, #26 of 128 statewide, top 21%, 826 students, 48% FRL); Forest Grove High School (1,977 students, 41% FRL) — zoned schools at 54% FRL track the district average.
- Market conditions: 113 active listings in the ZIP; 26 comparable units currently listed for rent nearby; rentals at typical pace (median 19d on market — plan ~3-4 weeks tenant-placement turnaround); 2,224 units permitted in Washington County in 2024 (242 in 5+ unit buildings).
Forward outlook
- Local home prices are declining (-3.0%/yr); year-one equity from $345 of loan paydown is wiped out by about $1k of value loss. Plan a longer hold.
- Washington County population projected at +33% by 2050 — long-run rental-demand tailwind backs the buy-and-hold thesis.
- At projected returns (-3.0% appreciation + 3.0% rent growth), your $14k cash investment doubles in ~2 years — after that, you're playing with house money.
Negotiation context
- Only 9 days on market — expect competitive offers; lowballing is unlikely to land.
- Current owner paid $22k; list at $50k implies a 127% gain — meaningful room to come down on a strong offer.
Questions for the listing agent
- Built in 1971 — when were the roof, HVAC, electrical panel, plumbing, and water heater last replaced?
- Is there a deadline driving the sale (1031 exchange, divorce, estate, relocation)? That informs how much negotiation room exists.
- Schools are F-rated, which usually means shorter tenancies and higher turnover. Who's the typical renter profile here, and what's been the actual vacancy rate?
- What's the average days-on-market for RENTAL listings here right now (not sales)? A rising rental-DOM trend means longer vacancies and softer asking-rent achievability than the comps imply.
- What's the recent tenant-quality profile in this submarket — average credit score on applications, eviction rate, late-payment / NSF rate, and stable-employment percentage? A property-management company in the area should have these aggregated.
- How much new for-sale + rental construction is in the pipeline within 1–3 miles? Heavy new supply typically softens prices + rents 12–24 months out; constrained supply supports both.
Investment metrics
- 1% rule
- 3.19% ✓
- Cap rate
- 28.21%
- Cash-on-cash
- 78.27%
- DSCR
- 4.48
- GRM
- 2.6
CMA / ARV
- ARV (on-the-fly)
- $57,120
- Comps found
- 4
Show comp detail 4 sales within ~0.75 mi
| Address | Dist | Beds/Ba | Sqft | Sold | Price | $/sf | Match |
|---|---|---|---|---|---|---|---|
| 570 N 10th Ave #75 | 0.00mi | 2/2.0 | 840 (0%) | 4mo | $16,000 | $19 | 92 |
| 507 N 19th Ave #2 | 0.35mi | 2/1.0 | 840 (0%) | 8mo | $30,000 | $36 | 77 |
| 507 N 19th Ave #39 | 0.35mi | 2/1.0 | 784 (-7%) | 16mo | $69,000 | $88 | 59 |
| 507 N 19th Ave #18 | 0.35mi | 2/1.0 | 960 (+14%) | 23mo | $65,000 | $68 | 40 |
Match score weights: distance 35% · size 25% · config 20% · recency 20%. Top-matched comps best support the ARV.
Projected returns pro-forma
-3.0% appreciation · 3.0% rent growth · sell at horizon
- IRR
- 78.3%
- Equity multiple
- 4.58×
- Total profit
- $49,980
- Equity at exit
- $7,440
- IRR
- 81.9%
- Equity multiple
- 9.47×
- Total profit
- $118,357
- Equity at exit
- $4,314
Cash invested: $13,972 (down + closing). Projections, not guarantees.
Landlord ↔ Tenant lean methodology
- Overall (STATE)
- 28 Tenant-Leaning
- State Oregon
- 28 Tenant-Leaning · D+6
- County
- — inherits STATE
- City
- — inherits STATE
ZIP-level market 97113
- Active inventory
- 113
- Price-to-rent
- 2.6×
Monthly cashflow live
- Estimated rent
- $1,590 high interval (Pro) →
- Mortgage (P&I)
- −$262
- Tax est. 1.5%
- −$62 /mo · $748/yr
- Insurance
- −$21
- HOA
- −$0
- Vacancy / Maint / Mgmt
- −$334
- Net cashflow
- $911
Break-even live
Sensitivity live
| Price | -10% $946 | -5% $929 | +0% $911 | +5% $894 | +10% $877 |
|---|---|---|---|---|---|
| Rent | -10% $786 | -5% $848 | +0% $911 | +5% $974 | +10% $1,037 |
| Rate | -1.0pp $936 | -0.5pp $924 | base $911 | +0.5pp $898 | +1.0pp $885 |
UW: 25.0% down · 7.5% · 30yr · 1.5% tax · 5.0% vac · 8.0% maint · 8.0% mgmt
Financing live
Cash to close
- Down payment
- $12,475
- Closing costs
- $1,497
- Reserves months
- —
- Total cash needed
- —
Loan-product check · same deal, 3 products live
Conventional
25% down · 7.5% · 30yr
- Down + closing
- —
- Monthly P&I
- —
- Monthly cashflow
- —
- DSCR
- —
- Eligible?
- —
Personal DTI + credit; lowest rate.
DSCR
20% down · 8.5% · 30yr
- Down + closing
- —
- Monthly P&I
- —
- Monthly cashflow
- —
- DSCR
- —
- Eligible?
- —
No personal income docs; deal must DSCR.
Hard money
10% down · 12.0% · 12mo
- Down + closing
- —
- Monthly P&I
- —
- Monthly cashflow
- —
- DSCR
- —
- Eligible?
- —
Short-term bridge; refi at stabilization.
Rent comps 26 comps
| Address | Beds | Baths | Sqft | Rent | $/sqft | DOM | Units | Dist |
|---|---|---|---|---|---|---|---|---|
| 1100 N Davis St Cornelius, OR | 2.0 | 1.0 | 750 | $1,645 | $2.19 | 0d | 2 | 0.16mi |
| 281 N 10th Ave Cornelius, OR | 1.0 | 1.0 | 585 | $1,350 | $2.31 | 3d | 3 | 0.30mi |
| 267 N 10th Ave Unit 125-11 Cornelius, OR | 1.0 | 1.0 | 687 | $1,375 | $2.00 | 9d | 1 | 0.30mi |
| 1250 E Baseline St Unit 4 Cornelius, OR | 2.0 | 1.0 | 700 | $1,280 | $1.83 | 6d | 1 | 0.40mi |
| 110 N 7th Ave Apt C Cornelius, OR | 2.0 | 2.0 | 1015 | $1,749 | $1.72 | 45d | 1 | 0.42mi |
| 120 N 7th Ave Unit D Cornelius, OR | 2.0 | 2.0 | 1015 | $1,699 | $1.67 | 45d | 1 | 0.42mi |
| 110 N 7th Ave Apt A Cornelius, OR | 2.0 | 2.0 | 1015 | $1,609 | $1.59 | 9d | 1 | 0.42mi |
| 100 N 7th Ave Apt B Cornelius, OR | 2.0 | 2.0 | 1015 | $1,599 | $1.58 | 16d | 1 | 0.43mi |
| 100 N 7th Ave Unit A Cornelius, OR | 2.0 | 2.0 | 1015 | $1,595 | $1.57 | 22d | 1 | 0.43mi |
| 101 N 7th Ave Apt D Cornelius, OR | 2.0 | 1.5 | 936 | $1,545 | $1.65 | 16d | 1 | 0.44mi |
| 101 N 7th Ave Unit C Cornelius, OR | 2.0 | 1.5 | 936 | $1,499 | $1.60 | 23d | 1 | 0.44mi |
| 299 N 5th Pl Cornelius, OR | 2.0 | 2.0 | 956 | $1,900 | $1.99 | 45d | 1 | 0.48mi |
| 522 N Adair St #16 Cornelius, OR | 1.0 | 1.0 | 600 | $1,250 | $2.08 | 45d | 1 | 0.52mi |
| 466 N Adair St #9 Cornelius, OR | 1.0 | 1.0 | 600 | $1,295 | $2.16 | 12d | 1 | 0.56mi |
| 130 N 4th Ave Apt 18 Cornelius, OR | 1.0 | 1.0 | 600 | $1,350 | $2.25 | 46d | 1 | 0.57mi |
| 130 N 4th Ave Apt 18 Cornelius, OR | 1.0 | 1.0 | 600 | $1,295 | $2.16 | 23d | 1 | 0.57mi |
| 184 S 5th Ave Unit 164 Cornelius, OR | 2.0 | 1.5 | 1114 | $1,795 | $1.61 | 16d | 1 | 0.63mi |
| 4300 Pacific Ave Forest Grove, OR | 2.0 | 1.5 | 950 | $1,645 | $1.73 | 0d | 5 | 0.86mi |
| 1318 S Ivy St Cornelius, OR | 2.0 | 1.0 | 816 | $1,795 | $2.20 | 25d | 1 | 0.87mi |
| 1330 S Ivy St Cornelius, OR | 2.0 | 1.0 | 816 | $1,745 | $2.14 | 25d | 1 | 0.87mi |
| 1367 S Ivy St Apt B Cornelius, OR | 2.0 | 1.0 | 800 | $1,550 | $1.94 | 45d | 1 | 0.92mi |
| 4204 Pacific Ave Forest Grove, OR | 2.0 | 1.0 | 900 | $1,500 | $1.67 | 3d | 1 | 0.92mi |
| 2795 N Clark Ct Cornelius, OR | 3.0 | 2.0 | 1100 | $2,295 | $2.09 | 19d | 1 | 1.01mi |
| 3802 Pacific Ave Forest Grove, OR | 2.0 | 1.0–2.0 | 945 | $2,035 | $2.15 | 0d | 11 | 1.20mi |
| 313 S Nectarine St Cornelius, OR | 3.0 | 2.0 | 1114 | $2,295 | $2.06 | 21d | 1 | 1.22mi |
| 1917 Poplar Pl Forest Grove, OR | 1.0–3.0 | 1.0–2.0 | 908 | $1,948 | $2.14 | 0d | 18 | 1.45mi |
Listing history 7 events
-
2026-06-15status $49,900 Pending 9 DOM
-
2026-06-13days on market $49,900 Active 9 DOM
-
2026-06-09days on market $49,900 Active 5 DOM
-
2026-06-08days on market $49,900 Active 4 DOM
-
2026-06-07days on market $49,900 Active 3 DOM
-
2026-06-05remarks 699-char remark
-
2026-06-05$49,900 Active 1 DOM
ⓘ Source: listings_history table (triggers on properties + properties_extension) + one-shot
backfill from property_details.listing_events for pre-trigger history.
Climate risk First Street
- Flood 1/10 Low FEMA zone X (unshaded) · 0% chance over 30 yrs
- Wildfire 3/10 Moderate
- Heat 3/10 Moderate 7 d/yr ≥92°F today · 13 d/yr by 30 yrs out
- Wind 1/10 Low
- Air quality 7/10 Severe 9 unhealthy d/yr today · 10 by 30 yrs out
Nearby sold comps map
Loading sold comps map…
Walkable amenities ~0.75 mi
Loading nearby amenities…
Taxation est. · year 1
- Rental income
- $19,081
- − Mortgage interest
- −$2,795
- − Property taxes
- −$748
- − Insurance
- −$250
- − Repairs & maintenance
- −$1,526
- − Management
- −$1,526
- − Depreciation
- −$1,452
- Taxable income
- $10,783
- Est. tax owed @ 24.0%
- −$2,588
- After-tax cash flow
- $8,348/yr
For passive investors: Depreciation is non-cash, so a rental often shows a tax loss while cash-flowing — sheltering income. Rental losses are passive: they offset passive income freely, and up to $25,000/yr can offset ordinary (W-2) income if you actively participate and your MAGI is under $100k (phasing out to $0 by $150k); unused losses carry forward. On sale, claimed depreciation is recaptured at up to 25%, and gains may owe capital-gains tax (a 1031 exchange can defer both). Figures are a year-1 estimate at your 24.0% rate — not tax advice; consult a CPA.
Schools (NCES district)
- District
- Forest Grove SD 15
- NCES district ID
- 4105160
- Math proficiency
- 32% ▼ -4.00%
- Reading proficiency
- 46% ▼ -4.00%
- Median HH income
- $52,159
- Composite
- 36.31/100
- National rank
- #9395
- State rank
- #111 of 183 in OR
Livability — Cornelius
- Score
- 82/100
- State rank
- #47
- US rank
- #1193
Category grades
Schools grade is shown separately in the Schools card above.
Census & demographics
- Census place
- Cornelius, OR
- Population (ZIP)
- 15,621
Population outlook (Washington County) Hauer SSP2
- Today (2025)
- 674,042 people
- By 2030
- 721,804 · +7.1%
- By 2040
- 812,732 · +20.6%
- By 2050
- 895,143 · +32.8%
- By 2075
- 1,058,806 · +57.1%
- By 2100
- 1,131,692 · +67.9%
Race, ethnicity, and origin ACS 2023
- Neighborhood character
- Diverse neighborhood (Simpson 0.57)
- Race & ethnicity
- Hispanic / Latino 47% White 46% Two or more races 13% Native American 4% Asian 2%
- Hispanic origin (detail)
- Mexican 42%
- Common ancestry
- Iranian 3% Italian 2% Portuguese 2%
- Foreign-born
- 24% · Canada, China, Vietnam
- Languages at home
- 55% English-only · Spanish 42% Other Indo-European 1% Chinese 1%
Political lean MEDSL · Washington
- 2024 margin
- Solid D (+34.0) · D 65.3% · R 31.3% · Other 3.4%
- 2008→2024 swing
- +11.8pp toward D · 2008: 22.1pp · 2024: 34.0pp
- All cycles
- 2024: D+34.0 2020: D+34.6 2016: D+26.7 2012: D+17.5 2008: D+22.1
Not yet ingested
- Civics
- —
Market trends
- HPI YoY
- ▼ -171.16%
- Current HPI
- 285.7514
- Rent YoY
- —
- Metro
- —
- State GDP YoY
- ▲ 2.05%
- F500 in state
- 2
Industry mix (Fortune 500 HQ in OR)
| Industry | F500 HQs | Revenue |
|---|---|---|
| Consumer Goods | 1 | $51B |
|
||
Price history
+299.2% since first listed3 events — show timeline
- 2026-06-04 Listed $49,900 RMLS
- 1994-09-22 Sold (Public Records) $22,000 Public Records
- 1991-03-01 Sold (Public Records) $12,500 Public Records
Property tax history
-36.9%/yrLatest (2015): $6 · +0.0% YoY. Source: county tax records.
Cash-flow waterfall
monthlySold comps — $/sqft
last 12 mo · ≤1 miLoading sold comps…