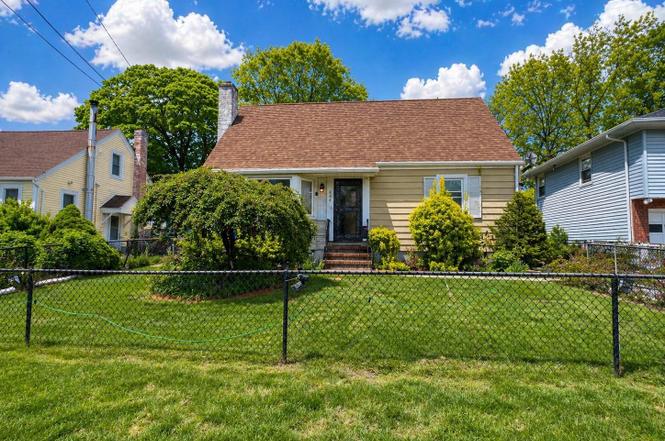
444 Brookside Ave · Roosevelt, NY
Flood risk 4/10 · Minor
- FEMA flood zone
- X (unshaded)
- Chance of flooding over 30 yrs
- 0.2%
- Est. flood insurance / yr
- $473 – $860
Fire risk 1/10 · Minimal
- Est. fire insurance / yr
- $691 – $1,283
Heat risk 6/10 · Moderate
- Hot days now (above 95°F)
- 7 days/yr
- Hot days in 30 yrs
- 16 days/yr
Wind risk 6/10 · Moderate
- Chance of severe wind over 30 yrs
- 57.0%
Air-quality risk 4/10 · Minor
- Unhealthy air days now
- 5 days/yr
- Unhealthy air days in 30 yrs
- 8 days/yr
Risk factors via First Street. Map © Google.
Why this score? — see what drove the D grade
The composite is a weighted blend of 9 inputs, each scored 0–100. Each bar is that input's sub-score; the figure is the points it added to the 100-point composite (weight × sub-score).
- ARV discount +15.0/15.0
- Cash flow +9.8/30.0
- Livability +3.7/5.0
- Schools +3.3/10.0
- 1% rule +3.2/10.0
- DSCR +2.8/10.0
- Rent growth +2.5/5.0
- Condition / age +2.5/5.0
- Appreciation +0.0/10.0
$450,000
🖨 Deal sheet (PDF) 📄 Offer letter ✓ Due diligence
Listing remarks
This 3-bedroom, 1-bath home offers a great opportunity for buyers looking to make a space their own. Featuring a semi-finished basement with a separate outside entrance, the home provides additional flexible space for storage, recreation, or future customization. A detached garage and a generously sized backyard add to the property’s appeal, offering both convenience and outdoor enjoyment. While the home would benefit from your personal updates and vision, it presents an excellent chance to create your ideal starter home or investment property.
Key facts
- 5,550 sq ft lot
- Garage
- Built 1951
Property features AI
Exterior
- Parking: Driveway; 1-car garage
- Utilities: Public sewer; Cable connected; Electricity connected; Natural gas connected; Water connected; Sewer connected
- Home design: Single family residence
- Construction: Aluminum siding and frame construction
- Exterior features: Aluminum siding; Frame construction; Not waterfront
Interior
- Kitchen: Range; Refrigerator; Dishwasher not listed
- Bedrooms: Bedroom on the first floor
- Bathrooms: 1 full bathroom
- Heating & cooling: Natural gas heating; Wall/window air conditioning unit(s)
- Interior features: First-floor bedroom; Partially finished walk-out basement; Crawl attic; 6 total rooms
- Laundry & utility: Washer; Dryer
Neighborhood map
What this means for you Summary
Snapshot
- This is a 3-bed/1.0-bath single-family listed at $450k.
Deal economics
- At list price, monthly cash flow is $-290 ($-3k/yr) — negative.
- To cash-flow at today's rent, offer at most $399k (11.4% below list).
- To meet the 1% rule (rent ≥ 1% of price), the offer needs to be $371k (17.5% below list).
- Recommended offer: $371k (17.5% below list) — sets the bar for 1% rule.
- Cap rate 5.5% vs local median 4.0% in Roosevelt — top-decile yield for the area; either an underpriced asset or a hidden risk that comps aren't pricing in. Stress-test before assuming the spread holds.
Location & tenants
- Location reads 73/100 on livability (#307 in NY) — a middle-class / working-renter tenant base. Strengths: commute A+, employment A+, housing A+; Watch: crime D+, amenities F, cost of living F.
- Roosevelt Union Free School District (suburban): math 28% / reading 45% proficiency, ranked #529 of 590 in NY (top 90%) — families likely to look elsewhere, expect single-tenant / working-renter base with shorter leases.
- Zoned schools: Centennial Avenue Elementary School (math 17% / reading 32%, grade F, #1,846 of 2,108 statewide, top 91%, 499 students, 50% FRL); Roosevelt Middle School (math 12% / reading 27%, grade F, #685 of 729 statewide, top 94%, 455 students, 0% FRL); Roosevelt High School (math 65% / reading 78%, grade B+, #698 of 1,100 statewide, top 63%, 1,075 students, 59% FRL) — zoned schools average 36% FRL vs 58% district-wide (22 pts lower); this property's tenant base skews higher-income than the district average.
- Market conditions: 52 active listings in the ZIP; 8 comparable units currently listed for rent nearby; rentals at typical pace (median 21d on market — plan ~3-4 weeks tenant-placement turnaround); 824 units permitted in Nassau County in 2024 (153 in 5+ unit buildings).
Forward outlook
- Local home prices are declining (-3.0%/yr); year-one equity from $3k of loan paydown is wiped out by about $14k of value loss. Plan a longer hold.
- Nassau County population projected at +7% by 2050 — modest demand growth; plan on rents tracking national, not racing it.
Negotiation context
- Only 5 days on market — expect competitive offers; lowballing is unlikely to land.
- Current owner paid $322k; 40% above their basis — modest negotiation headroom, anchor on the comps not their cost.
Risks & watch-outs
- Watch-outs: built in 1951 — expect roof / HVAC / electrical / plumbing capex.
- Climate carrying-cost: major wind risk, 57% chance of damaging wind over 30y; extreme-heat days projected 7→16/yr by 2055 (HVAC capex compounding) — expect insurance premiums to compound above CPI over the hold.
Questions for the listing agent
- What do current leases actually rent for vs. the listed asking? Can we see a recent rent roll and the last 12 months of T-12 income?
- Built in 1951 — when were the roof, HVAC, electrical panel, plumbing, and water heater last replaced?
- Is there a deadline driving the sale (1031 exchange, divorce, estate, relocation)? That informs how much negotiation room exists.
- Crime grade is D in this area — have there been break-ins, vandalism, or insurance claims at this property in the last 3 years? What carrier currently insures it and at what premium?
- The area grade is low — what's the realistic commute time and amenity access for the typical tenant pool here? Any planned neighborhood developments (good or bad) we should know about?
- What's the average days-on-market for RENTAL listings here right now (not sales)? A rising rental-DOM trend means longer vacancies and softer asking-rent achievability than the comps imply.
- What's the recent tenant-quality profile in this submarket — average credit score on applications, eviction rate, late-payment / NSF rate, and stable-employment percentage? A property-management company in the area should have these aggregated.
- How much new for-sale + rental construction is in the pipeline within 1–3 miles? Heavy new supply typically softens prices + rents 12–24 months out; constrained supply supports both.
Investment metrics
- 1% rule
- 0.82% ✗
- Cap rate
- 5.52%
- Cash-on-cash
- -2.77%
- DSCR
- 0.88
- GRM
- 10.1
CMA / ARV
- ARV (median comp)
- $724,183
- List price
- $450,000
- Delta
- -37.86%
- Verdict
- UNDERPRICED
- Comps
- 20 within 1.0 mi
Show comp detail 12 sales within ~0.75 mi
| Address | Dist | Beds/Ba | Sqft | Sold | Price | $/sf | Match |
|---|---|---|---|---|---|---|---|
| 293 Pennsylvania Ave | 0.08mi | 3/2.0 | 1,050 (-6%) | 5mo | $640,000 | $610 | 79 |
| 1040 Brookside Ave | 0.46mi | 3/2.0 | 1,100 (-1%) | 5mo | $694,000 | $631 | 69 |
| 36 Alhambra Rd | 0.28mi | 4/2.0 (+1) | 1,176 (+6%) | 8mo | $730,000 | $621 | 62 |
| 831 Dean Dr | 0.64mi | 3/2.0 | 1,147 (+3%) | 1mo | $690,000 | $602 | 60 |
| 7 Mayfair Rd | 0.43mi | 3/1.5 | 1,220 (+10%) | 4mo | $685,000 | $561 | 58 |
| 82 E Clinton Ave | 0.51mi | 3/2.0 | 1,204 (+8%) | 4mo | $588,000 | $488 | 55 |
| 84 E Greenwich Ave | 0.57mi | 4/2.0 (+1) | 1,176 (+6%) | 3mo | $670,000 | $570 | 52 |
| 181 East Clinton Ave | 0.72mi | 3/1.0 | 1,167 (+5%) | 8mo | $500,000 | $428 | 52 |
| 1009 Centennial Ave | 0.43mi | 4/2.0 (+1) | 1,268 (+14%) | 2mo | $559,500 | $441 | 46 |
| 994 Wallace Ave | 0.73mi | 2/2.0 (-1) | 1,184 (+6%) | 10mo | $660,000 | $557 | 38 |
| 1000 Cleveland St | 0.71mi | 4/2.0 (+1) | 1,253 (+13%) | 5mo | $731,000 | $583 | 33 |
| 95 Park Ave | 0.69mi | 2/1.0 (-1) | 961 (-14%) | 8mo | $400,000 | $416 | 33 |
Match score weights: distance 35% · size 25% · config 20% · recency 20%. Top-matched comps best support the ARV.
Projected returns pro-forma
-3.0% appreciation · 3.0% rent growth · sell at horizon
- IRR
- -20.9%
- Equity multiple
- 0.28×
- Total profit
- $-91,293
- Equity at exit
- $67,096
- IRR
- -14.1%
- Equity multiple
- 0.18×
- Total profit
- $-102,809
- Equity at exit
- $38,908
Cash invested: $126,000 (down + closing). Projections, not guarantees.
Landlord ↔ Tenant lean methodology
- Overall (STATE)
- 15 Strongly Tenant-Friendly
- State New York
- 15 Strongly Tenant-Friendly · D+10
- County
- — inherits STATE
- City
- — inherits STATE
ZIP-level market 11575
- Active inventory
- 52
- Price-to-rent
- 10.1×
Monthly cashflow live
- Estimated rent
- $3,711 high interval (Pro) →
- Mortgage (P&I)
- −$2,360
- Tax from tax record
- −$675 /mo · $8,101/yr
- Insurance
- −$188
- HOA
- −$0
- Vacancy / Maint / Mgmt
- −$779
- Net cashflow
- $-290
Break-even live
Sensitivity live
| Price | -10% $-36 | -5% $-163 | +0% $-290 | +5% $-418 | +10% $-545 |
|---|---|---|---|---|---|
| Rent | -10% $-584 | -5% $-437 | +0% $-290 | +5% $-144 | +10% $3 |
| Rate | -1.0pp $-64 | -0.5pp $-176 | base $-290 | +0.5pp $-407 | +1.0pp $-526 |
UW: 25.0% down · 7.5% · 30yr · 1.5% tax · 5.0% vac · 8.0% maint · 8.0% mgmt
Financing live
Cash to close
- Down payment
- $112,500
- Closing costs
- $13,500
- Reserves months
- —
- Total cash needed
- —
Loan-product check · same deal, 3 products live
Conventional
25% down · 7.5% · 30yr
- Down + closing
- —
- Monthly P&I
- —
- Monthly cashflow
- —
- DSCR
- —
- Eligible?
- —
Personal DTI + credit; lowest rate.
DSCR
20% down · 8.5% · 30yr
- Down + closing
- —
- Monthly P&I
- —
- Monthly cashflow
- —
- DSCR
- —
- Eligible?
- —
No personal income docs; deal must DSCR.
Hard money
10% down · 12.0% · 12mo
- Down + closing
- —
- Monthly P&I
- —
- Monthly cashflow
- —
- DSCR
- —
- Eligible?
- —
Short-term bridge; refi at stabilization.
Rent comps 8 comps
| Address | Beds | Baths | Sqft | Rent | $/sqft | DOM | Units | Dist |
|---|---|---|---|---|---|---|---|---|
| 21 W Centennial Ave Roosevelt, NY | 3.0 | 2.0 | 1176 | $3,600 | $3.06 | 21d | 1 | 0.55mi |
| 533 Greenwich St Unit 1D Hempstead, NY | 3.0 | 2.0 | 1103 | $4,000 | $3.63 | 45d | 1 | 1.13mi |
| 66 E Seaman Ave Freeport, NY | 3.0 | 2.5 | 1200 | $3,600 | $3.00 | 45d | 1 | 1.31mi |
| 840 Seaman Ave Unit 2w Baldwin, NY | 2.0 | 1.0 | 850 | $2,500 | $2.94 | 15d | 1 | 1.31mi |
| 650 Winthrop Dr Uniondale, NY | 3.0 | 3.0 | 1300 | $4,900 | $3.77 | 0d | 1 | 1.40mi |
| 1000 Brix Pl Uniondale, NY | 1.0–2.0 | 1.0–2.0 | 710 | $3,662 | $5.16 | 0d | 13 | 1.44mi |
| 196 E Seaman Ave Freeport, NY | 3.0 | 2.5 | 1062 | $8,500 | $8.00 | 18d | 1 | 1.46mi |
| 529 Maple Ave Unit Second Floor Uniondale, NY | 3.0 | 2.0 | 1240 | $3,750 | $3.02 | 26d | 1 | 1.48mi |
Listing history 5 events
-
2026-06-17statusdays on market $450,000 Pending 5 DOM
-
2026-04-30$450,000 Active
-
2005-12-16soldstatus $322,000
-
1996-09-09soldstatus $97,000
-
1979-07-01soldstatus $23,741
ⓘ Source: listings_history table (triggers on properties + properties_extension) + one-shot
backfill from property_details.listing_events for pre-trigger history.
Tax reassessment forecast NY · Partial reset (capped growth)
- Current annual tax
- $8,101 · $675/mo
- Projected year-2 tax
- $8,101 · $675/mo
- Expected delta
- $0/yr ($0/mo · 0.0%)
ⓘ Screening estimate from a state-policy table — verify with the county assessor before closing.
Climate risk First Street
- Flood 4/10 Moderate FEMA zone X (unshaded) · 20% chance over 30 yrs
- Wildfire 1/10 Low
- Heat 6/10 Major 7 d/yr ≥95°F today · 16 d/yr by 30 yrs out
- Wind 6/10 Major 57% chance of damaging wind over 30 yrs
- Air quality 4/10 Moderate 5 unhealthy d/yr today · 8 by 30 yrs out
Nearby sold comps map
Loading sold comps map…
Walkable amenities ~0.75 mi
Loading nearby amenities…
Taxation est. · year 1
- Rental income
- $44,536
- − Mortgage interest
- −$25,207
- − Property taxes
- −$8,101
- − Insurance
- −$2,250
- − Repairs & maintenance
- −$3,563
- − Management
- −$3,563
- − Depreciation
- −$13,091
- Taxable loss
- −$11,238
- Est. tax savings @ 24.0%
- +$2,697
- After-tax cash flow
- $-788/yr
For passive investors: Depreciation is non-cash, so a rental often shows a tax loss while cash-flowing — sheltering income. Rental losses are passive: they offset passive income freely, and up to $25,000/yr can offset ordinary (W-2) income if you actively participate and your MAGI is under $100k (phasing out to $0 by $150k); unused losses carry forward. On sale, claimed depreciation is recaptured at up to 25%, and gains may owe capital-gains tax (a 1031 exchange can defer both). Figures are a year-1 estimate at your 24.0% rate — not tax advice; consult a CPA.
Schools (NCES district)
- District
- Roosevelt Union Free School District
- NCES district ID
- 3624990
- Math proficiency
- 28% ▼ -4.00%
- Reading proficiency
- 45% ▲ 6.00%
- Median HH income
- $69,717
- Composite
- 33.41/100
- National rank
- #5472
- State rank
- #529 of 590 in NY
Livability — Roosevelt
- Score
- 73/100
- State rank
- #307
- US rank
- #5074
Category grades
Schools grade is shown separately in the Schools card above.
Census & demographics
- Census place
- Roosevelt, NY
- City population
- 19,430
- Population (ZIP)
- 19,430
Population outlook (Nassau County) Hauer SSP2
- Today (2025)
- 1,409,302 people
- By 2030
- 1,431,482 · +1.6%
- By 2040
- 1,471,607 · +4.4%
- By 2050
- 1,502,845 · +6.6%
- By 2075
- 1,575,403 · +11.8%
- By 2100
- 1,554,356 · +10.3%
Race, ethnicity, and origin ACS 2023
- Neighborhood character
- Diverse neighborhood (Simpson 0.55)
- Race & ethnicity
- Black 53% Hispanic / Latino 41% Two or more races 7% Asian 2% White 1%
- Hispanic origin (detail)
- Puerto Rican 6% Dominican 4%
- Common ancestry
- Hispanic 4%
- Foreign-born
- 36% · Canada, Jamaica, South Korea
- Languages at home
- 60% English-only · Spanish 34% French/Haitian/Cajun 4% Other Indo-European 2%
Political lean MEDSL · Nassau
- 2024 margin
- Toss-up / Even · D 47.9% · R 52.1%
- 2008→2024 swing
- -12.6pp toward R · 2008: 8.4pp · 2024: -4.2pp
- All cycles
- 2024: R+4.2 2020: D+9.5 2016: D+5.3 2012: D+6.7 2008: D+8.4
Not yet ingested
- Civics
- —
Market trends
- HPI YoY
- ▼ -368.53%
- Current HPI
- 364.7467
- Rent YoY
- —
- Metro
- —
- State GDP YoY
- ▲ 2.60%
- F500 in state
- 92
Industry mix (Fortune 500 HQ in NY)
| Industry | F500 HQs | Revenue |
|---|---|---|
| Financial Services | 10 | $950B |
|
||
| Consumer Goods | 9 | $162B |
|
||
| Insurance | 4 | $225B |
|
||
| Telecommunications | 2 | $144B |
|
||
| Pharmaceuticals | 2 | $112B |
|
||
| Media / Entertainment | 2 | $69B |
|
||
Price history
+1795.5% since first listed5 events — show timeline
- 2026-06-17 Pending — OneKey® MLS as Distributed by MLS Grid
- 2026-04-30 Listed $450,000 OneKey® MLS as Distributed by MLS Grid
- 2005-12-16 Sold (Public Records) $322,000 Public Records
- 1996-09-09 Sold (Public Records) $97,000 Public Records
- 1979-07-01 Sold (Public Records) $23,741 Public Records
Property tax history
+2.1%/yrLatest (2024): $8,101 · +4.2% YoY. Source: county tax records.
Cash-flow waterfall
monthlySold comps — $/sqft
last 12 mo · ≤1 miLoading sold comps…