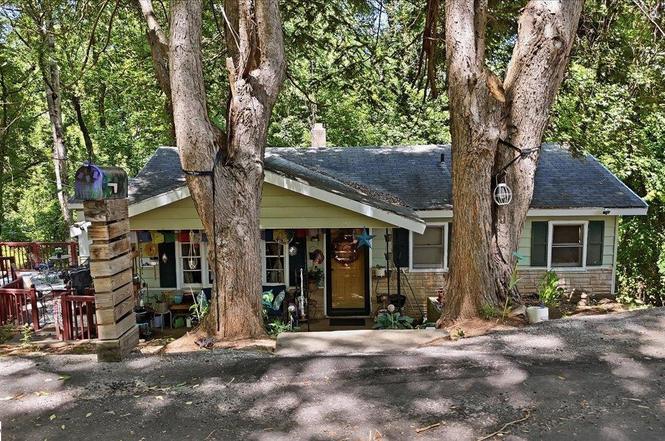
76 Bomar St · Inman, SC
Flood risk 1/10 · Minimal
- FEMA flood zone
- X (unshaded)
- Chance of flooding over 30 yrs
- 0.0%
- Est. flood insurance / yr
- $473 – $860
Fire risk 3/10 · Minor
- Est. fire insurance / yr
- $783 – $1,453
Heat risk 5/10 · Moderate
- Hot days now (above 105°F)
- 7 days/yr
- Hot days in 30 yrs
- 17 days/yr
Wind risk 2/10 · Minimal
- Chance of severe wind over 30 yrs
- 1.0%
Air-quality risk 3/10 · Minor
- Unhealthy air days now
- 3 days/yr
- Unhealthy air days in 30 yrs
- 3 days/yr
Risk factors via First Street. Map © Google.
Why this score? — see what drove the B- grade
The composite is a weighted blend of 9 inputs, each scored 0–100. Each bar is that input's sub-score; the figure is the points it added to the 100-point composite (weight × sub-score).
- Cash flow +23.7/30.0
- ARV discount +15.0/15.0
- DSCR +7.6/10.0
- 1% rule +6.6/10.0
- Schools +4.1/10.0
- Livability +3.7/5.0
- Rent growth +2.9/5.0
- Condition / age +2.5/5.0
- Appreciation +0.0/10.0
$120,000
🖨 Deal sheet (PDF) 📄 Offer letter ✓ Due diligence
Listing remarks MLS
Welcome to 76 Bomar St. , Inman, SC — a residence offering a blend of comfort, simplicity, and the embrace of natural elements. This home is poised on a peaceful street and is framed by mature trees, whose broad canopies provide not only an aesthetic delight but functional shade to enhance the outdoor experience. The exterior presents a classic facade with sturdy brickwork complementing the low-maintenance vinyl siding. An inviting front porch sets the stage for warm welcomes, providing the perfect spot for enjoying the gentle rustle of leaves in the tree-lined yard. The surrounding greenery and landscaping potential add to the curb appeal, hinting at the nurturing of past and future growth. Inside, you’ll find a cozily designed living space that invites family gatherings and relaxation. The heart of the home, the kitchen, features ample cabinetry and a functional layout that awaits your culinary explorations. It’s a space that promises shared meals and conversations, set against the backdrop of natural light streaming through the traditional window dressing. Adjacent to the kitchen, the living area provides a spacious retreat with walls that bring a sense of warmth and familiarity. This versatile space invites personalization and could very well become the backdrop for many cherished memories. Each room flows seamlessly into the next, creating a sense of unity throughout the home. While the photographic depiction of the interior shows a furnished state, the true potential lies in the architectural features and layout of the property. The prospective homeowner can look forward to infusing their unique style into the home, as it stands ready to support a diverse array of interior design preferences. Every aspect of this property, from its practical floor plan to the serene outdoor setting, is a testament to a home that has been a foundation for daily life, offering a blank canvas for new beginnings. This is a dwelling that doesn’t just provide shelter but suggests a lifestyle choice that values simplicity, peace, and an affinity with nature’s beauty. As this chapter in the home’s story concludes, 76 Bomar St. awaits its next custodians, who will build upon its legacy by creating moments and memories uniquely their own.
Key facts
- Peaceful serene view
- Walk-in laundry area
- Oversized deck
Tags
Property features AI
Finance
- HOA & community: No HOA fees
Exterior
- Parking: Driveway (see remarks for garage/parking details)
- Utilities: Public water; Electric water heater; Public sewer; Public garbage pickup; Electric service
- Home design: Single-story residence; Built around 1960; Crawl space foundation; Corner lot that slopes gently with some trees and wooded areas; Lot is half an acre or smaller
- Construction: Wood exterior; Composition shingle roof
- Exterior features: Front porch; Deck; Some storm doors
Interior
- Kitchen: Kitchen approx. 13 x 9; Refrigerator; Electric oven
- Bedrooms: Primary bedroom on the main level (approx. 10 x 11); Second bedroom approx. 10 x 9; Third bedroom approx. 8 x 9; Three main-level bedrooms
- Flooring: Carpet; Hardwood/pine subfloor under carpet; Vinyl flooring
- Bathrooms: One full bathroom (on main level)
- Heating & cooling: Electric heating; Heat pump; Heat pump cooling
- Interior features: Cable available; Ceiling fans; Blown ceiling insulation; Smoke detector; Laminate countertops; Fireplace: none
- Laundry & utility: Laundry on first floor; Walk-in laundry area; Washer connection; Electric dryer hookup
Neighborhood map
What this means for you Summary
Snapshot
- This is a 2-bed/1.0-bath single-family listed at $120k.
Deal economics
- At list price, monthly cash flow is $228 ($3k/yr) — positive.
- The deal already cash-flows at list — no discount required.
- Meets the 1% rule at list price ($1k rent vs $120k).
- Cap rate 8.6% vs local median 4.3% in Inman — top-decile yield for the area; either an underpriced asset or a hidden risk that comps aren't pricing in. Stress-test before assuming the spread holds.
Location & tenants
- Location reads 74/100 on livability (#29 in SC, #4,452 nationally) — a middle-class / working-renter tenant base. Strengths: cost of living A+, housing A+, health & safety A+; Watch: amenities D, commute F.
- Spartanburg 01 (rural): math 44% / reading 53% proficiency, ranked #14 of 80 in SC (top 18%) — families likely to look elsewhere, expect single-tenant / working-renter base with shorter leases.
- Zoned schools: Inman Elementary (math 57% / reading 47%, grade C-, #145 of 597 statewide, top 26%, 615 students, 100% FRL); T.E. Mabry Middle (math 31% / reading 43%, grade F, #97 of 229 statewide, top 42%, 444 students, 73% FRL); Chapman High (math 42% / reading 88%, grade B, #85 of 196 statewide, top 45%, 1,046 students, 59% FRL) — zoned schools average 77% FRL vs 45% district-wide (33 pts higher); higher-poverty schools than district average — tighter screening recommended.
- Market conditions: Rents rising (+1.8%/yr); 703 active listings in the ZIP; 1 comparable units currently listed for rent nearby; solid renter incomes; 3,129 units permitted in Spartanburg County in 2024 (40 in 5+ unit buildings).
Forward outlook
- Local home prices are declining (-3.0%/yr); year-one equity from $830 of loan paydown is wiped out by about $4k of value loss. Plan a longer hold.
- Spartanburg County population projected at +18% by 2050 — long-run rental-demand tailwind backs the buy-and-hold thesis.
Negotiation context
- Only 6 days on market — expect competitive offers; lowballing is unlikely to land.
- 3 sale attempts since 2y ago with the ask held roughly flat each time — persistent listings suggest the price (not the market) is what's stuck; bring a comps-based counter.
- Current owner paid $100k; 20% above their basis — modest negotiation headroom, anchor on the comps not their cost.
Risks & watch-outs
- Climate carrying-cost: extreme-heat days projected 7→17/yr by 2055 (HVAC capex compounding) — expect insurance premiums to compound above CPI over the hold.
Questions for the listing agent
- Built in 1960 — when were the roof, HVAC, electrical panel, plumbing, and water heater last replaced?
- Is there a deadline driving the sale (1031 exchange, divorce, estate, relocation)? That informs how much negotiation room exists.
- What's the average days-on-market for RENTAL listings here right now (not sales)? A rising rental-DOM trend means longer vacancies and softer asking-rent achievability than the comps imply.
- What's the recent tenant-quality profile in this submarket — average credit score on applications, eviction rate, late-payment / NSF rate, and stable-employment percentage? A property-management company in the area should have these aggregated.
- How much new for-sale + rental construction is in the pipeline within 1–3 miles? Heavy new supply typically softens prices + rents 12–24 months out; constrained supply supports both.
Investment metrics
- 1% rule
- 1.16% ✓
- Cap rate
- 8.57%
- Cash-on-cash
- 8.13%
- DSCR
- 1.36
- GRM
- 7.2
CMA / ARV
- ARV (on-the-fly)
- $151,844
- Comps found
- 6
Show comp detail 6 sales within ~0.75 mi
| Address | Dist | Beds/Ba | Sqft | Sold | Price | $/sf | Match |
|---|---|---|---|---|---|---|---|
| 27 Bobo St | 0.23mi | 3/1.0 (+1) | 800 (+7%) | 14mo | $85,000 | $106 | 61 |
| 371 Waters Rd | 0.16mi | 2/1.0 | 832 (+11%) | 23mo | $170,000 | $204 | 55 |
| 411 Waters Road Rd | 0.26mi | 2/1.0 | 832 (+11%) | 23mo | $169,200 | $203 | 50 |
| 84 N Main St | 0.73mi | 2/1.0 | 675 (-10%) | 0mo | $140,000 | $207 | 50 |
| 60 N Humphrey St | 0.66mi | 2/1.0 | 824 (+10%) | 11mo | $154,000 | $187 | 43 |
| 27 Culp St | 0.63mi | 2/1.0 | 840 (+12%) | 13mo | $63,000 | $75 | 39 |
Match score weights: distance 35% · size 25% · config 20% · recency 20%. Top-matched comps best support the ARV.
Projected returns pro-forma
-3.0% appreciation · 1.79% rent growth · sell at horizon
- IRR
- -5.3%
- Equity multiple
- 0.80×
- Total profit
- $-6,567
- Equity at exit
- $17,892
- IRR
- 2.8%
- Equity multiple
- 1.19×
- Total profit
- $6,446
- Equity at exit
- $10,375
Cash invested: $33,600 (down + closing). Projections, not guarantees.
Landlord ↔ Tenant lean methodology
- Overall (STATE)
- 90 Strongly Landlord-Friendly
- State South Carolina
- 90 Strongly Landlord-Friendly · R+6
- County
- — inherits STATE
- City
- — inherits STATE
ZIP-level market 29349
- Home prices YoY
- -31.8%
- Rents YoY
- 1.8%
- Active inventory
- 703
- Price-to-rent
- 7.2×
Monthly cashflow live
- Estimated rent
- $1,392 medium interval (Pro) →
- Mortgage (P&I)
- −$629
- Tax from tax record
- −$193 /mo · $2,311/yr
- Insurance
- −$50
- HOA
- −$0
- Lot rent
- −$0
- Vacancy / Maint / Mgmt
- −$292
- Net cashflow
- $228
Break-even live
Sensitivity live
| Price | -10% $296 | -5% $262 | +0% $228 | +5% $194 | +10% $160 |
|---|---|---|---|---|---|
| Rent | -10% $118 | -5% $173 | +0% $228 | +5% $283 | +10% $338 |
| Rate | -1.0pp $288 | -0.5pp $258 | base $228 | +0.5pp $197 | +1.0pp $165 |
UW: 25.0% down · 7.5% · 30yr · 1.5% tax · 5.0% vac · 8.0% maint · 8.0% mgmt
Financing live
Cash to close
- Down payment
- $30,000
- Closing costs
- $3,600
- Reserves months
- —
- Total cash needed
- —
Loan-product check · same deal, 3 products live
Conventional
25% down · 7.5% · 30yr
- Down + closing
- —
- Monthly P&I
- —
- Monthly cashflow
- —
- DSCR
- —
- Eligible?
- —
Personal DTI + credit; lowest rate.
DSCR
20% down · 8.5% · 30yr
- Down + closing
- —
- Monthly P&I
- —
- Monthly cashflow
- —
- DSCR
- —
- Eligible?
- —
No personal income docs; deal must DSCR.
Hard money
10% down · 12.0% · 12mo
- Down + closing
- —
- Monthly P&I
- —
- Monthly cashflow
- —
- DSCR
- —
- Eligible?
- —
Short-term bridge; refi at stabilization.
Rent comps 1 comps
| Address | Beds | Baths | Sqft | Rent | $/sqft | DOM | Units | Dist |
|---|---|---|---|---|---|---|---|---|
| 240 4th St Inman, SC | 1.0–3.0 | 1.0–2.0 | 1356 | $1,482 | $1.09 | 5d | 12 | 1.16mi |
Listing history 5 events
-
2026-06-22days on market $120,000 Active 6 DOM
-
2026-06-22days on market $120,000 Active 5 DOM
-
2026-06-18days on market $120,000 Active 2 DOM
-
2026-06-16remarks 699-char remark
-
2026-06-16$120,000 Active 1 DOM
ⓘ Source: listings_history table (triggers on properties + properties_extension) + one-shot
backfill from property_details.listing_events for pre-trigger history.
Tax reassessment forecast SC · Resets to sale price
- Current annual tax
- $2,311 · $193/mo
- Projected year-2 tax
- $2,311 · $193/mo
- Expected delta
- $0/yr ($0/mo · 0.0%)
ⓘ Screening estimate from a state-policy table — verify with the county assessor before closing.
Climate risk First Street
- Flood 1/10 Low FEMA zone X (unshaded) · 0% chance over 30 yrs
- Wildfire 3/10 Moderate
- Heat 5/10 Major 7 d/yr ≥105°F today · 17 d/yr by 30 yrs out
- Wind 2/10 Low 100% chance of damaging wind over 30 yrs
- Air quality 3/10 Moderate 3 unhealthy d/yr today · 3 by 30 yrs out
Nearby sold comps map
Loading sold comps map…
Walkable amenities ~0.75 mi
Loading nearby amenities…
Taxation est. · year 1
- Rental income
- $16,703
- − Mortgage interest
- −$6,722
- − Property taxes
- −$2,311
- − Insurance
- −$600
- − Repairs & maintenance
- −$1,336
- − Management
- −$1,336
- − Depreciation
- −$3,491
- Taxable income
- $907
- Est. tax owed @ 24.0%
- −$218
- After-tax cash flow
- $2,515/yr
For passive investors: Depreciation is non-cash, so a rental often shows a tax loss while cash-flowing — sheltering income. Rental losses are passive: they offset passive income freely, and up to $25,000/yr can offset ordinary (W-2) income if you actively participate and your MAGI is under $100k (phasing out to $0 by $150k); unused losses carry forward. On sale, claimed depreciation is recaptured at up to 25%, and gains may owe capital-gains tax (a 1031 exchange can defer both). Figures are a year-1 estimate at your 24.0% rate — not tax advice; consult a CPA.
Schools (NCES district)
- District
- Spartanburg 01
- NCES district ID
- 4503480
- Math proficiency
- 44% ▼ -11.00%
- Reading proficiency
- 53% ▼ -1.00%
- Median HH income
- $44,612
- Composite
- 41.0/100
- National rank
- #3590
- State rank
- #14 of 80 in SC
Livability — Inman
- Score
- 74/100
- State rank
- #29
- US rank
- #4452
Category grades
Schools grade is shown separately in the Schools card above.
Census & demographics
- County
- Spartanburg County · 258,607 people
- City population
- 39,083
- Metro
- Spartanburg, SC
- Population (ZIP)
- 39,083
- Household income
- $76,168
- Rent vs Own
- Severe rent burden
- 271.0
Population outlook (Spartanburg County) Hauer SSP2
- Today (2025)
- 325,495 people
- By 2030
- 338,800 · +4.1%
- By 2040
- 363,471 · +11.7%
- By 2050
- 384,156 · +18.0%
- By 2075
- 430,137 · +32.1%
- By 2100
- 442,733 · +36.0%
Race, ethnicity, and origin ACS 2023
- Neighborhood character
- Predominantly White (80%)
- Race & ethnicity
- White 80% Black 9% Hispanic / Latino 6% Two or more races 4% Asian 2%
- Hispanic origin (detail)
- Mexican 5%
- Common ancestry
- Subsaharan African 6% Serbian 3% Scotch-Irish 3%
- Foreign-born
- 9% · Canada
- Languages at home
- 86% English-only · Russian/Polish/Slavic 7% Spanish 3% Other Asian/Pacific 2%
Political lean MEDSL · Spartanburg
- 2024 margin
- Solid R (+33.6) · D 32.6% · R 66.2% · Other 1.2%
- 2008→2024 swing
- -12.0pp toward R · 2008: -21.6pp · 2024: -33.6pp
- All cycles
- 2024: R+33.6 2020: R+27.3 2016: R+30.0 2012: R+23.1 2008: R+21.6
Not yet ingested
- Civics
- —
Market trends
- HPI YoY
- ▼ -113.67%
- Current HPI
- 244.0359
- Rent YoY
- ▲ 1.79%
- Metro
- Spartanburg, SC
- State GDP YoY
- ▲ 4.51%
- F500 in state
- 2
Industry mix (Fortune 500 HQ in SC)
| Industry | F500 HQs | Revenue |
|---|---|---|
| Packaging | 1 | $7B |
|
||
Price history
+14.4% since first listed8 events — show timeline
- 2026-06-16 Listed $120,000 Greater Greenville MLS
- 2024-12-02 Sold (Public Records) $100,000 Public Records
- 2024-11-26 Sold (MLS) $100,000 Greater Greenville MLS
- 2024-11-26 Sold (MLS) $100,000 SPMLS
- 2024-09-21 Pending — Greater Greenville MLS
- 2024-09-21 Pending — SPMLS
- 2024-08-26 Listed $104,900 Greater Greenville MLS
- 2024-08-26 Listed $104,900 SPMLS
Property tax history
+20.1%/yrLatest (2025): $2,311 · +2101.0% YoY. Source: county tax records.
Cash-flow waterfall
monthlySold comps — $/sqft
last 12 mo · ≤1 miLoading sold comps…