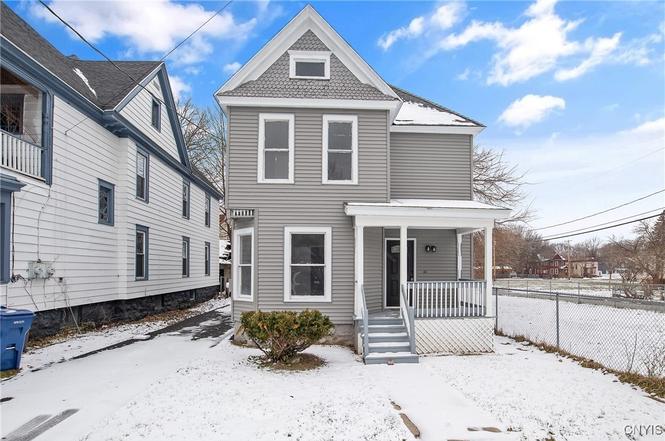
304 Baker Ave · Syracuse, NY
Flood risk 1/10 · Minimal
- FEMA flood zone
- X (unshaded)
- Chance of flooding over 30 yrs
- 0.0%
- Est. flood insurance / yr
- $473 – $860
Fire risk 1/10 · Minimal
- Est. fire insurance / yr
- $691 – $1,283
Heat risk 3/10 · Minor
- Hot days now (above 95°F)
- 7 days/yr
- Hot days in 30 yrs
- 16 days/yr
Wind risk 1/10 · Minimal
- Chance of severe wind over 30 yrs
- 0.0%
Air-quality risk 2/10 · Minimal
- Unhealthy air days now
- 0 days/yr
- Unhealthy air days in 30 yrs
- 1 days/yr
Risk factors via First Street. Map © Google.
Why this score? — see what drove the B grade
The composite is a weighted blend of 9 inputs, each scored 0–100. Each bar is that input's sub-score; the figure is the points it added to the 100-point composite (weight × sub-score).
- Cash flow +29.0/30.0
- DSCR +10.0/10.0
- Appreciation +10.0/10.0
- ARV discount +7.5/15.0
- 1% rule +7.2/10.0
- Livability +3.9/5.0
- Rent growth +2.5/5.0
- Condition / age +2.5/5.0
- Schools +1.8/10.0
$159,900
🖨 Deal sheet 📄 Offer letter ✓ Due diligence
Listing remarks
Entirely newly renovated two-family home located on a quiet, well-maintained street in Syracuse’s Southside neighborhood. The property features separate gas meters, electrical panels, and in-unit laundry hookups, allowing for fully separate utilities for each unit. Both apartments offer 2 bedrooms and 1 full bathroom, with comfortable living spaces and private utilities. Each unit also includes a full eat-in kitchen and provides ample additional storage space. New appliances—includes stoves/ovens and refrigerators—will be installed in both units. Please note, utilities are currently turned off. Conveniently situated near public transportation, schools, and local amenities,
Key facts
- Full eat-in kitchens
- 2 parking spots
- Built 1890
Tags
Neighborhood map
What this means for you Summary
Snapshot
- This is a 4-bed/2.0-bath townhouse listed at $160k.
Deal economics
- At list price, monthly cash flow is $549 ($7k/yr) — positive.
- The deal already cash-flows at list — no discount required.
- Meets the 1% rule at list price ($2k rent vs $160k).
- Recommended offer: $155k (3.0% below list) — sets the bar for market timing.
- Cap rate 10.4% vs local median 8.2% in Syracuse — meaningfully above typical; check what's discounted (condition, days-on-market, listing class) to confirm the premium yield is real.
Location & tenants
- Location reads 77/100 on livability (#187 in NY, #2,869 nationally) — a middle-class / working-renter tenant base. Strengths: amenities A+, commute A+, cost of living A+; Watch: schools D+, crime F, employment D-.
- Syracuse City School District (urban): math 18% / reading 26% proficiency, ranked #590 of 590 in NY (top 100%) — low school quality limits family demand, transient renter base, plan for 1-2y turnover; 74% free/reduced lunch — lower-income household profile, screen leases tightly.
- Market conditions: 67 active listings in the ZIP; 16 comparable units currently listed for rent nearby; rentals lingering (median 44d on market — plan ~5-8 weeks vacancy on turnover, expect pricing pressure); 50% of comp listings sitting > 30 days — soft ceiling on asking rent; 616 units permitted in Onondaga County in 2024 (256 in 5+ unit buildings).
Forward outlook
- In year one you build about $17k of equity ($1k loan paydown + $16k appreciation (10.0% local appreciation)).
- Onondaga County population projected to shrink 9% by 2050 — rents likely to lag national; underwrite the cash flow, not the appreciation.
- At projected returns (10.0% appreciation + 3.0% rent growth), your $45k cash investment doubles in ~2 years — after that, you're playing with house money.
- By year 3, paydown + projected appreciation supports a ~$43k cash-out refi (75% LTV) — recoverable capital for the next deal without selling this one.
Negotiation context
- It's been on market 50 days — a 3% lower offer ($155k) is reasonable based on typical stale-listing flexibility.
- 5 sale attempts since 7y ago with the ask held roughly flat each time — persistent listings suggest the price (not the market) is what's stuck; bring a comps-based counter.
Risks & watch-outs
- Watch-outs: built in 1890 — expect roof / HVAC / electrical / plumbing capex.
Questions for the listing agent
- It's been on market 50 days. Have you received any prior offers? Is the seller open to a 3% concession, seller financing, or rate buy-down credit?
- Built in 1890 — when were the roof, HVAC, electrical panel, plumbing, and water heater last replaced?
- Is there a deadline driving the sale (1031 exchange, divorce, estate, relocation)? That informs how much negotiation room exists.
- Schools are D-rated, which usually means shorter tenancies and higher turnover. Who's the typical renter profile here, and what's been the actual vacancy rate?
- Crime grade is F in this area — have there been break-ins, vandalism, or insurance claims at this property in the last 3 years? What carrier currently insures it and at what premium?
- What's the average days-on-market for RENTAL listings here right now (not sales)? A rising rental-DOM trend means longer vacancies and softer asking-rent achievability than the comps imply.
- What's the recent tenant-quality profile in this submarket — average credit score on applications, eviction rate, late-payment / NSF rate, and stable-employment percentage? A property-management company in the area should have these aggregated.
- How much new for-sale + rental construction is in the pipeline within 1–3 miles? Heavy new supply typically softens prices + rents 12–24 months out; constrained supply supports both.
Investment metrics
- 1% rule
- 1.22% ✓
- Cap rate
- 10.41%
- Cash-on-cash
- 14.70%
- DSCR
- 1.65
- GRM
- 6.8
CMA / ARV
No comps found within radius.
Projected returns pro-forma
10.0% appreciation · 3.0% rent growth · sell at horizon
- IRR
- 35.1%
- Equity multiple
- 3.72×
- Total profit
- $121,989
- Equity at exit
- $144,051
- IRR
- 30.2%
- Equity multiple
- 8.41×
- Total profit
- $331,682
- Equity at exit
- $310,651
Cash invested: $44,772 (down + closing). Projections, not guarantees.
Landlord ↔ Tenant lean methodology
- Overall (STATE)
- 15 Strongly Tenant-Friendly
- State New York
- 15 Strongly Tenant-Friendly · D+10
- County
- — inherits STATE
- City
- — inherits STATE
ZIP-level market 13205
- Home prices YoY
- 3.0%
- Active inventory
- 67
- Price-to-rent
- 6.8×
Monthly cashflow live
- Estimated rent
- $1,952 high interval (Pro) →
- Mortgage (P&I)
- −$839
- Tax from tax record
- −$88 /mo · $1,060/yr
- Insurance
- −$67
- HOA
- −$0
- Vacancy / Maint / Mgmt
- −$410
- Net cashflow
- $549
Break-even live
UW: 25.0% down · 7.5% · 30yr · 1.5% tax · 5.0% vac · 8.0% maint · 8.0% mgmt
Financing live
Cash to close
- Down payment
- $39,975
- Closing costs
- $4,797
- Reserves months
- —
- Total cash needed
- —
Loan-product check · same deal, 3 products live
Conventional
25% down · 7.5% · 30yr
- Down + closing
- —
- Monthly P&I
- —
- Monthly cashflow
- —
- DSCR
- —
- Eligible?
- —
Personal DTI + credit; lowest rate.
DSCR
20% down · 8.5% · 30yr
- Down + closing
- —
- Monthly P&I
- —
- Monthly cashflow
- —
- DSCR
- —
- Eligible?
- —
No personal income docs; deal must DSCR.
Hard money
10% down · 12.0% · 12mo
- Down + closing
- —
- Monthly P&I
- —
- Monthly cashflow
- —
- DSCR
- —
- Eligible?
- —
Short-term bridge; refi at stabilization.
Rent comps 16 comps
| Address | Beds | Baths | Sqft | Rent | $/sqft | DOM | Units | Dist |
|---|---|---|---|---|---|---|---|---|
| 269 W Borden Ave Syracuse, NY | 4.0 | 1.5 | 1800 | $650 | $0.36 | 21d | 1 | 0.42mi |
| 1330 Midland Ave Syracuse, NY | 4.0 | 1.0 | 1870 | $2,000 | $1.07 | 21d | 1 | 0.47mi |
| 259 Robert Dr Syracuse, NY | 3.0 | 1.5 | 1350 | $699 | $0.52 | 43d | 1 | 0.63mi |
| 2331 Midland Ave Syracuse, NY | 4.0 | 1.5 | 1664 | $2,300 | $1.38 | 21d | 1 | 0.82mi |
| 147 E Matson Ave Syracuse, NY | 3.0 | 2.5 | 1421 | $2,000 | $1.41 | 21d | 1 | 1.01mi |
| 102 Newbury Hollow Ln Syracuse, NY | 3.0 | 2.0 | 2000 | $2,300 | $1.15 | 43d | 1 | 1.11mi |
| 620 Euclid Ave Apt 1 Syracuse, NY | 3.0 | 1.0 | 1248 | $1,700 | $1.36 | 43d | 1 | 1.15mi |
| 501 Clarendon St Syracuse, NY | 3.0 | 1.0 | 2516 | $1,800 | $0.72 | 21d | 1 | 1.24mi |
| 326 Holland St Unit 1 Syracuse, NY | 3.0 | 1.0 | 2100 | $1,825 | $0.87 | 43d | 1 | 1.29mi |
| 922 Westcott St Syracuse, NY | 4.0 | 2.0 | 1700 | $2,000 | $1.18 | 21d | 1 | 1.30mi |
| 953-55 Westcott St Unit 955 Syracuse, NY | 3.0 | 1.0 | 1286 | $1,500 | $1.17 | 43d | 1 | 1.32mi |
| 318 Kellogg St Unit 2 Syracuse, NY | 3.0 | 1.0 | 1523 | $1,675 | $1.10 | 43d | 1 | 1.36mi |
| 318 Kellogg St Unit 1 Syracuse, NY | 3.0 | 1.0 | 1523 | $1,650 | $1.08 | 43d | 1 | 1.36mi |
| 1108 Madison St Unit 2 Syracuse, NY | 3.0 | 1.5 | 1580 | $2,080 | $1.32 | 43d | 1 | 1.36mi |
| 942 Euclid Ave Syracuse, NY | 3.0 | 1.0 | 2572 | $1,800 | $0.70 | 21d | 1 | 1.42mi |
| 447 E Washington St Syracuse, NY | 3.0 | 1.5 | 2095 | $2,100 | $1.00 | 13d | 1 | 1.50mi |
Listing history 9 events
-
2026-03-30status Pending
-
2026-02-27status Active
-
2026-02-24historical Active Under Contract
-
2026-02-09status Active
-
2026-02-09historical Active Under Contract
-
2026-02-09status Active
-
2026-02-06$159,900 Active
-
2019-10-17historical
-
2019-04-10$57,500 Active
ⓘ Source: listings_history table (triggers on properties + properties_extension) + one-shot
backfill from property_details.listing_events for pre-trigger history.
Tax reassessment forecast NY · Partial reset (capped growth)
- Current annual tax
- $1,060 · $88/mo
- Projected year-2 tax
- $1,881 · $157/mo
- Expected delta
- +$821/yr (+$68/mo · 77.5%)
ⓘ Screening estimate from a state-policy table — verify with the county assessor before closing.
Climate risk First Street
- Flood 1/10 Low FEMA zone X (unshaded) · 0% chance over 30 yrs
- Wildfire 1/10 Low
- Heat 3/10 Moderate 7 d/yr ≥95°F today · 16 d/yr by 30 yrs out
- Wind 1/10 Low 0% chance of damaging wind over 30 yrs
- Air quality 2/10 Low 0 unhealthy d/yr today · 1 by 30 yrs out
Nearby sold comps map
Loading sold comps map…
Walkable amenities ~0.75 mi
Loading nearby amenities…
Taxation est. · year 1
- Rental income
- $23,424
- − Mortgage interest
- −$8,957
- − Property taxes
- −$1,060
- − Insurance
- −$800
- − Repairs & maintenance
- −$1,874
- − Management
- −$1,874
- − Depreciation
- −$4,652
- Taxable income
- $4,209
- Est. tax owed @ 24.0%
- −$1,010
- After-tax cash flow
- $5,574/yr
For passive investors: Depreciation is non-cash, so a rental often shows a tax loss while cash-flowing — sheltering income. Rental losses are passive: they offset passive income freely, and up to $25,000/yr can offset ordinary (W-2) income if you actively participate and your MAGI is under $100k (phasing out to $0 by $150k); unused losses carry forward. On sale, claimed depreciation is recaptured at up to 25%, and gains may owe capital-gains tax (a 1031 exchange can defer both). Figures are a year-1 estimate at your 24.0% rate — not tax advice; consult a CPA.
Schools (NCES district)
- District
- Syracuse City School District
- NCES district ID
- 3628590
- Math proficiency
- 18% ▼ -5.00%
- Reading proficiency
- 26% ▬ 0.00%
- Median HH income
- $32,097
- Composite
- 17.83/100
- National rank
- #9007
- State rank
- #590 of 590 in NY
Livability — Syracuse
- Score
- 77/100
- State rank
- #187
- US rank
- #2869
Category grades
Schools grade is shown separately in the Schools card above.
Census & demographics
- Census place
- Syracuse, NY
- City population
- 152,627
- Population (ZIP)
- 18,562
Population outlook (Onondaga County) Hauer SSP2
- Today (2025)
- 467,894 people
- By 2030
- 463,381 · -1.0%
- By 2040
- 447,697 · -4.3%
- By 2050
- 426,399 · -8.9%
- By 2075
- 373,661 · -20.1%
- By 2100
- 307,967 · -34.2%
Race, ethnicity, and origin ACS 2023
- Neighborhood character
- Diverse neighborhood (Simpson 0.67)
- Race & ethnicity
- Black 44% White 37% Two or more races 10% Hispanic / Latino 6% Asian 3%
- Hispanic origin (detail)
- Puerto Rican 4%
- Common ancestry
- Romanian 2% Italian 2% Swiss 1%
- Foreign-born
- 9% · Canada, China, Vietnam
- Languages at home
- 87% English-only · Spanish 5% Arabic 1% Other Indo-European 1%
Political lean MEDSL · Onondaga
- 2024 margin
- D (+17.3) · D 58.6% · R 41.4%
- 2008→2024 swing
- -3.0pp toward R · 2008: 20.3pp · 2024: 17.3pp
- All cycles
- 2024: D+17.3 2020: D+20.6 2016: D+12.8 2012: D+21.1 2008: D+20.3
Not yet ingested
- Civics
- —
Market trends
- HPI YoY
- ▲ 10.12%
- Current HPI
- 345.8854
- Rent YoY
- —
- Metro
- —
- State GDP YoY
- ▲ 2.60%
- F500 in state
- 92
Industry mix (Fortune 500 HQ in NY)
| Industry | F500 HQs | Revenue |
|---|---|---|
| Financial Services | 10 | $950B |
|
||
| Consumer Goods | 9 | $162B |
|
||
| Insurance | 4 | $225B |
|
||
| Telecommunications | 2 | $144B |
|
||
| Pharmaceuticals | 2 | $112B |
|
||
| Media / Entertainment | 2 | $69B |
|
||
Price history
+178.1% since first listed9 events — show timeline
- 2026-03-30 Pending — CNYIS
- 2026-02-27 Relisted — CNYIS
- 2026-02-24 Contingent — CNYIS
- 2026-02-09 Relisted — CNYIS
- 2026-02-09 Contingent — CNYIS
- 2026-02-09 Relisted — CNYIS
- 2026-02-06 Listed $159,900 CNYIS
- 2019-10-17 Listing Removed — CNYIS
- 2019-04-10 Listed $57,500 CNYIS
Property tax history
+0.1%/yrLatest (2025): $1,060 · +0.0% YoY. Source: county tax records.
Cash-flow waterfall
monthlySold comps — $/sqft
last 12 mo · ≤1 miLoading sold comps…