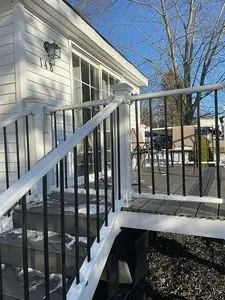
148 Troy Cir · Greensburg, PA
Flood risk 1/10 · Minimal
- FEMA flood zone
- X (unshaded)
- Chance of flooding over 30 yrs
- 0.0%
- Est. flood insurance / yr
- $507 – $1,088
Fire risk 1/10 · Minimal
- Est. fire insurance / yr
- $511 – $949
Heat risk 4/10 · Minor
- Hot days now (above 96°F)
- 7 days/yr
- Hot days in 30 yrs
- 19 days/yr
Wind risk 2/10 · Minimal
- Chance of severe wind over 30 yrs
- —
Air-quality risk 3/10 · Minor
- Unhealthy air days now
- 2 days/yr
- Unhealthy air days in 30 yrs
- 4 days/yr
Risk factors via First Street. Map © Google.
Why this score? — see what drove the B grade
The composite is a weighted blend of 9 inputs, each scored 0–100. Each bar is that input's sub-score; the figure is the points it added to the 100-point composite (weight × sub-score).
- Cash flow +30.0/30.0
- 1% rule +10.0/10.0
- DSCR +10.0/10.0
- ARV discount +7.5/15.0
- Schools +4.9/10.0
- Rent growth +4.5/5.0
- Livability +3.7/5.0
- Condition / age +2.5/5.0
- Appreciation +0.0/10.0
$70,000
🖨 Deal sheet (PDF) 📄 Offer letter ✓ Due diligence
Listing remarks MLS
2001 Skyline 28x40 Mobile Home on Leased Cul De Sac Lot. Newer Air Conditioner, Electric Range and Plumbing. Sold As-Is.
Key facts
- Built 2000
Neighborhood map
What this means for you Summary
Snapshot
- This is a 3-bed/2.0-bath manufactured listed at $70k.
Deal economics
- At list price, monthly cash flow is $588 ($7k/yr) — positive.
- The deal already cash-flows at list — no discount required.
- Meets the 1% rule at list price ($1k rent vs $70k).
- Cap rate 16.4% vs local median 2.4% in Greensburg — top-decile yield for the area; either an underpriced asset or a hidden risk that comps aren't pricing in. Stress-test before assuming the spread holds.
Location & tenants
- Location reads 73/100 on livability (#584 in PA) — a middle-class / working-renter tenant base. Strengths: cost of living A+, housing A+, schools B+; Watch: employment D+, health & safety D+, commute F.
- Hempfield Area SD (suburban): math 50% / reading 64% proficiency, ranked #90 of 539 in PA (top 17%) — acceptable for families but not a draw, mixed tenant base, ~2y average lease.
- Market conditions: Rents rising fast (+8.0%/yr); 296 active listings in the ZIP; solid renter incomes; 415 units permitted in Westmoreland County in 2024 (10 in 5+ unit buildings).
Forward outlook
- Local home prices are declining (-3.0%/yr); year-one equity from $484 of loan paydown is wiped out by about $2k of value loss. Plan a longer hold.
- Westmoreland County population projected at -19% by 2050 — secular population decline; favor cash flow + early exit over multi-decade hold.
- At projected returns (-3.0% appreciation + 8.0% rent growth), your $20k cash investment doubles in ~3 years — after that, you're playing with house money.
Negotiation context
- Only 1 days on market — expect competitive offers; lowballing is unlikely to land.
- 3 sale attempts since 8y ago with the ask held roughly flat each time — persistent listings suggest the price (not the market) is what's stuck; bring a comps-based counter.
- Current owner paid $15k; list at $70k implies a 367% gain — meaningful room to come down on a strong offer.
Questions for the listing agent
- Is there a deadline driving the sale (1031 exchange, divorce, estate, relocation)? That informs how much negotiation room exists.
- Schools are B-rated — typically a magnet for longer-tenancy family renters. What's the average tenant stay here, and is there a school-zone premium baked into asking?
- What's the average days-on-market for RENTAL listings here right now (not sales)? A rising rental-DOM trend means longer vacancies and softer asking-rent achievability than the comps imply.
- What's the recent tenant-quality profile in this submarket — average credit score on applications, eviction rate, late-payment / NSF rate, and stable-employment percentage? A property-management company in the area should have these aggregated.
- How much new for-sale + rental construction is in the pipeline within 1–3 miles? Heavy new supply typically softens prices + rents 12–24 months out; constrained supply supports both.
Investment metrics
- 1% rule
- 2.01% ✓
- Cap rate
- 16.37%
- Cash-on-cash
- 35.99%
- DSCR
- 2.60
- GRM
- 4.1
CMA / ARV
No comps found within radius.
Projected returns pro-forma
-3.0% appreciation · 7.95% rent growth · sell at horizon
- IRR
- 37.4%
- Equity multiple
- 2.71×
- Total profit
- $33,500
- Equity at exit
- $10,437
- IRR
- 46.5%
- Equity multiple
- 6.66×
- Total profit
- $111,010
- Equity at exit
- $6,052
Cash invested: $19,600 (down + closing). Projections, not guarantees.
Landlord ↔ Tenant lean methodology
- Overall (STATE)
- 62 Landlord-Friendly
- State Pennsylvania
- 62 Landlord-Friendly · EVEN
- County
- — inherits STATE
- City
- — inherits STATE
ZIP-level market 15601
- Rents YoY
- 8.0%
- Active inventory
- 296
- Price-to-rent
- 4.1×
Monthly cashflow live
- Estimated rent
- $1,406 medium interval (Pro) →
- Mortgage (P&I)
- −$367
- Tax from tax record
- −$127 /mo · $1,524/yr
- Insurance
- −$29
- HOA
- −$0
- Vacancy / Maint / Mgmt
- −$295
- Net cashflow
- $588
Break-even live
Sensitivity live
| Price | -10% $628 | -5% $608 | +0% $588 | +5% $568 | +10% $548 |
|---|---|---|---|---|---|
| Rent | -10% $477 | -5% $532 | +0% $588 | +5% $643 | +10% $699 |
| Rate | -1.0pp $623 | -0.5pp $606 | base $588 | +0.5pp $570 | +1.0pp $551 |
UW: 25.0% down · 7.5% · 30yr · 1.5% tax · 5.0% vac · 8.0% maint · 8.0% mgmt
Financing live
Cash to close
- Down payment
- $17,500
- Closing costs
- $2,100
- Reserves months
- —
- Total cash needed
- —
Loan-product check · same deal, 3 products live
Conventional
25% down · 7.5% · 30yr
- Down + closing
- —
- Monthly P&I
- —
- Monthly cashflow
- —
- DSCR
- —
- Eligible?
- —
Personal DTI + credit; lowest rate.
DSCR
20% down · 8.5% · 30yr
- Down + closing
- —
- Monthly P&I
- —
- Monthly cashflow
- —
- DSCR
- —
- Eligible?
- —
No personal income docs; deal must DSCR.
Hard money
10% down · 12.0% · 12mo
- Down + closing
- —
- Monthly P&I
- —
- Monthly cashflow
- —
- DSCR
- —
- Eligible?
- —
Short-term bridge; refi at stabilization.
Listing history 11 events
-
2026-05-26$70,000 Active
-
2019-09-10status Under Contract 120-char remark
Show marketing remark (120 chars)
2001 Skyline 28x40 Mobile Home on Leased Cul De Sac Lot. Newer Air Conditioner, Electric Range and Plumbing. Sold As-Is.
-
2019-09-10soldstatus $15,000 Sold 120-char remark
Show marketing remark (120 chars)
2001 Skyline 28x40 Mobile Home on Leased Cul De Sac Lot. Newer Air Conditioner, Electric Range and Plumbing. Sold As-Is.
-
2019-08-22historical Contingent 120-char remark
Show marketing remark (120 chars)
2001 Skyline 28x40 Mobile Home on Leased Cul De Sac Lot. Newer Air Conditioner, Electric Range and Plumbing. Sold As-Is.
-
2019-08-12price $19,900 120-char remark
Show marketing remark (120 chars)
2001 Skyline 28x40 Mobile Home on Leased Cul De Sac Lot. Newer Air Conditioner, Electric Range and Plumbing. Sold As-Is.
-
2019-08-12status Active 120-char remark
Show marketing remark (120 chars)
2001 Skyline 28x40 Mobile Home on Leased Cul De Sac Lot. Newer Air Conditioner, Electric Range and Plumbing. Sold As-Is.
-
2019-02-04historical Withdrawn 120-char remark
Show marketing remark (120 chars)
2001 Skyline 28x40 Mobile Home on Leased Cul De Sac Lot. Newer Air Conditioner, Electric Range and Plumbing. Sold As-Is.
-
2019-01-27price $24,900 120-char remark
Show marketing remark (120 chars)
2001 Skyline 28x40 Mobile Home on Leased Cul De Sac Lot. Newer Air Conditioner, Electric Range and Plumbing. Sold As-Is.
-
2018-12-12price $27,900 120-char remark
Show marketing remark (120 chars)
2001 Skyline 28x40 Mobile Home on Leased Cul De Sac Lot. Newer Air Conditioner, Electric Range and Plumbing. Sold As-Is.
-
2018-10-05price $29,900 120-char remark
Show marketing remark (120 chars)
2001 Skyline 28x40 Mobile Home on Leased Cul De Sac Lot. Newer Air Conditioner, Electric Range and Plumbing. Sold As-Is.
-
2018-09-07$34,900 Active 120-char remark
Show marketing remark (120 chars)
2001 Skyline 28x40 Mobile Home on Leased Cul De Sac Lot. Newer Air Conditioner, Electric Range and Plumbing. Sold As-Is.
ⓘ Source: listings_history table (triggers on properties + properties_extension) + one-shot
backfill from property_details.listing_events for pre-trigger history.
Tax reassessment forecast PA · Partial reset (capped growth)
- Current annual tax
- $1,524 · $127/mo
- Projected year-2 tax
- $1,524 · $127/mo
- Expected delta
- $0/yr ($0/mo · -0.0%)
ⓘ Screening estimate from a state-policy table — verify with the county assessor before closing.
Climate risk First Street
- Flood 1/10 Low FEMA zone X (unshaded) · 0% chance over 30 yrs
- Wildfire 1/10 Low
- Heat 4/10 Moderate 7 d/yr ≥96°F today · 19 d/yr by 30 yrs out
- Wind 2/10 Low
- Air quality 3/10 Moderate 2 unhealthy d/yr today · 4 by 30 yrs out
Nearby sold comps map
Loading sold comps map…
Walkable amenities ~0.75 mi
Loading nearby amenities…
Taxation est. · year 1
- Rental income
- $16,878
- − Mortgage interest
- −$3,921
- − Property taxes
- −$1,524
- − Insurance
- −$350
- − Repairs & maintenance
- −$1,350
- − Management
- −$1,350
- − Depreciation
- −$2,036
- Taxable income
- $6,346
- Est. tax owed @ 24.0%
- −$1,523
- After-tax cash flow
- $5,532/yr
For passive investors: Depreciation is non-cash, so a rental often shows a tax loss while cash-flowing — sheltering income. Rental losses are passive: they offset passive income freely, and up to $25,000/yr can offset ordinary (W-2) income if you actively participate and your MAGI is under $100k (phasing out to $0 by $150k); unused losses carry forward. On sale, claimed depreciation is recaptured at up to 25%, and gains may owe capital-gains tax (a 1031 exchange can defer both). Figures are a year-1 estimate at your 24.0% rate — not tax advice; consult a CPA.
Schools (NCES district)
- District
- Hempfield Area SD
- NCES district ID
- 4211760
- Math proficiency
- 50% ▼ -11.00%
- Reading proficiency
- 64% ▼ -12.00%
- Median HH income
- $54,928
- Composite
- 49.01/100
- National rank
- #2066
- State rank
- #90 of 539 in PA
Livability — Greensburg
- Score
- 73/100
- State rank
- #584
- US rank
- #5607
Category grades
Schools grade is shown separately in the Schools card above.
Census & demographics
- County
- Westmoreland County · 183,777 people
- City population
- 56,425
- Metro
- Pittsburgh, PA
- Population (ZIP)
- 56,425
- Household income
- $78,555
- Rent vs Own
- Severe rent burden
- 1209.0
Population outlook (Westmoreland County) Hauer SSP2
- Today (2025)
- 342,555 people
- By 2030
- 331,717 · -3.2%
- By 2040
- 304,976 · -11.0%
- By 2050
- 277,444 · -19.0%
- By 2075
- 224,607 · -34.4%
- By 2100
- 171,084 · -50.1%
Race, ethnicity, and origin ACS 2023
- Neighborhood character
- Predominantly White (92%)
- Race & ethnicity
- White 92% Two or more races 3% Black 2% Hispanic / Latino 2% Asian 1%
- Common ancestry
- Romanian 8% Lithuanian 2% Slovak 2%
- Foreign-born
- 2% · Canada
- Languages at home
- 97% English-only · Spanish 1%
Political lean MEDSL · Westmoreland
- 2024 margin
- Strong R (+28.4) · D 35.4% · R 63.9%
- 2008→2024 swing
- -11.7pp toward R · 2008: -16.7pp · 2024: -28.4pp
- All cycles
- 2024: R+28.4 2020: R+28.3 2016: R+31.3 2012: R+23.7 2008: R+16.7
Not yet ingested
- Civics
- —
Market trends
- HPI YoY
- ▼ -115.23%
- Current HPI
- 177.4921
- Rent YoY
- ▲ 7.95%
- Metro
- Pittsburgh, PA
- State GDP YoY
- ▲ 1.68%
- F500 in state
- 34
Industry mix (Fortune 500 HQ in PA)
| Industry | F500 HQs | Revenue |
|---|---|---|
| Healthcare | 2 | $309B |
|
||
| Insurance | 2 | $27B |
|
||
| Telecommunications / Media | 1 | $124B |
|
||
| Industrial Distribution | 1 | $22B |
|
||
| Financial Services | 1 | $20B |
|
||
| Chemicals / Materials | 1 | $18B |
|
||
Price history
+100.6% since first listed11 events — show timeline
- 2026-05-26 Listed $70,000 FSBO.com
- 2019-09-10 Pending — West Penn MLS
- 2019-09-10 Sold (MLS) $15,000 West Penn MLS
- 2019-08-22 Contingent — West Penn MLS
- 2019-08-12 Price Changed $19,900 West Penn MLS
- 2019-08-12 Relisted — West Penn MLS
- 2019-02-04 Delisted — West Penn MLS
- 2019-01-27 Price Changed $24,900 West Penn MLS
- 2018-12-12 Price Changed $27,900 West Penn MLS
- 2018-10-05 Price Changed $29,900 West Penn MLS
- 2018-09-07 Listed $34,900 West Penn MLS
Property tax history
+2.5%/yrLatest (2026): $1,524 · +2.4% YoY. Source: county tax records.
Cash-flow waterfall
monthlySold comps — $/sqft
last 12 mo · ≤1 miLoading sold comps…