 Duplex
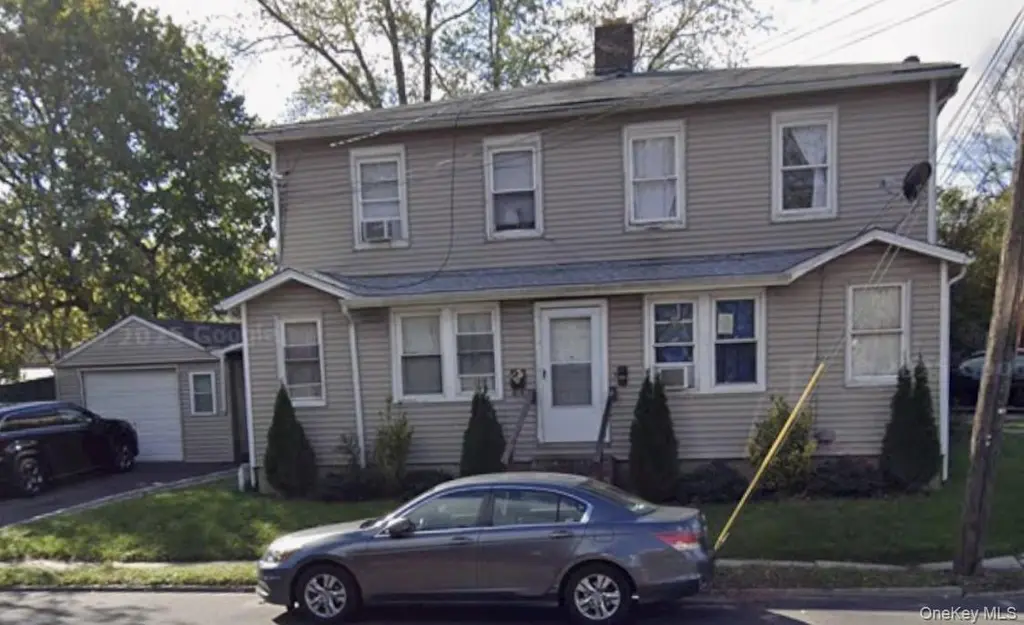
311 Nassau Rd · Huntington, NY
Flood risk No data
- FEMA flood zone
- —
- Chance of flooding over 30 yrs
- —
- Est. flood insurance / yr
- —
Fire risk No data
- Est. fire insurance / yr
- —
Heat risk No data
- Hot days now (above threshold)
- —
- Hot days in 30 yrs
- —
Wind risk No data
- Chance of severe wind over 30 yrs
- —
Air-quality risk No data
- Unhealthy air days now
- —
- Unhealthy air days in 30 yrs
- —
Risk factors via First Street. Map © Google.
Why this score? — see what drove the C grade
The composite is a weighted blend of 9 inputs, each scored 0–100. Each bar is that input's sub-score; the figure is the points it added to the 100-point composite (weight × sub-score).
- Cash flow +16.8/30.0
- ARV discount +15.0/15.0
- DSCR +5.2/10.0
- Schools +4.6/10.0
- 1% rule +4.2/10.0
- Rent growth +4.0/5.0
- Livability +3.5/5.0
- Condition / age +2.5/5.0
- Appreciation +0.0/10.0
$919,000
🖨 Deal sheet (PDF) 📄 Offer letter ✓ Due diligence
Multi-family units
County records classify this as Multi-Family (2-4 Unit). Listing-text estimate: 2 units. confirmed
Listing remarks MLS
Welcome to 311 Nassau Road, a fantastic two-family investment property in Huntington. Each unit includes three bedrooms, a functional kitchen, and 1.5 bathrooms, making it ideal for tenants or multi-generational living. Located in a desirable neighborhood, this property is close to amenities, schools, and parks, providing strong rental potential. Don't miss this opportunity to invest in a versatile property with great income potential. Schedule a showing today!
Key facts
- 5,227 sq ft lot
- Garage
- Built 1934
Neighborhood map
What this means for you Summary
Snapshot
- This is a 2 × 3-bed/1.5-bath units multifamily listed at $919k.
Deal economics
- At list price, monthly cash flow is $591 ($7k/yr) — positive. Per door: $295/mo.
- The deal already cash-flows at list — no discount required.
- To meet the 1% rule (rent ≥ 1% of price), the offer needs to be $845k (8.1% below list).
- Recommended offer: $845k (8.1% below list) — sets the bar for 1% rule.
- Cap rate 7.1% vs local median 2.1% in Huntington — top-decile yield for the area; either an underpriced asset or a hidden risk that comps aren't pricing in. Stress-test before assuming the spread holds.
Location & tenants
- Location reads 69/100 on livability (#495 in NY) — a middle-class / working-renter tenant base. Strengths: crime A+, employment A+, housing A; Watch: amenities F, commute F, cost of living F.
- Huntington Union Free School District (suburban): math 45% / reading 52% proficiency, ranked #328 of 590 in NY (top 56%) — families likely to look elsewhere, expect single-tenant / working-renter base with shorter leases.
- Market conditions: Rents rising fast (+6.1%/yr); 268 active listings in the ZIP; high-income renter base; 1,366 units permitted in Suffolk County in 2024 (216 in 5+ unit buildings).
- At $8,446/mo this rent would consume 55% of the median local household income ($183k/yr) (locally 479% of renters already pay >50% of income on rent) — very limited rent-growth headroom before tenants either downsize or default.
Forward outlook
- Local home prices are declining (-3.0%/yr); year-one equity from $6k of loan paydown is wiped out by about $28k of value loss. Plan a longer hold.
- Suffolk County population projected to shrink 5% by 2050 — rents likely to lag national; underwrite the cash flow, not the appreciation.
Negotiation context
- It's been on market 70 days — a 6% lower offer ($864k) is reasonable based on typical stale-listing flexibility.
- 3 sale attempts since 12y ago with the ask held roughly flat each time — persistent listings suggest the price (not the market) is what's stuck; bring a comps-based counter.
- Current owner paid $300k; list at $919k implies a 206% gain — meaningful room to come down on a strong offer.
Risks & watch-outs
- Watch-outs: built in 1934 — expect roof / HVAC / electrical / plumbing capex.
Questions for the listing agent
- It's been on market 70 days. Have you received any prior offers? Is the seller open to a 8% concession, seller financing, or rate buy-down credit?
- Can we see the unit-by-unit rent roll, current vacancy, and any below-market leases? What's the average tenancy length?
- What capital expenditures (roof, boiler, parking lot, exteriors) have been made in the last 5 years, and what's planned in the next 2?
- Built in 1934 — when were the roof, HVAC, electrical panel, plumbing, and water heater last replaced?
- Why hasn't it sold? Are there any deal-killer items the seller is aware of (foundation, flood, title, zoning, code violations)?
- Is there a deadline driving the sale (1031 exchange, divorce, estate, relocation)? That informs how much negotiation room exists.
- Schools are A-rated — typically a magnet for longer-tenancy family renters. What's the average tenant stay here, and is there a school-zone premium baked into asking?
- What's the average days-on-market for RENTAL listings here right now (not sales)? A rising rental-DOM trend means longer vacancies and softer asking-rent achievability than the comps imply.
- What's the recent tenant-quality profile in this submarket — average credit score on applications, eviction rate, late-payment / NSF rate, and stable-employment percentage? A property-management company in the area should have these aggregated.
- How much new apartment / multifamily construction is in the pipeline within 1–3 miles? Heavy new supply (>2% of stock underway) typically softens rents 12–24 months out; light construction supports rent growth.
Investment metrics
- 1% rule
- 0.92% ✗
- Cap rate
- 7.06%
- Cash-on-cash
- 2.75%
- DSCR
- 1.12
- GRM
- 9.1
CMA / ARV
- ARV (median comp)
- $1,161,074
- List price
- $919,000
- Delta
- -20.85%
- Verdict
- UNDERPRICED
- Comps
- 3 within 2.0 mi
Show comp detail 1 sale within ~0.75 mi
| Address | Dist | Beds/Ba | Sqft | Sold | Price | $/sf | Match |
|---|---|---|---|---|---|---|---|
| 160 Mckay Rd Unit A and B | 0.72mi | 6/2.0 | 2,118 | 6mo | $900,000 | $425 | 45 |
Match score weights: distance 35% · size 25% · config 20% · recency 20%. Top-matched comps best support the ARV.
Projected returns pro-forma
-3.0% appreciation · 6.14% rent growth · sell at horizon
- IRR
- -8.6%
- Equity multiple
- 0.67×
- Total profit
- $-83,814
- Equity at exit
- $137,026
- IRR
- 4.5%
- Equity multiple
- 1.37×
- Total profit
- $95,771
- Equity at exit
- $79,458
Cash invested: $257,320 (down + closing). Projections, not guarantees.
Landlord ↔ Tenant lean methodology
- Overall (STATE)
- 15 Strongly Tenant-Friendly
- State New York
- 15 Strongly Tenant-Friendly · D+10
- County
- — inherits STATE
- City
- — inherits STATE
ZIP-level market 11743
- Rents YoY
- 6.1%
- Active inventory
- 268
- Price-to-rent
- 18.1×
Monthly cashflow live
- Estimated rent
- $8,446 high interval (Pro) →
- Mortgage (P&I)
- −$4,819
- Tax from tax record
- −$879 /mo · $10,553/yr
- Insurance
- −$383
- HOA
- −$0
- Vacancy / Maint / Mgmt
- −$1,774
- Net cashflow
- $591
Break-even live
Sensitivity live
| Price | -10% $1,111 | -5% $851 | +0% $591 | +5% $331 | +10% $70 |
|---|---|---|---|---|---|
| Rent | -10% $-77 | -5% $257 | +0% $591 | +5% $924 | +10% $1,258 |
| Rate | -1.0pp $1,053 | -0.5pp $824 | base $591 | +0.5pp $353 | +1.0pp $110 |
2-unit breakdown (identical units grouped — click to expand)
| Units | Beds | Baths | Est. rent |
|---|---|---|---|
| 2× units | 3 | 1.5 | $8,446 |
| #1 | 3 | 1.5 | $4,223 |
| #2 | 3 | 1.5 | $4,223 |
| Total (2 units) | $8,446 | ||
UW: 25.0% down · 7.5% · 30yr · 1.5% tax · 5.0% vac · 8.0% maint · 8.0% mgmt
Financing live
Cash to close
- Down payment
- $229,750
- Closing costs
- $27,570
- Reserves months
- —
- Total cash needed
- —
Loan-product check · same deal, 3 products live
Conventional
25% down · 7.5% · 30yr
- Down + closing
- —
- Monthly P&I
- —
- Monthly cashflow
- —
- DSCR
- —
- Eligible?
- —
Personal DTI + credit; lowest rate.
DSCR
20% down · 8.5% · 30yr
- Down + closing
- —
- Monthly P&I
- —
- Monthly cashflow
- —
- DSCR
- —
- Eligible?
- —
No personal income docs; deal must DSCR.
Hard money
10% down · 12.0% · 12mo
- Down + closing
- —
- Monthly P&I
- —
- Monthly cashflow
- —
- DSCR
- —
- Eligible?
- —
Short-term bridge; refi at stabilization.
Listing history 12 events
-
2026-05-19status Pending 466-char remark
Show marketing remark (466 chars)
Welcome to 311 Nassau Road, a fantastic two-family investment property in Huntington. Each unit includes three bedrooms, a functional kitchen, and 1.5 bathrooms, making it ideal for tenants or multi-generational living. Located in a desirable neighborhood, this property is close to amenities, schools, and parks, providing strong rental potential. Don't miss this opportunity to invest in a versatile property with great income potential. Schedule a showing today!
-
2026-03-11$919,000 Active 466-char remark
Show marketing remark (466 chars)
Welcome to 311 Nassau Road, a fantastic two-family investment property in Huntington. Each unit includes three bedrooms, a functional kitchen, and 1.5 bathrooms, making it ideal for tenants or multi-generational living. Located in a desirable neighborhood, this property is close to amenities, schools, and parks, providing strong rental potential. Don't miss this opportunity to invest in a versatile property with great income potential. Schedule a showing today!
-
2026-02-26historical $919,000 466-char remark
Show marketing remark (466 chars)
Welcome to 311 Nassau Road, a fantastic two-family investment property in Huntington. Each unit includes three bedrooms, a functional kitchen, and 1.5 bathrooms, making it ideal for tenants or multi-generational living. Located in a desirable neighborhood, this property is close to amenities, schools, and parks, providing strong rental potential. Don't miss this opportunity to invest in a versatile property with great income potential. Schedule a showing today!
-
2016-08-24soldstatus $300,000
-
2016-07-28soldstatus $300,000 118-char remark
Show marketing remark (118 chars)
Legal 2 Family 3 Br Each Apt. Side By Side, Also Commercial Property C6., Additional information: Appearance:Excellen
-
2016-07-28soldstatus $300,000 Closed
Show marketing remark (118 chars)
Legal 2 Family 3 Br Each Apt. Side By Side, Also Commercial Property C6., Additional information: Appearance:Excellen
-
2016-04-20status Under Contract
-
2016-02-04price $375,000
-
2015-08-24price $400,000
-
2015-06-18price $450,000
-
2014-09-15$475,000 New
Show marketing remark (118 chars)
Legal 2 Family 3 Br Each Apt. Side By Side, Also Commercial Property C6., Additional information: Appearance:Excellen
-
2014-09-15$375,000 118-char remark
Show marketing remark (118 chars)
Legal 2 Family 3 Br Each Apt. Side By Side, Also Commercial Property C6., Additional information: Appearance:Excellen
ⓘ Source: listings_history table (triggers on properties + properties_extension) + one-shot
backfill from property_details.listing_events for pre-trigger history.
Tax reassessment forecast NY · Partial reset (capped growth)
- Current annual tax
- $10,553 · $879/mo
- Projected year-2 tax
- $13,042 · $1,087/mo
- Expected delta
- +$2,489/yr (+$207/mo · 23.6%)
ⓘ Screening estimate from a state-policy table — verify with the county assessor before closing.
Nearby sold comps map
Loading sold comps map…
Walkable amenities ~0.75 mi
Loading nearby amenities…
Taxation est. · year 1
- Rental income
- $101,352
- − Mortgage interest
- −$51,478
- − Property taxes
- −$10,553
- − Insurance
- −$4,595
- − Repairs & maintenance
- −$8,108
- − Management
- −$8,108
- − Depreciation
- −$26,735
- Taxable loss
- −$8,225
- Est. tax savings @ 24.0%
- +$1,974
- After-tax cash flow
- $9,062/yr
For passive investors: Depreciation is non-cash, so a rental often shows a tax loss while cash-flowing — sheltering income. Rental losses are passive: they offset passive income freely, and up to $25,000/yr can offset ordinary (W-2) income if you actively participate and your MAGI is under $100k (phasing out to $0 by $150k); unused losses carry forward. On sale, claimed depreciation is recaptured at up to 25%, and gains may owe capital-gains tax (a 1031 exchange can defer both). Figures are a year-1 estimate at your 24.0% rate — not tax advice; consult a CPA.
Schools (NCES district)
- District
- Huntington Union Free School District
- NCES district ID
- 3615090
- Math proficiency
- 45% ▼ -8.00%
- Reading proficiency
- 52% ▼ -1.00%
- Median HH income
- $93,547
- Composite
- 45.68/100
- National rank
- #2578
- State rank
- #328 of 590 in NY
Livability — Huntington
- Score
- 69/100
- State rank
- #495
- US rank
- #8704
Category grades
Schools grade is shown separately in the Schools card above.
Census & demographics
- Census place
- Huntington, NY
- County
- Suffolk County · 679,920 people
- City population
- 43,490
- Metro
- New York-Newark-Jersey City, NY-NJ-PA
- Population (ZIP)
- 43,490
- Household income
- $183,187
- Rent vs Own
- Severe rent burden
- 479.0
Population outlook (Suffolk County) Hauer SSP2
- Today (2025)
- 1,505,262 people
- By 2030
- 1,498,318 · -0.5%
- By 2040
- 1,471,101 · -2.3%
- By 2050
- 1,424,848 · -5.3%
- By 2075
- 1,337,157 · -11.2%
- By 2100
- 1,217,720 · -19.1%
Race, ethnicity, and origin ACS 2023
- Neighborhood character
- Predominantly White (75%)
- Race & ethnicity
- White 75% Hispanic / Latino 12% Two or more races 10% Asian 5% Black 4%
- Hispanic origin (detail)
- Puerto Rican 4%
- Common ancestry
- Romanian 6% Scotch-Irish 3% Slovak 2%
- Foreign-born
- 11% · Canada, China, Jamaica
- Languages at home
- 83% English-only · Spanish 9% Other Indo-European 3% Chinese 1%
Political lean MEDSL · Suffolk
- 2024 margin
- Lean R (+10.0) · D 45.0% · R 55.0%
- 2008→2024 swing
- -16.0pp toward R · 2008: 6.0pp · 2024: -10.0pp
- All cycles
- 2024: R+10.0 2020: R+0.0 2016: R+8.2 2012: D+2.9 2008: D+6.0
Not yet ingested
- Civics
- —
Market trends
- HPI YoY
- ▼ -659.59%
- Current HPI
- 279.0693
- Rent YoY
- ▲ 6.14%
- Metro
- New York-Newark-Jersey City, NY-NJ-PA
- State GDP YoY
- ▲ 2.60%
- F500 in state
- 92
Industry mix (Fortune 500 HQ in NY)
| Industry | F500 HQs | Revenue |
|---|---|---|
| Financial Services | 10 | $950B |
|
||
| Consumer Goods | 9 | $162B |
|
||
| Insurance | 4 | $225B |
|
||
| Telecommunications | 2 | $144B |
|
||
| Pharmaceuticals | 2 | $112B |
|
||
| Media / Entertainment | 2 | $69B |
|
||
Price history
+145.1% since first listed12 events — show timeline
- 2026-05-19 Pending — OneKey® MLS as Distributed by MLS Grid
- 2026-03-11 Listed $919,000 OneKey® MLS as Distributed by MLS Grid
- 2026-02-26 Coming Soon $919,000 OneKey® MLS as Distributed by MLS Grid
- 2016-08-24 Sold (Public Records) $300,000 Public Records
- 2016-07-28 Sold (MLS) $300,000 OneKey® MLS as Distributed by MLS Grid
- 2016-07-28 Sold (MLS) $300,000 MLSLI
- 2016-04-20 Pending — MLSLI
- 2016-02-04 Price Changed $375,000 MLSLI
- 2015-08-24 Price Changed $400,000 MLSLI
- 2015-06-18 Price Changed $450,000 MLSLI
- 2014-09-15 Listed $475,000 MLSLI
- 2014-09-15 Listed $375,000 OneKey® MLS as Distributed by MLS Grid
Property tax history
+2.0%/yrLatest (2025): $10,553 · +0.0% YoY. Source: county tax records.
Cash-flow waterfall
monthlySold comps — $/sqft
last 12 mo · ≤1 miLoading sold comps…