1743 Dr Db Todd Jr Blvd · Nashville-Davidson metropolitan government (balance), TN
Flood risk 1/10 · Minimal
- FEMA flood zone
- X (unshaded)
- Chance of flooding over 30 yrs
- 0.0%
- Est. flood insurance / yr
- $507 – $1,088
Fire risk 1/10 · Minimal
- Est. fire insurance / yr
- $949 – $1,763
Heat risk 6/10 · Moderate
- Hot days now (above 106°F)
- 7 days/yr
- Hot days in 30 yrs
- 21 days/yr
Wind risk 4/10 · Minor
- Chance of severe wind over 30 yrs
- 9.0%
Air-quality risk 2/10 · Minimal
- Unhealthy air days now
- 1 days/yr
- Unhealthy air days in 30 yrs
- 2 days/yr
Risk factors via First Street. Map © Google.
Why this score? — see what drove the C+ grade
The composite is a weighted blend of 9 inputs, each scored 0–100. Each bar is that input's sub-score; the figure is the points it added to the 100-point composite (weight × sub-score).
- Cash flow +27.9/30.0
- DSCR +9.9/10.0
- ARV discount +7.5/15.0
- 1% rule +6.9/10.0
- Rent growth +3.0/5.0
- Livability +2.5/5.0
- Condition / age +2.5/5.0
- Schools +1.4/10.0
- Appreciation +0.0/10.0
$179,000
🖨 Deal sheet 📄 Offer letter ✓ Due diligence
Listing remarks MLS
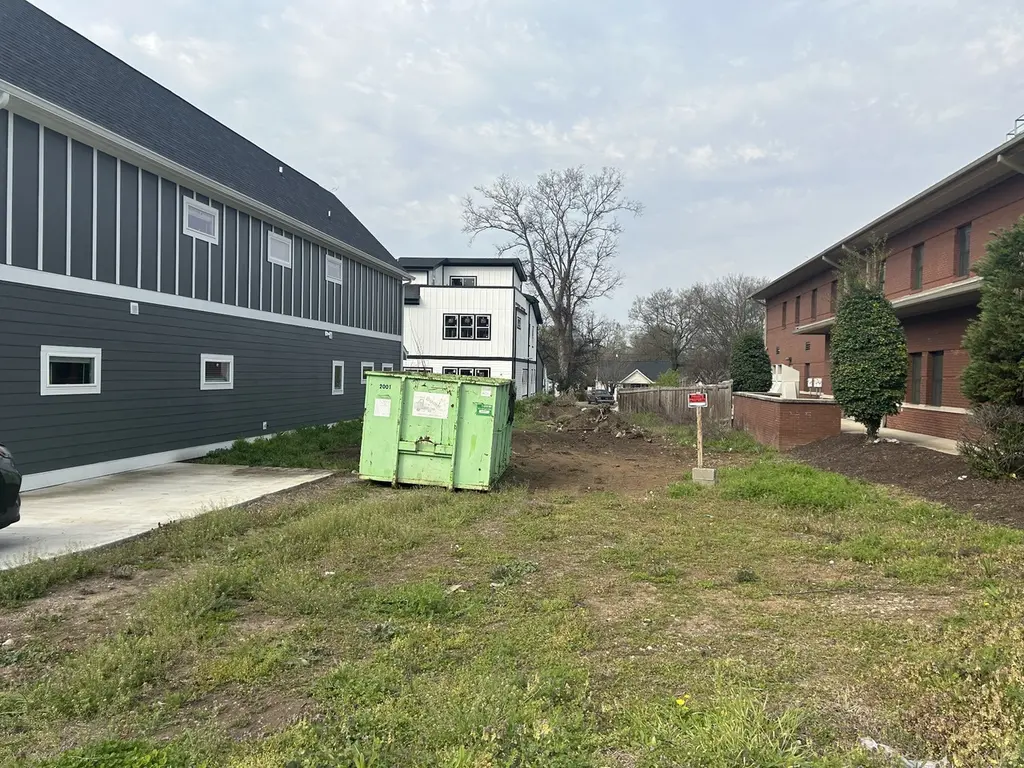
Don't miss your chance to build in a rapidly growing area of Nashville. This lot is clear, flat and ready for you to start building your dream home. Just minutes to downtown and even closer to Germantown. You will be minutes away from all of Nashville's greatest hot spots and even its new developments. This lot is deep and you can create your own downtown personal oasis. Can be combined with a sale of 1749 Dr DB Todd Jr Blvd.
Key facts
- Generous depth
- Level cleared lot
- Listed 15 days
Tags
Property features AI
Exterior
- Parking: Attached 2-car garage; Garage faces front; 2 covered parking spaces (total 2)
- Utilities: Public water; Public sewer; Electricity available
- Home design: Single-family residence; One story; New construction; Residential property
- Construction: Brick construction; To be built
- Exterior features: Public water; Public sewer; Electricity available; Water available
Interior
- Kitchen: No appliances listed
- Bedrooms: 3 bedrooms (all on the main level)
- Flooring: Wood flooring
- Bathrooms: 2 full bathrooms
- Heating & cooling: Electric heating; Central air conditioning
- Interior features: No basement; Wood flooring
- Laundry & utility: No laundry appliances listed
Neighborhood map
What this means for you Summary
Snapshot
- This is a other listed at $179k.
Deal economics
- At list price, monthly cash flow is $552 ($7k/yr) — positive.
- The deal already cash-flows at list — no discount required.
- Meets the 1% rule at list price ($2k rent vs $179k).
- Recommended offer: $176k (1.5% below list) — sets the bar for market timing.
- Cap rate 10.0% vs local median 2.9% in Nashville-Davidson metropolitan government (balance) — top-decile yield for the area; either an underpriced asset or a hidden risk that comps aren't pricing in. Stress-test before assuming the spread holds.
Location & tenants
- Location reads: area grade C — affects rentability + tenant quality, not the cash-flow math above.
- Davidson County (urban): math 12% / reading 19% proficiency, ranked #126 of 139 in TN (top 91%) — low school quality limits family demand, transient renter base, plan for 1-2y turnover; 66% free/reduced lunch — lower-income household profile, screen leases tightly.
- Zoned schools: Robert Churchwell Elementary (math 2% / reading 2%, grade F, #926 of 952 statewide, top 100%, 289 students, 0% FRL); Pearl-Cohn High (math 2% / reading 12%, grade F, #294 of 332 statewide, top 91%, 604 students, 0% FRL) — zoned schools average 0% FRL vs 66% district-wide (66 pts lower); this property's tenant base skews higher-income than the district average.
- Market conditions: Rents rising (+2.1%/yr); 346 active listings in the ZIP; 40 comparable units currently listed for rent nearby; rentals at typical pace (median 17d on market — plan ~3-4 weeks tenant-placement turnaround); 6,873 units permitted in Davidson County in 2024 (4,138 in 5+ unit buildings).
Forward outlook
- Local home prices are declining (-3.0%/yr); year-one equity from $1k of loan paydown is wiped out by about $5k of value loss. Plan a longer hold.
- Davidson County population projected at +42% by 2050 — long-run rental-demand tailwind backs the buy-and-hold thesis.
- At projected returns (-3.0% appreciation + 2.1% rent growth), your $50k cash investment doubles in ~10 years — after that, you're playing with house money.
Negotiation context
- It's been on market 15 days — a 2% lower offer ($176k) is reasonable based on typical stale-listing flexibility.
- 9 sale attempts since 14y ago with the ask held roughly flat each time — persistent listings suggest the price (not the market) is what's stuck; bring a comps-based counter.
- Current owner paid $105k; list at $179k implies a 70% gain — meaningful room to come down on a strong offer.
Risks & watch-outs
- Watch-outs: built in 1940 — expect roof / HVAC / electrical / plumbing capex.
- Climate carrying-cost: extreme-heat days projected 7→21/yr by 2055 (HVAC capex compounding) — expect insurance premiums to compound above CPI over the hold.
Questions for the listing agent
- Built in 1940 — when were the roof, HVAC, electrical panel, plumbing, and water heater last replaced?
- Is there a deadline driving the sale (1031 exchange, divorce, estate, relocation)? That informs how much negotiation room exists.
- What's the average days-on-market for RENTAL listings here right now (not sales)? A rising rental-DOM trend means longer vacancies and softer asking-rent achievability than the comps imply.
- What's the recent tenant-quality profile in this submarket — average credit score on applications, eviction rate, late-payment / NSF rate, and stable-employment percentage? A property-management company in the area should have these aggregated.
- How much new for-sale + rental construction is in the pipeline within 1–3 miles? Heavy new supply typically softens prices + rents 12–24 months out; constrained supply supports both.
Investment metrics
- 1% rule
- 1.19% ✓
- Cap rate
- 9.99%
- Cash-on-cash
- 13.21%
- DSCR
- 1.59
- GRM
- 7.0
CMA / ARV
No comps found within radius.
Projected returns pro-forma
-3.0% appreciation · 2.15% rent growth · sell at horizon
- IRR
- 2.3%
- Equity multiple
- 1.09×
- Total profit
- $4,298
- Equity at exit
- $26,689
- IRR
- 11.0%
- Equity multiple
- 1.83×
- Total profit
- $41,575
- Equity at exit
- $15,477
Cash invested: $50,120 (down + closing). Projections, not guarantees.
Landlord ↔ Tenant lean methodology
- Overall (STATE)
- 87 Strongly Landlord-Friendly
- State Tennessee
- 87 Strongly Landlord-Friendly · R+13
- County
- — inherits STATE
- City
- — inherits STATE
ZIP-level market 37208
- Home prices YoY
- -12.6%
- Rents YoY
- 2.1%
- Active inventory
- 346
- Price-to-rent
- 7.0×
Monthly cashflow live
- Estimated rent
- $2,130 high interval (Pro) →
- Mortgage (P&I)
- −$939
- Tax from tax record
- −$117 /mo · $1,407/yr
- Insurance
- −$75
- HOA
- −$0
- Vacancy / Maint / Mgmt
- −$447
- Net cashflow
- $552
Break-even live
UW: 25.0% down · 7.5% · 30yr · 1.5% tax · 5.0% vac · 8.0% maint · 8.0% mgmt
Financing live
Cash to close
- Down payment
- $44,750
- Closing costs
- $5,370
- Reserves months
- —
- Total cash needed
- —
Loan-product check · same deal, 3 products live
Conventional
25% down · 7.5% · 30yr
- Down + closing
- —
- Monthly P&I
- —
- Monthly cashflow
- —
- DSCR
- —
- Eligible?
- —
Personal DTI + credit; lowest rate.
DSCR
20% down · 8.5% · 30yr
- Down + closing
- —
- Monthly P&I
- —
- Monthly cashflow
- —
- DSCR
- —
- Eligible?
- —
No personal income docs; deal must DSCR.
Hard money
10% down · 12.0% · 12mo
- Down + closing
- —
- Monthly P&I
- —
- Monthly cashflow
- —
- DSCR
- —
- Eligible?
- —
Short-term bridge; refi at stabilization.
Rent comps 40 comps
| Address | Beds | Baths | Sqft | Rent | $/sqft | DOM | Units | Dist |
|---|---|---|---|---|---|---|---|---|
| 1733 17th Ave N Nashville, TN | 1.0 | 1.0 | 700 | $1,150 | $1.64 | 12d | 1 | 0.08mi |
| 1726 22nd Ave N Unit A Nashville, TN | 2.0 | 1.0 | — | $1,500 | — | 10d | 1 | 0.10mi |
| 1735 16th Ave N Unit A Nashville, TN | 2.0 | 1.0 | 850 | $1,095 | $1.29 | 16d | 1 | 0.12mi |
| 1807 15th Ave N Unit A Nashville, TN | 2.0 | 1.0 | 600 | $1,400 | $2.33 | 23d | 1 | 0.15mi |
| 1822 16th Ave N Unit 1 Nashville, TN | 3.0 | 2.5 | 1912 | $2,750 | $1.44 | 17d | 1 | 0.18mi |
| 1822 16th Ave N Unit 1 Nashville, TN | 3.0 | 2.5 | 1912 | $2,750 | $1.44 | 23d | 1 | 0.18mi |
| 1706 23rd Ave N Nashville, TN | 3.0 | 2.0 | 1064 | $1,600 | $1.50 | 2d | 1 | 0.19mi |
| 1905A 15th Ave N Nashville, TN | 3.0 | 2.5 | 1669 | $2,595 | $1.55 | 14d | 1 | 0.20mi |
| 1615A 22nd Ave N Unit 1 Nashville, TN | 2.0 | 1.0 | 665 | $1,295 | $1.95 | 23d | 1 | 0.24mi |
| 1615 23rd Ave N Nashville, TN | 3.0 | 2.0 | 1316 | $1,750 | $1.33 | 14d | 1 | 0.27mi |
| 1922 14th Ave N Nashville, TN | 3.0 | 2.5 | 1876 | $4,795 | $2.56 | 23d | 1 | 0.30mi |
| 1924 14th Ave N Unit A Nashville, TN | 3.0 | 2.5 | 1820 | $4,500 | $2.47 | 23d | 1 | 0.31mi |
| 1614 17th Ave N Unit B Nashville, TN | 2.0 | 1.0 | 554 | $1,095 | $1.98 | 4d | 1 | 0.32mi |
| 2400 Buchanan St Unit B Nashville, TN | 3.0 | 3.0 | 1398 | $2,600 | $1.86 | 4d | 1 | 0.32mi |
| 2400 Buchanan St Nashville, TN | 3.0 | 3.0 | 1398 | $2,600 | $1.86 | 23d | 1 | 0.32mi |
| 1808 Cephas St Nashville, TN | 3.0 | 1.0 | 848 | $1,800 | $2.12 | 14d | 1 | 0.32mi |
| 1522 22nd Ave N Nashville, TN | 3.0 | 2.0 | 1350 | $2,500 | $1.85 | 4d | 1 | 0.34mi |
| 1522 22nd Ave N Nashville, TN | 3.0 | 2.0 | 1350 | $2,600 | $1.93 | 23d | 1 | 0.34mi |
| 1519B 21st Ave N Nashville, TN | 2.0 | 1.5 | 960 | $1,498 | $1.56 | 14d | 1 | 0.36mi |
| 1618 14th Ave N Nashville, TN | 3.0 | 2.0 | 1047 | $2,700 | $2.58 | 16d | 1 | 0.36mi |
| 1515B 21st Ave N Nashville, TN | 3.0 | 3.0 | 1757 | $2,595 | $1.48 | 23d | 1 | 0.37mi |
| 1828 11th Ave N Nashville, TN | 3.0 | 2.5 | 2100 | $3,150 | $1.50 | 23d | 1 | 0.40mi |
| 1708 Underwood St Nashville, TN | 3.0 | 2.0 | 1044 | $1,500 | $1.44 | 4d | 1 | 0.42mi |
| 2306 Hammond Dr Nashville, TN | 3.0 | 1.0 | 912 | $1,595 | $1.75 | 23d | 1 | 0.42mi |
| 1910 11th Ave N Nashville, TN | 3.0 | 3.0 | 2060 | $5,595 | $2.72 | 23d | 1 | 0.43mi |
| 2505 Jenkins St Nashville, TN | 3.0 | 1.0 | 875 | $1,800 | $2.06 | 20d | 1 | 0.44mi |
| 2017 12th Ave N Unit B Nashville, TN | 3.0 | 2.5 | 1668 | $3,000 | $1.80 | 17d | 1 | 0.44mi |
| 1713 Simpkins St Nashville, TN | 3.0 | 2.5 | 1935 | $2,595 | $1.34 | 3d | 1 | 0.46mi |
| 1713 Simpkins St Nashville, TN | 3.0 | 2.5 | 1935 | $2,595 | $1.34 | 16d | 1 | 0.46mi |
| 1909 10th Ave N Unit B Nashville, TN | 3.0 | 2.0 | 1137 | $2,200 | $1.93 | 11d | 1 | 0.47mi |
| 1909 10th Ave N Unit A Nashville, TN | 3.0 | 2.0 | 998 | $1,950 | $1.95 | 3d | 1 | 0.47mi |
| 1909 10th Ave N Unit B Nashville, TN | 3.0 | 2.0 | 1137 | $2,200 | $1.93 | 7d | 1 | 0.47mi |
| 2144 18th Ave N Nashville, TN | 3.0 | 2.5 | 2083 | $3,199 | $1.54 | 23d | 1 | 0.48mi |
| 1720 Knowles St Unit B Nashville, TN | 2.0 | 1.0 | 870 | $1,299 | $1.49 | 23d | 1 | 0.48mi |
| 1708 10th Ave N Nashville, TN | 3.0 | 2.0 | 1305 | $2,350 | $1.80 | 23d | 1 | 0.51mi |
| 1737 Pecan St #6 Nashville, TN | 3.0 | 4.0 | 1879 | $3,650 | $1.94 | 21d | 1 | 0.54mi |
| 1523 12th Ave N Unit B Nashville, TN | 3.0 | 2.0 | 1200 | $1,200 | $1.00 | 17d | 1 | 0.54mi |
| 1523 12th Ave N Nashville, TN | 1.0 | 1.0 | — | $1,000 | — | 17d | 1 | 0.54mi |
| 2122 24th Ave N Nashville, TN | 3.0 | 3.5 | 1860 | $2,400 | $1.29 | 11d | 1 | 0.55mi |
| 1526 12th Ave N Unit B Nashville, TN | 2.0 | 1.0 | — | $1,095 | — | 7d | 1 | 0.55mi |
Listing history 12 events
-
2026-06-18days on market $179,000 Active 15 DOM
-
2026-06-17days on market $179,000 Active 14 DOM
-
2026-06-16days on market $179,000 Active 13 DOM
-
2026-06-15days on market $179,000 Active 12 DOM
-
2026-06-13days on market $179,000 Active 10 DOM
-
2026-06-13days on market $179,000 Active 9 DOM
-
2026-06-09days on market $179,000 Active 6 DOM
-
2026-06-08days on market $179,000 Active 5 DOM
-
2026-06-07days on market $179,000 Active 4 DOM
-
2026-06-05$179,000 Active 1 DOM
-
2026-06-02remarks 663-char remark
-
2026-06-02$179,000 Active 1 DOM
ⓘ Source: listings_history table (triggers on properties + properties_extension) + one-shot
backfill from property_details.listing_events for pre-trigger history.
Tax reassessment forecast TN · Resets to sale price
- Current annual tax
- $1,407 · $117/mo
- Projected year-2 tax
- $1,407 · $117/mo
- Expected delta
- $0/yr ($0/mo · 0.0%)
ⓘ Screening estimate from a state-policy table — verify with the county assessor before closing.
Climate risk First Street
- Flood 1/10 Low FEMA zone X (unshaded) · 0% chance over 30 yrs
- Wildfire 1/10 Low
- Heat 6/10 Major 7 d/yr ≥106°F today · 21 d/yr by 30 yrs out
- Wind 4/10 Moderate 9% chance of damaging wind over 30 yrs
- Air quality 2/10 Low 1 unhealthy d/yr today · 2 by 30 yrs out
Nearby sold comps map
Loading sold comps map…
Walkable amenities ~0.75 mi
Loading nearby amenities…
Taxation est. · year 1
- Rental income
- $25,554
- − Mortgage interest
- −$10,027
- − Property taxes
- −$1,407
- − Insurance
- −$895
- − Repairs & maintenance
- −$2,044
- − Management
- −$2,044
- − Depreciation
- −$5,207
- Taxable income
- $3,929
- Est. tax owed @ 24.0%
- −$943
- After-tax cash flow
- $5,678/yr
For passive investors: Depreciation is non-cash, so a rental often shows a tax loss while cash-flowing — sheltering income. Rental losses are passive: they offset passive income freely, and up to $25,000/yr can offset ordinary (W-2) income if you actively participate and your MAGI is under $100k (phasing out to $0 by $150k); unused losses carry forward. On sale, claimed depreciation is recaptured at up to 25%, and gains may owe capital-gains tax (a 1031 exchange can defer both). Figures are a year-1 estimate at your 24.0% rate — not tax advice; consult a CPA.
Schools (NCES district)
- District
- Davidson County
- NCES district ID
- 4703180
- Math proficiency
- 12% ▼ -17.00%
- Reading proficiency
- 19% ▼ -7.00%
- Median HH income
- $48,667
- Composite
- 14.03/100
- National rank
- #9472
- State rank
- #126 of 139 in TN
Livability — Nashville-Davidson metropolitan government (balance)
No livability data for this city. (Only ~50 U.S. cities are tracked.)
Census & demographics
- Census place
- Nashville-Davidson metropolitan government (balance), TN
- County
- Davidson County · 680,067 people
- City population
- 677,595
- Metro
- Nashville-Davidson--Murfreesboro--Franklin, TN
- Population (ZIP)
- 20,889
- Household income
- $65,556
- Rent vs Own
- Severe rent burden
- 1432.0
Population outlook (Davidson County) Hauer SSP2
- Today (2025)
- 808,568 people
- By 2030
- 874,489 · +8.2%
- By 2040
- 1,009,046 · +24.8%
- By 2050
- 1,147,294 · +41.9%
- By 2075
- 1,475,439 · +82.5%
- By 2100
- 1,714,101 · +112.0%
Race, ethnicity, and origin ACS 2023
- Neighborhood character
- Diverse neighborhood (Simpson 0.56)
- Race & ethnicity
- Black 57% White 34% Two or more races 4% Hispanic / Latino 3% Asian 1%
- Common ancestry
- Romanian 2% Slovak 2% Hispanic 1%
- Foreign-born
- 3% · Canada
- Languages at home
- 95% English-only · Spanish 2% Other Indo-European 1%
Political lean MEDSL · Davidson
- 2024 margin
- Strong D (+27.4) · D 62.7% · R 35.3% · Other 2.0%
- 2008→2024 swing
- +6.5pp toward D · 2008: 21.0pp · 2024: 27.4pp
- All cycles
- 2024: D+27.4 2020: D+32.1 2016: D+26.0 2012: D+18.7 2008: D+21.0
Not yet ingested
- Civics
- —
Market trends
- HPI YoY
- ▼ -59.14%
- Current HPI
- 410.2214
- Rent YoY
- ▲ 2.15%
- Metro
- Nashville-Davidson--Murfreesboro--Franklin, TN
- State GDP YoY
- ▲ 2.78%
- F500 in state
- 22
Industry mix (Fortune 500 HQ in TN)
| Industry | F500 HQs | Revenue |
|---|---|---|
| Healthcare | 3 | $91B |
|
||
| Retail | 3 | $72B |
|
||
| Transportation / Logistics | 1 | $88B |
|
||
| Paper / Packaging | 1 | $19B |
|
||
| Insurance | 1 | $13B |
|
||
| Energy | 1 | $12B |
|
||
Price history
+103.4% since first listed26 events — show timeline
- 2026-06-02 Listed $179,000 REALTRACS as Distributed by MLS Grid
- 2026-01-01 Listing Removed — REALTRACS as Distributed by MLS Grid
- 2025-05-03 Listed $189,000 REALTRACS as Distributed by MLS Grid
- 2025-04-01 Listing Removed — REALTRACS as Distributed by MLS Grid
- 2024-11-13 Relisted — REALTRACS as Distributed by MLS Grid
- 2024-11-01 Contingent — REALTRACS as Distributed by MLS Grid
- 2024-11-01 Relisted — REALTRACS as Distributed by MLS Grid
- 2024-11-01 Listing Removed — REALTRACS as Distributed by MLS Grid
- 2024-10-03 Price Changed $199,000 REALTRACS as Distributed by MLS Grid
- 2024-05-08 Listed $225,000 REALTRACS as Distributed by MLS Grid
- 2024-05-04 Coming Soon $225,000 REALTRACS as Distributed by MLS Grid
- 2024-03-29 Listed $225,000 REALTRACS as Distributed by MLS Grid
- 2024-03-26 Coming Soon — REALTRACS as Distributed by MLS Grid
- 2016-08-01 Sold (Public Records) $105,000 Public Records
- 2016-07-29 Sold (MLS) $105,000 REALTRACS as Distributed by MLS Grid
- 2016-07-20 Pending — REALTRACS as Distributed by MLS Grid
- 2016-07-20 Contingent — REALTRACS as Distributed by MLS Grid
- 2016-05-18 Relisted — REALTRACS as Distributed by MLS Grid
- 2016-05-06 Listing Removed — REALTRACS as Distributed by MLS Grid
- 2016-05-04 Listed $139,500 REALTRACS as Distributed by MLS Grid
- 2012-07-25 Listing Removed — REALTRACS as Distributed by MLS Grid
- 2012-07-25 Sold (MLS) $23,000 REALTRACS as Distributed by MLS Grid
- 2012-03-05 Listed $22,200 REALTRACS as Distributed by MLS Grid
- 2005-09-14 Sold (Public Records) $102,000 Public Records
- 2005-09-14 Sold (Public Records) $85,000 Public Records
- 2004-02-12 Sold (Public Records) $88,000 Public Records
Property tax history
+6.8%/yrLatest (2025): $1,407 · +44.1% YoY. Source: county tax records.
Cash-flow waterfall
monthlySold comps — $/sqft
last 12 mo · ≤1 miLoading sold comps…