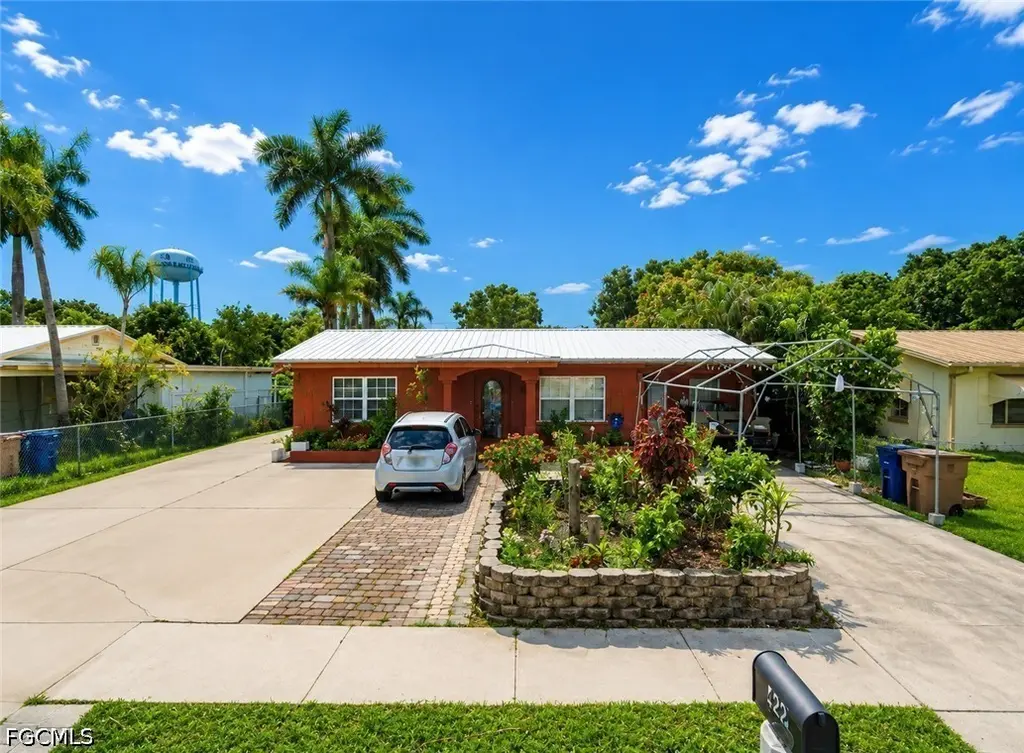
422 Ballair Rd · Tice, FL
Flood risk 1/10 · Minimal
- FEMA flood zone
- X (unshaded)
- Chance of flooding over 30 yrs
- 0.0%
- Est. flood insurance / yr
- $507 – $1,088
Fire risk 2/10 · Minimal
- Est. fire insurance / yr
- $947 – $1,759
Heat risk 10/10 · Severe
- Hot days now (above 107°F)
- 7 days/yr
- Hot days in 30 yrs
- 30 days/yr
Wind risk 10/10 · Severe
- Chance of severe wind over 30 yrs
- 99.0%
Air-quality risk 2/10 · Minimal
- Unhealthy air days now
- 1 days/yr
- Unhealthy air days in 30 yrs
- 1 days/yr
Risk factors via First Street. Map © Google.
Why this score? — see what drove the F grade
The composite is a weighted blend of 9 inputs, each scored 0–100. Each bar is that input's sub-score; the figure is the points it added to the 100-point composite (weight × sub-score).
- Cash flow +14.2/30.0
- DSCR +4.3/10.0
- Schools +4.1/10.0
- Livability +3.4/5.0
- 1% rule +3.3/10.0
- Condition / age +2.5/5.0
- Rent growth +1.8/5.0
- ARV discount +0.5/15.0
- Appreciation +0.0/10.0
$300,000
🖨 Deal sheet (PDF) 📄 Offer letter ✓ Due diligence
Listing remarks
Charming property located in the heart of Fort Myers! This home features city water, a spacious lot, and a convenient location close to shopping, dining, schools, and major roads. Perfect opportunity for homeowners or investors alike. Enjoy the potential this property offers with plenty of outdoor space and no HOA restrictions. Schedule your private showing today!Professional photos coming soon.
Key facts
- Spacious lot
- No hoa restrictions
- Convenient location
Tags
Property features AI
Finance
- Other: Zoning: TFC-2; Lot dimensions: 61 x 140 x 62 x 140 (survey)
- Financial info: Pets allowed
- HOA & community: No association fee
Exterior
- Parking: Attached carport; Paved parking; 1 covered space (carport)
- Security: Security/high-impact doors
- Utilities: Cable available; Public sewer; Public water (assessments paid)
- Home design: Single-story; Faces east; Resale property
- Construction: Block, concrete and stucco construction; Metal roof; Built on foundation (standard)
- Exterior features: Courtyard; Fenced yard; Fruit trees; Security/high-impact doors; Room for pool; Rectangular lot; West exposure
Interior
- Kitchen: Electric cooktop; Microwave; Dishwasher; Refrigerator
- Bedrooms: Den (additional room type)
- Flooring: Tile
- Bathrooms: 2 full bathrooms
- Heating & cooling: Central heating (electric); Central air conditioning (electric)
- Interior features: Impact glass windows; Family/Dining room; Living/Dining room; Unfurnished
- Laundry & utility: Washer; Dryer; Laundry tub
Neighborhood map
What this means for you Summary
Snapshot
- This is a 3-bed/2.0-bath single-family listed at $300k.
Deal economics
- At list price, monthly cash flow is $50 ($603/yr) — positive.
- The deal already cash-flows at list — no discount required.
- To meet the 1% rule (rent ≥ 1% of price), the offer needs to be $249k (17.1% below list).
- Recommended offer: $249k (17.1% below list) — sets the bar for 1% rule.
Location & tenants
- Location reads 67/100 on livability (#552 in FL) — a middle-class / working-renter tenant base. Strengths: cost of living A+, housing A+, health & safety A; Watch: amenities F, commute F, employment F.
- Lee (suburban): math 47% / reading 50% proficiency, ranked #42 of 73 in FL (top 58%) — families likely to look elsewhere, expect single-tenant / working-renter base with shorter leases.
- Zoned schools: Sunshine Elementary School (math 38% / reading 42%, grade F, #1,491 of 2,144 statewide, top 70%, 1,301 students, 74% FRL); Oak Hammock Middle School (math 43% / reading 41%, grade D-, #340 of 571 statewide, top 61%, 1,563 students, 56% FRL); Lehigh Senior High School (math 23% / reading 45%, grade F, #394 of 667 statewide, top 60%, 2,476 students, 57% FRL).
- Market conditions: Rents soft (-3.0%/yr); 768 active listings in the ZIP; 7 comparable units currently listed for rent nearby; rentals at typical pace (median 18d on market — plan ~3-4 weeks tenant-placement turnaround); 15,411 units permitted in Lee County in 2024 (4,686 in 5+ unit buildings).
- This rent runs 41% of the median local income ($72k/yr) — at the standard rent-burdened threshold; future hikes will face affordability resistance.
Forward outlook
- Local home prices are declining (-3.0%/yr); year-one equity from $2k of loan paydown is wiped out by about $9k of value loss. Plan a longer hold.
- Lee County population projected at +44% by 2050 — long-run rental-demand tailwind backs the buy-and-hold thesis.
Negotiation context
- It's been on market 24 days — a 2% lower offer ($296k) is reasonable based on typical stale-listing flexibility.
- Current owner paid $66k; list at $300k implies a 356% gain — meaningful room to come down on a strong offer.
Risks & watch-outs
- Watch-outs: built in 1954 — expect roof / HVAC / electrical / plumbing capex.
- Climate carrying-cost: severe wind risk, 99% chance of damaging wind over 30y; extreme-heat days projected 7→30/yr by 2055 (HVAC capex compounding) — expect insurance premiums to compound above CPI over the hold.
Questions for the listing agent
- Built in 1954 — when were the roof, HVAC, electrical panel, plumbing, and water heater last replaced?
- Is there a deadline driving the sale (1031 exchange, divorce, estate, relocation)? That informs how much negotiation room exists.
- Schools are F-rated, which usually means shorter tenancies and higher turnover. Who's the typical renter profile here, and what's been the actual vacancy rate?
- The area grade is low — what's the realistic commute time and amenity access for the typical tenant pool here? Any planned neighborhood developments (good or bad) we should know about?
- What's the average days-on-market for RENTAL listings here right now (not sales)? A rising rental-DOM trend means longer vacancies and softer asking-rent achievability than the comps imply.
- What's the recent tenant-quality profile in this submarket — average credit score on applications, eviction rate, late-payment / NSF rate, and stable-employment percentage? A property-management company in the area should have these aggregated.
- How much new for-sale + rental construction is in the pipeline within 1–3 miles? Heavy new supply typically softens prices + rents 12–24 months out; constrained supply supports both.
Investment metrics
- 1% rule
- 0.83% ✗
- Cap rate
- 6.49%
- Cash-on-cash
- 0.72%
- DSCR
- 1.03
- GRM
- 10.1
CMA / ARV
- ARV (on-the-fly)
- $259,840
- Comps found
- 4
Show comp detail 4 sales within ~0.75 mi
| Address | Dist | Beds/Ba | Sqft | Sold | Price | $/sf | Match |
|---|---|---|---|---|---|---|---|
| 414 Fairfax Dr | 0.08mi | 3/2.5 | 1,574 (-12%) | 14mo | $85,000 | $54 | 62 |
| 177 Alameda Ave | 0.73mi | 3/2.0 | 1,750 (-2%) | 6mo | $515,000 | $294 | 56 |
| 322 Broadview Dr | 0.50mi | 3/2.5 | 1,727 (-4%) | 15mo | $251,000 | $145 | 56 |
| 221 Labelle Ave | 0.69mi | 3/1.5 | 1,595 (-11%) | 18mo | $135,000 | $85 | 32 |
Match score weights: distance 35% · size 25% · config 20% · recency 20%. Top-matched comps best support the ARV.
Projected returns pro-forma
-3.0% appreciation · 0.0% rent growth · sell at horizon
- IRR
- -18.3%
- Equity multiple
- 0.37×
- Total profit
- $-52,762
- Equity at exit
- $44,731
- IRR
- -17.4%
- Equity multiple
- 0.16×
- Total profit
- $-70,235
- Equity at exit
- $25,939
Cash invested: $84,000 (down + closing). Projections, not guarantees.
Landlord ↔ Tenant lean methodology
- Overall (STATE)
- 87 Strongly Landlord-Friendly
- State Florida
- 87 Strongly Landlord-Friendly · R+3
- County
- — inherits STATE
- City
- — inherits STATE
ZIP-level market 33905
- Home prices YoY
- -31.4%
- Rents YoY
- -3.0%
- Active inventory
- 768
- Price-to-rent
- 10.1×
Monthly cashflow live
- Estimated rent
- $2,487 high interval (Pro) →
- Mortgage (P&I)
- −$1,573
- Tax from tax record
- −$216 /mo · $2,594/yr
- Insurance
- −$125
- HOA
- −$0
- Vacancy / Maint / Mgmt
- −$522
- Net cashflow
- $50
Break-even live
Sensitivity live
| Price | -10% $220 | -5% $135 | +0% $50 | +5% $-35 | +10% $-120 |
|---|---|---|---|---|---|
| Rent | -10% $-146 | -5% $-48 | +0% $50 | +5% $148 | +10% $247 |
| Rate | -1.0pp $201 | -0.5pp $127 | base $50 | +0.5pp $-28 | +1.0pp $-107 |
UW: 25.0% down · 7.5% · 30yr · 1.5% tax · 5.0% vac · 8.0% maint · 8.0% mgmt
Financing live
Cash to close
- Down payment
- $75,000
- Closing costs
- $9,000
- Reserves months
- —
- Total cash needed
- —
Loan-product check · same deal, 3 products live
Conventional
25% down · 7.5% · 30yr
- Down + closing
- —
- Monthly P&I
- —
- Monthly cashflow
- —
- DSCR
- —
- Eligible?
- —
Personal DTI + credit; lowest rate.
DSCR
20% down · 8.5% · 30yr
- Down + closing
- —
- Monthly P&I
- —
- Monthly cashflow
- —
- DSCR
- —
- Eligible?
- —
No personal income docs; deal must DSCR.
Hard money
10% down · 12.0% · 12mo
- Down + closing
- —
- Monthly P&I
- —
- Monthly cashflow
- —
- DSCR
- —
- Eligible?
- —
Short-term bridge; refi at stabilization.
Rent comps 7 comps
| Address | Beds | Baths | Sqft | Rent | $/sqft | DOM | Units | Dist |
|---|---|---|---|---|---|---|---|---|
| 4530 Underwood Dr Unit 1 Fort Myers, FL | 4.0 | 4.0 | 2500 | $2,950 | $1.18 | 17d | 1 | 0.34mi |
| 9145 Flying Eagle DR Tice, FL | 1.0–3.0 | 1.0–2.5 | 1072 | $2,656 | $2.48 | 5d | 14 | 0.70mi |
| 4426 Poinsettia St Fort Myers, FL | 3.0 | 2.0 | 1815 | $1,795 | $0.99 | 5d | 1 | 0.72mi |
| 4464 E Riverside Dr Fort Myers, FL | 2.0 | 2.0 | 1447 | $2,600 | $1.80 | 25d | 1 | 0.74mi |
| 4434 Armeda Ave Fort Myers, FL | 3.0 | 2.0 | 1852 | $1,740 | $0.94 | 4d | 1 | 0.95mi |
| 337 Shore Dr Fort Myers, FL | 3.0 | 2.5 | 2296 | $3,800 | $1.66 | 25d | 1 | 1.08mi |
| 3975 Edgewood Ave Fort Myers, FL | 2.0 | 2.5 | 2025 | $2,500 | $1.23 | 25d | 1 | 1.39mi |
Listing history 16 events
-
2026-06-22days on market $300,000 Active 24 DOM
-
2026-06-18days on market $300,000 Active 21 DOM
-
2026-06-17days on market $300,000 Active 20 DOM
-
2026-06-16days on market $300,000 Active 19 DOM
-
2026-06-15days on market $300,000 Active 18 DOM
-
2026-06-13days on market $300,000 Active 16 DOM
-
2026-06-10days on market $300,000 Active 13 DOM
-
2026-06-09days on market $300,000 Active 12 DOM
-
2026-06-08days on market $300,000 Active 11 DOM
-
2026-06-07days on market $300,000 Active 10 DOM
-
2026-06-03days on market $300,000 Active 6 DOM
-
2026-06-02days on market $300,000 Active 5 DOM
-
2026-06-01days on market $300,000 Active 4 DOM
-
2026-05-31days on market $300,000 Active 3 DOM
-
2026-05-23$300,000 Active
-
1999-05-26soldstatus $65,800
ⓘ Source: listings_history table (triggers on properties + properties_extension) + one-shot
backfill from property_details.listing_events for pre-trigger history.
Tax reassessment forecast FL · Resets to sale price
- Current annual tax
- $2,594 · $216/mo
- Projected year-2 tax
- $2,594 · $216/mo
- Expected delta
- $0/yr ($0/mo · 0.0%)
ⓘ Screening estimate from a state-policy table — verify with the county assessor before closing.
Climate risk First Street
- Flood 1/10 Low FEMA zone X (unshaded) · 0% chance over 30 yrs
- Wildfire 2/10 Low
- Heat 10/10 Extreme 7 d/yr ≥107°F today · 30 d/yr by 30 yrs out
- Wind 10/10 Extreme 99% chance of damaging wind over 30 yrs
- Air quality 2/10 Low 1 unhealthy d/yr today · 1 by 30 yrs out
Nearby sold comps map
Loading sold comps map…
Walkable amenities ~0.75 mi
Loading nearby amenities…
Taxation est. · year 1
- Rental income
- $29,843
- − Mortgage interest
- −$16,805
- − Property taxes
- −$2,594
- − Insurance
- −$1,500
- − Repairs & maintenance
- −$2,387
- − Management
- −$2,387
- − Depreciation
- −$8,727
- Taxable loss
- −$4,558
- Est. tax savings @ 24.0%
- +$1,094
- After-tax cash flow
- $1,697/yr
For passive investors: Depreciation is non-cash, so a rental often shows a tax loss while cash-flowing — sheltering income. Rental losses are passive: they offset passive income freely, and up to $25,000/yr can offset ordinary (W-2) income if you actively participate and your MAGI is under $100k (phasing out to $0 by $150k); unused losses carry forward. On sale, claimed depreciation is recaptured at up to 25%, and gains may owe capital-gains tax (a 1031 exchange can defer both). Figures are a year-1 estimate at your 24.0% rate — not tax advice; consult a CPA.
Schools (NCES district)
- District
- Lee
- NCES district ID
- 1201080
- Math proficiency
- 47% ▼ -11.00%
- Reading proficiency
- 50% ▼ -4.00%
- Median HH income
- $49,518
- Composite
- 41.49/100
- National rank
- #3458
- State rank
- #42 of 73 in FL
Livability — Tice
- Score
- 67/100
- State rank
- #552
- US rank
- #10424
Category grades
Schools grade is shown separately in the Schools card above.
Census & demographics
- Census place
- Tice, FL
- County
- Lee County · 788,662 people
- Metro
- Cape Coral-Fort Myers, FL
- Population (ZIP)
- 41,381
- Household income
- $71,987
- Rent vs Own
- Severe rent burden
- 1358.0
Population outlook (Lee County) Hauer SSP2
- Today (2025)
- 871,946 people
- By 2030
- 955,468 · +9.6%
- By 2040
- 1,113,587 · +27.7%
- By 2050
- 1,256,891 · +44.1%
- By 2075
- 1,560,270 · +78.9%
- By 2100
- 1,726,848 · +98.0%
Race, ethnicity, and origin ACS 2023
- Neighborhood character
- Diverse neighborhood (Simpson 0.59)
- Race & ethnicity
- White 53% Hispanic / Latino 34% Two or more races 17% Black 9% Native American 4% Asian 2%
- Hispanic origin (detail)
- Mexican 11% Puerto Rican 5% Cuban 2%
- Common ancestry
- Romanian 2% Slovak 2% Lithuanian 2%
- Foreign-born
- 20% · Canada, Jamaica
- Languages at home
- 68% English-only · Spanish 29% Other Indo-European 1% German/W. Germanic 1%
Political lean MEDSL · Lee
- 2024 margin
- Strong R (+28.4) · D 35.5% · R 63.9%
- 2008→2024 swing
- -18.0pp toward R · 2008: -10.4pp · 2024: -28.4pp
- All cycles
- 2024: R+28.4 2020: R+19.2 2016: R+20.4 2012: R+16.6 2008: R+10.4
Not yet ingested
- Civics
- —
Market trends
- HPI YoY
- ▼ -122.89%
- Current HPI
- 268.4598
- Rent YoY
- ▼ -2.97%
- Metro
- Cape Coral-Fort Myers, FL
- State GDP YoY
- ▲ 3.28%
- F500 in state
- 36
Industry mix (Fortune 500 HQ in FL)
| Industry | F500 HQs | Revenue |
|---|---|---|
| Industrial Technology | 2 | $29B |
|
||
| Insurance | 2 | $17B |
|
||
| Retail | 1 | $60B |
|
||
| Technology Distribution | 1 | $58B |
|
||
| Homebuilding | 1 | $35B |
|
||
| Technology Manufacturing | 1 | $35B |
|
||
Price history
+355.9% since first listed2 events — show timeline
- 2026-05-23 Listed $300,000 FORTMLS
- 1999-05-26 Sold (Public Records) $65,800 Public Records
Property tax history
+24.7%/yrLatest (2025): $2,594 · +3.8% YoY. Source: county tax records.
Cash-flow waterfall
monthlySold comps — $/sqft
last 12 mo · ≤1 miLoading sold comps…