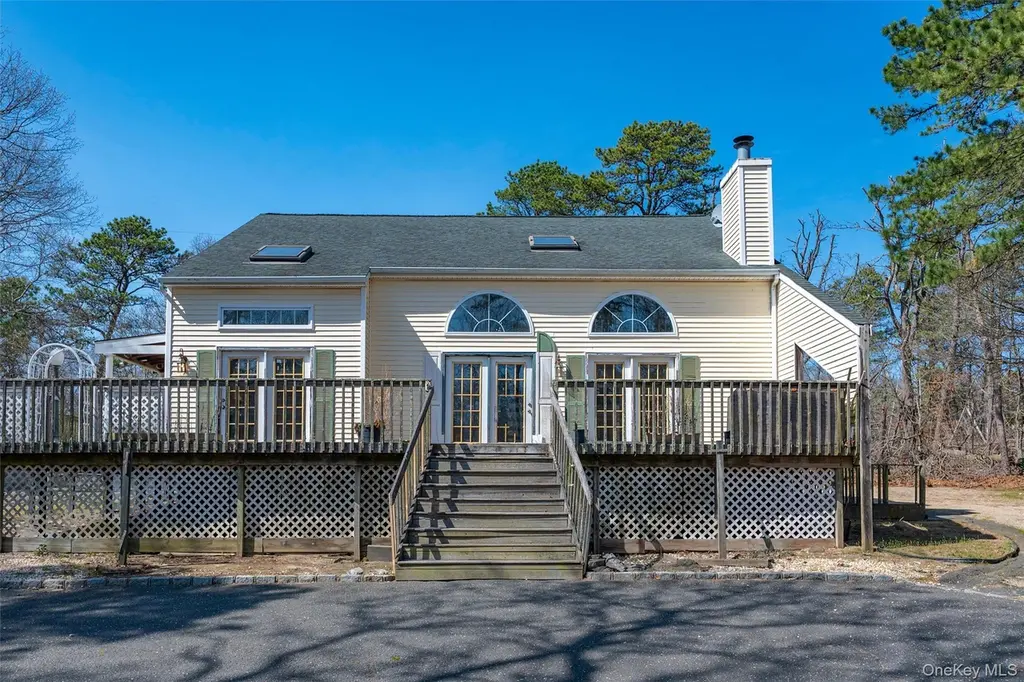
221 E Montauk Hwy · Hampton Bays, NY
Flood risk 1/10 · Minimal
- FEMA flood zone
- X (unshaded)
- Chance of flooding over 30 yrs
- 0.0%
- Est. flood insurance / yr
- $473 – $860
Fire risk 1/10 · Minimal
- Est. fire insurance / yr
- $691 – $1,283
Heat risk 4/10 · Minor
- Hot days now (above 90°F)
- 7 days/yr
- Hot days in 30 yrs
- 21 days/yr
Wind risk 8/10 · Major
- Chance of severe wind over 30 yrs
- 80.0%
Air-quality risk 3/10 · Minor
- Unhealthy air days now
- 2 days/yr
- Unhealthy air days in 30 yrs
- 3 days/yr
Risk factors via First Street. Map © Google.
Why this score? — see what drove the B+ grade
The composite is a weighted blend of 9 inputs, each scored 0–100. Each bar is that input's sub-score; the figure is the points it added to the 100-point composite (weight × sub-score).
- Cash flow +30.0/30.0
- ARV discount +15.0/15.0
- DSCR +10.0/10.0
- 1% rule +8.3/10.0
- Rent growth +5.0/5.0
- Schools +4.0/10.0
- Livability +3.4/5.0
- Condition / age +2.5/5.0
- Appreciation +0.0/10.0
$849,000
🖨 Deal sheet (PDF) 📄 Offer letter ✓ Due diligence
Listing remarks
Welcome to 221 E Montauk Highway, a rare opportunity in the heart of Hampton Bays offering exceptional upside for investors, builders, or end-users ready to create their vision in the Hamptons. Set on a full acre in an R20 zoning district, this property presents the potential for subdivision or redevelopment. The home also features a large basement with egress already in place, offering potential for expanded use or flexible living configurations. The existing 5-bedroom, 3-bath home spans approximately 1,840 square feet (not including the basement) and features hardwood floors, a fireplace, and generous living space. While the home is in need of renovation it provides a footprint and layout
Key facts
- In-ground pool
- R20 zoning district
- Large basement
Tags
Neighborhood map
What this means for you Summary
Snapshot
- This is a 5-bed/3.0-bath single-family listed at $849k.
Deal economics
- At list price, monthly cash flow is $3k ($41k/yr) — positive.
- The deal already cash-flows at list — no discount required.
- Meets the 1% rule at list price ($11k rent vs $849k).
- Recommended offer: $836k (1.5% below list) — sets the bar for market timing.
- Cap rate 11.1% vs local median 6.4% in Hampton Bays — top-decile yield for the area; either an underpriced asset or a hidden risk that comps aren't pricing in. Stress-test before assuming the spread holds.
Location & tenants
- Location reads 68/100 on livability (#551 in NY) — a middle-class / working-renter tenant base. Strengths: crime A+, employment A+, health & safety B+; Watch: amenities F, commute F, cost of living F.
- Hampton Bays Union Free School District (suburban): math 45% / reading 44% proficiency, ranked #434 of 590 in NY (top 74%) — families likely to look elsewhere, expect single-tenant / working-renter base with shorter leases.
- Market conditions: Rents rising fast (+16.1%/yr); 172 active listings in the ZIP; 13 comparable units currently listed for rent nearby; rentals at typical pace (median 25d on market — plan ~3-4 weeks tenant-placement turnaround); high-income renter base; 1,366 units permitted in Suffolk County in 2024 (216 in 5+ unit buildings).
- At $11,273/mo this rent would consume 101% of the median local household income ($134k/yr) (locally 199% of renters already pay >50% of income on rent) — very limited rent-growth headroom before tenants either downsize or default.
Forward outlook
- Local home prices are declining (-3.0%/yr); year-one equity from $6k of loan paydown is wiped out by about $25k of value loss. Plan a longer hold.
- Suffolk County population projected to shrink 5% by 2050 — rents likely to lag national; underwrite the cash flow, not the appreciation.
- At projected returns (-3.0% appreciation + 8.0% rent growth), your $238k cash investment doubles in ~6 years — after that, you're playing with house money.
Negotiation context
- It's been on market 25 days — a 2% lower offer ($836k) is reasonable based on typical stale-listing flexibility.
- Current owner paid $33k; list at $849k implies a 2473% gain — meaningful room to come down on a strong offer.
Risks & watch-outs
- Climate carrying-cost: severe wind risk, 80% chance of damaging wind over 30y — expect insurance premiums to compound above CPI over the hold.
Questions for the listing agent
- Is there a deadline driving the sale (1031 exchange, divorce, estate, relocation)? That informs how much negotiation room exists.
- Schools are B-rated — typically a magnet for longer-tenancy family renters. What's the average tenant stay here, and is there a school-zone premium baked into asking?
- What's the average days-on-market for RENTAL listings here right now (not sales)? A rising rental-DOM trend means longer vacancies and softer asking-rent achievability than the comps imply.
- What's the recent tenant-quality profile in this submarket — average credit score on applications, eviction rate, late-payment / NSF rate, and stable-employment percentage? A property-management company in the area should have these aggregated.
- How much new for-sale + rental construction is in the pipeline within 1–3 miles? Heavy new supply typically softens prices + rents 12–24 months out; constrained supply supports both.
Investment metrics
- 1% rule
- 1.33% ✓
- Cap rate
- 11.14%
- Cash-on-cash
- 17.32%
- DSCR
- 1.77
- GRM
- 6.3
CMA / ARV
- ARV (median comp)
- $1,103,523
- List price
- $849,000
- Delta
- -23.06%
- Verdict
- UNDERPRICED
- Comps
- 18 within 1.0 mi
Show comp detail 2 sales within ~0.75 mi
| Address | Dist | Beds/Ba | Sqft | Sold | Price | $/sf | Match |
|---|---|---|---|---|---|---|---|
| 10 Pepi Ct | 0.45mi | 4/3.5 (-1) | 2,024 (+10%) | 6mo | $1,270,000 | $627 | 50 |
| 8 E Canal Ct | 0.42mi | 5/2.0 | 2,016 (+10%) | 21mo | $875,000 | $434 | 43 |
Match score weights: distance 35% · size 25% · config 20% · recency 20%. Top-matched comps best support the ARV.
Projected returns pro-forma
-3.0% appreciation · 8.0% rent growth · sell at horizon
- IRR
- 14.0%
- Equity multiple
- 1.59×
- Total profit
- $140,445
- Equity at exit
- $126,589
- IRR
- 26.2%
- Equity multiple
- 3.84×
- Total profit
- $674,532
- Equity at exit
- $73,406
Cash invested: $237,720 (down + closing). Projections, not guarantees.
Landlord ↔ Tenant lean methodology
- Overall (STATE)
- 15 Strongly Tenant-Friendly
- State New York
- 15 Strongly Tenant-Friendly · D+10
- County
- — inherits STATE
- City
- — inherits STATE
ZIP-level market 11946
- Home prices YoY
- -20.3%
- Rents YoY
- 16.1%
- Active inventory
- 172
- Price-to-rent
- 6.3×
Monthly cashflow live
- Estimated rent
- $11,273 medium interval (Pro) →
- Mortgage (P&I)
- −$4,452
- Tax from tax record
- −$669 /mo · $8,025/yr
- Insurance
- −$354
- HOA
- −$0
- Vacancy / Maint / Mgmt
- −$2,367
- Net cashflow
- $3,431
Break-even live
Sensitivity live
| Price | -10% $3,911 | -5% $3,671 | +0% $3,431 | +5% $3,191 | +10% $2,950 |
|---|---|---|---|---|---|
| Rent | -10% $2,540 | -5% $2,986 | +0% $3,431 | +5% $3,876 | +10% $4,321 |
| Rate | -1.0pp $3,858 | -0.5pp $3,647 | base $3,431 | +0.5pp $3,211 | +1.0pp $2,987 |
UW: 25.0% down · 7.5% · 30yr · 1.5% tax · 5.0% vac · 8.0% maint · 8.0% mgmt
Financing live
Cash to close
- Down payment
- $212,250
- Closing costs
- $25,470
- Reserves months
- —
- Total cash needed
- —
Loan-product check · same deal, 3 products live
Conventional
25% down · 7.5% · 30yr
- Down + closing
- —
- Monthly P&I
- —
- Monthly cashflow
- —
- DSCR
- —
- Eligible?
- —
Personal DTI + credit; lowest rate.
DSCR
20% down · 8.5% · 30yr
- Down + closing
- —
- Monthly P&I
- —
- Monthly cashflow
- —
- DSCR
- —
- Eligible?
- —
No personal income docs; deal must DSCR.
Hard money
10% down · 12.0% · 12mo
- Down + closing
- —
- Monthly P&I
- —
- Monthly cashflow
- —
- DSCR
- —
- Eligible?
- —
Short-term bridge; refi at stabilization.
Rent comps 13 comps
| Address | Beds | Baths | Sqft | Rent | $/sqft | DOM | Units | Dist |
|---|---|---|---|---|---|---|---|---|
| 20 Stuart Ct Hampton Bays, NY | 5.0 | 3.5 | 2168 | $20,000 | $9.23 | 25d | 1 | 0.22mi |
| 10 Ginny Ln Hampton Bays, NY | 4.0 | 3.5 | 2596 | $30,000 | $11.56 | 25d | 1 | 0.48mi |
| 48 Fanning Ave Hampton Bays, NY | 4.0 | 2.5 | 2400 | $12,500 | $5.21 | 19d | 1 | 0.62mi |
| 9 Tramposh Ln Hampton Bays, NY | 4.0 | 2.0 | 2092 | $10,000 | $4.78 | 5d | 1 | 0.66mi |
| 10 Columbine Ave N Hampton Bays, NY | 4.0 | 2.0 | 1560 | $45,000 | $28.85 | 25d | 1 | 0.86mi |
| 2 W Hillover Rd Hampton Bays, NY | 5.0 | 3.0 | 2000 | $25,000 | $12.50 | 19d | 1 | 0.97mi |
| 47 School St Hampton Bays, NY | 4.0 | 3.0 | 1700 | $25,000 | $14.71 | 44d | 1 | 0.98mi |
| 71 Old Canoe Place Rd Hampton Bays, NY | 4.0 | 2.5 | 2300 | $20,000 | $8.70 | 44d | 1 | 1.03mi |
| 8 Westerly Ct Hampton Bays, NY | 4.0 | 2.0 | 2300 | $25,000 | $10.87 | 25d | 1 | 1.04mi |
| 8 Wakeman Ct Hampton Bays, NY | 4.0 | 3.0 | 1932 | $11,000 | $5.69 | 25d | 1 | 1.04mi |
| 6 Peconic Rd Southampton, NY | 4.0 | 3.0 | 2500 | $38,000 | $15.20 | 44d | 1 | 1.22mi |
| 23 N Westbury Rd Hampton Bays, NY | 4.0 | 3.5 | 2212 | $12,000 | $5.42 | 25d | 1 | 1.23mi |
| 30 Squires Blvd Hampton Bays, NY | 5.0 | 3.0 | 2220 | $25,000 | $11.26 | 25d | 1 | 1.34mi |
Listing history 3 events
-
2026-05-31status $849,000 Pending 25 DOM
-
2026-04-20$849,000 Active
-
1996-06-11soldstatus $33,000
ⓘ Source: listings_history table (triggers on properties + properties_extension) + one-shot
backfill from property_details.listing_events for pre-trigger history.
Tax reassessment forecast NY · Partial reset (capped growth)
- Current annual tax
- $8,025 · $669/mo
- Projected year-2 tax
- $11,187 · $932/mo
- Expected delta
- +$3,162/yr (+$263/mo · 39.4%)
ⓘ Screening estimate from a state-policy table — verify with the county assessor before closing.
Climate risk First Street
- Flood 1/10 Low FEMA zone X (unshaded) · 0% chance over 30 yrs
- Wildfire 1/10 Low
- Heat 4/10 Moderate 7 d/yr ≥90°F today · 21 d/yr by 30 yrs out
- Wind 8/10 Severe 80% chance of damaging wind over 30 yrs
- Air quality 3/10 Moderate 2 unhealthy d/yr today · 3 by 30 yrs out
Nearby sold comps map
Loading sold comps map…
Walkable amenities ~0.75 mi
Loading nearby amenities…
Taxation est. · year 1
- Rental income
- $135,276
- − Mortgage interest
- −$47,557
- − Property taxes
- −$8,025
- − Insurance
- −$4,245
- − Repairs & maintenance
- −$10,822
- − Management
- −$10,822
- − Depreciation
- −$24,698
- Taxable income
- $29,106
- Est. tax owed @ 24.0%
- −$6,985
- After-tax cash flow
- $34,185/yr
For passive investors: Depreciation is non-cash, so a rental often shows a tax loss while cash-flowing — sheltering income. Rental losses are passive: they offset passive income freely, and up to $25,000/yr can offset ordinary (W-2) income if you actively participate and your MAGI is under $100k (phasing out to $0 by $150k); unused losses carry forward. On sale, claimed depreciation is recaptured at up to 25%, and gains may owe capital-gains tax (a 1031 exchange can defer both). Figures are a year-1 estimate at your 24.0% rate — not tax advice; consult a CPA.
Schools (NCES district)
- District
- Hampton Bays Union Free School District
- NCES district ID
- 3613530
- Math proficiency
- 45% ▼ -8.00%
- Reading proficiency
- 44% ▼ -1.00%
- Median HH income
- $70,274
- Composite
- 40.18/100
- National rank
- #3788
- State rank
- #434 of 590 in NY
Livability — Hampton Bays
- Score
- 68/100
- State rank
- #551
- US rank
- #9894
Category grades
Schools grade is shown separately in the Schools card above.
Census & demographics
- Census place
- Hampton Bays, NY
- County
- Suffolk County · 679,920 people
- City population
- 15,819
- Metro
- New York-Newark-Jersey City, NY-NJ-PA
- Population (ZIP)
- 15,819
- Household income
- $133,918
- Rent vs Own
- Severe rent burden
- 199.0
Population outlook (Suffolk County) Hauer SSP2
- Today (2025)
- 1,505,262 people
- By 2030
- 1,498,318 · -0.5%
- By 2040
- 1,471,101 · -2.3%
- By 2050
- 1,424,848 · -5.3%
- By 2075
- 1,337,157 · -11.2%
- By 2100
- 1,217,720 · -19.1%
Race, ethnicity, and origin ACS 2023
- Neighborhood character
- Majority White (62%)
- Race & ethnicity
- White 62% Hispanic / Latino 32% Two or more races 13% Asian 3% Black 2%
- Hispanic origin (detail)
- Mexican 6%
- Common ancestry
- Romanian 4% Slovak 2% Portuguese 2%
- Foreign-born
- 26% · Canada, Jamaica, Guatemala
- Languages at home
- 64% English-only · Spanish 29% Other Indo-European 2% French/Haitian/Cajun 2%
Political lean MEDSL · Suffolk
- 2024 margin
- Lean R (+10.0) · D 45.0% · R 55.0%
- 2008→2024 swing
- -16.0pp toward R · 2008: 6.0pp · 2024: -10.0pp
- All cycles
- 2024: R+10.0 2020: R+0.0 2016: R+8.2 2012: D+2.9 2008: D+6.0
Not yet ingested
- Civics
- —
Market trends
- HPI YoY
- ▼ -118.82%
- Current HPI
- 467.2466
- Rent YoY
- ▲ 16.07%
- Metro
- New York-Newark-Jersey City, NY-NJ-PA
- State GDP YoY
- ▲ 2.60%
- F500 in state
- 92
Industry mix (Fortune 500 HQ in NY)
| Industry | F500 HQs | Revenue |
|---|---|---|
| Financial Services | 10 | $950B |
|
||
| Consumer Goods | 9 | $162B |
|
||
| Insurance | 4 | $225B |
|
||
| Telecommunications | 2 | $144B |
|
||
| Pharmaceuticals | 2 | $112B |
|
||
| Media / Entertainment | 2 | $69B |
|
||
Price history
+2472.7% since first listed2 events — show timeline
- 2026-04-20 Listed $849,000 OneKey® MLS as Distributed by MLS Grid
- 1996-06-11 Sold (Public Records) $33,000 Public Records
Property tax history
+1.6%/yrLatest (2022): $8,025 · +0.0% YoY. Source: county tax records.
Cash-flow waterfall
monthlySold comps — $/sqft
last 12 mo · ≤1 miLoading sold comps…